How the CPI Affects Oil Prices

7 minutes for reading
The US inflation data for January, which was released on 14 February 2023, fell short of Wall Street analysts' expectations: while the figure was forecasted to be 6.2%, it reached 6.4%. Market participants took this result as a signal of further monetary policy tightening by the Federal Reserve System (Fed).
Against this backdrop, the S&P 500 index (US500) lost 1.2% in four hours and Brent crude was down 1.6%. Why does US inflation data have such an impact on the price of black gold? We will try to answer this question in today's article.
Inflation in the US
In March 2022, the Fed initiated a cycle of monetary policy tightening to fight the sharp rise in inflation, which by then had reached 7.2%. The regulator set a target of reducing the rate to 2%.
At the time, Federal Reserve Chairman Jerome Powell believed that the rising inflation was short-lived. Perhaps the situation was being compared to that after the mortgage crisis in 2007-2008. Back then, inflation rose to 2.7% and headed downwards – the government had to stimulate the economy to keep it from slipping into recession and to stop inflation from being replaced by deflation. In other words, the economy had come to a halt after the mortgage crisis and had to be restarted by introducing various incentives and lowering the interest rate.
The current situation is different: the economy is rushing ahead and needs to be slowed down before it gets out of control. The Fed has launched leverage mechanisms in the form of higher interest rates and tighter monetary policy. And so far, these steps are yielding results: After reaching a peak of 9.1% in July 2022, inflation started to decline gradually. As we pointed out above, the statistic for January is 6.4%.
Why is inflation slowing down?
We mentioned above that experts had predicted a more marked decline in inflation and expected January's figure to be 6.2% - in fact, it reached 6.4%. This is the third time in the last year that the figure has fallen slower than market expectations.
To understand what is happening, let’s look at the cost of motor fuel and compare the graphs of inflation and petrol prices in the US. You may notice the connection between these figures.
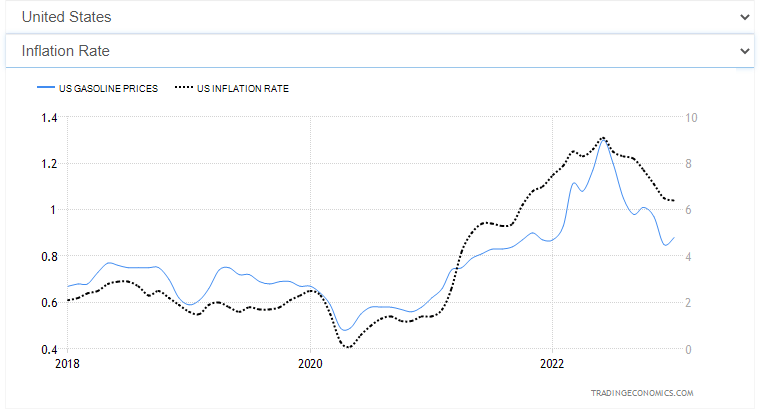
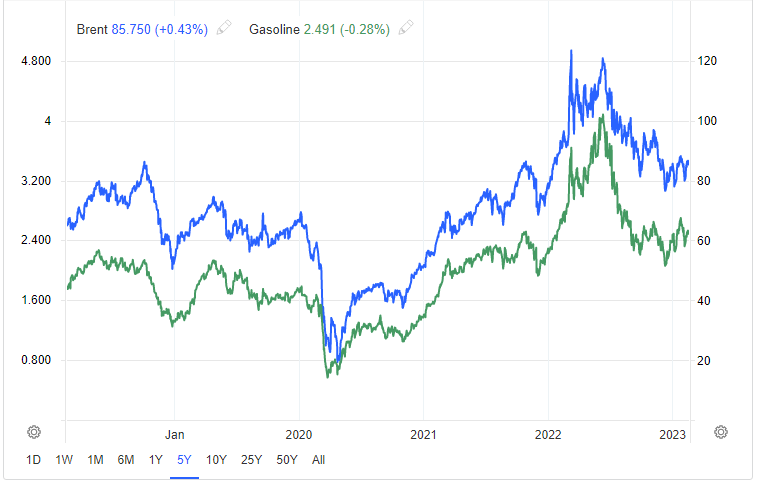
The data for January indicates an increase in the cost of motor fuel, which may have triggered a slowdown in the rate of decline in inflation. Further attention should be paid to the cost of Brent oil and a gallon of petrol in the US – note the correlation in the graph. This suggests that the fight against high inflation is also a fight against expensive oil. This may be the reason why oil prices dropped after the January inflation figures were published


Oil price and monetary tightening
How will oil prices behave if the Fed continues to tighten monetary policy? Perhaps an increase in the interest rate will slow the economy, which will ultimately reduce the demand for black gold. Experience shows that oil has not appreciated during a period of high-interest rates and subsequent rate hikes.
Between 2003 and 2006, the US interest rate increased from 1% to 5.25%, during which time the value of oil rose from USD 55 to USD 109. From the end of 2015 to the end of 2018, during which the interest rate rose from 0.25% to 2.5%, the price of oil rose in value from USD 40 to USD 86.
Given this information, it can be assumed that if the regulator raises the discount rate, oil prices are not threatened: a rate increase signals a strong economy accompanied by high demand for raw materials.
US attempts to stop oil prices from rising
The economic slowdown is bordering on rising unemployment, which is a negative and destabilising factor for the country. Therefore, the Federal Reserve is acting very cautiously, and the US government is taking other measures to curb the price of black gold.
For example, the sale of 26 million barrels of oil from the strategic reserves was announced in February. Before that, 180 million barrels had been sold, which led to a drop in US reserves to 1983 levels. The recent sale of 26 million barrels has reduced the strategic reserves to 345 million barrels.
In addition, the G7 countries have followed the EU in imposing price ceilings on oil sourced from Russia. On the one hand, this contains the growing cost of raw materials, on the other hand, it leads to a supply shortage in the market, because Russia intends to reduce production in March by 500,000 barrels per day. Moreover, OPEC countries are not interested in a drop in oil prices and do not plan to increase production in response to Russia's production cuts.
Oil demand in OECD, China, and India
The OECD (Organisation for Economic Co-operation and Development) is an international organisation established in 1961 to coordinate economic policy. Today, it has 38 member countries, including the US, Japan, the UK, Germany, and France. China and India are not members of the OECD.
According to OPEC's forecasts, total world demand will increase from the current 99.4 million bpd to 107 million bpd by 2027. It is assumed that black gold consumption in OECD countries will gradually decline after 2024. However, in non-OECD countries, demand will increase due to an expanding middle class, rising population, and economic growth rates. The main influence on demand is expected to come from China, and later from India.
Revenues from oil companies
In 2022, the average price per barrel of Brent crude was around USD 105. Let's look at the profitability and net income of the largest companies by capitalisation that explore, produce, and sell black gold and whose stocks are traded on US exchanges last year:
- ConocoPhillips (NYSE: COP): USD 18.68 billion profit and 20.3% margin
- EOG Resources Inc. (NYSE: EOG): earnings of USD 7.46 billion and profitability of 20.3%
- Canadian Natural Resources Limited (NYSE: CNQ): $9.36 billion profit and 28.6% margin
For 2022, these companies generated record net profits and their business profitability exceeded 20%. It can be assumed that if oil prices remain the same or rise, this will have a positive impact on the business of oil and gas companies.
Risks
In the summer of 2022, when rising gasoline prices in the US caused a wave of outrage among the population and the government took steps to stabilise fuel prices, there were serious accusations against oil and gas companies. The accusation that the oil industry is making excessive profits could lead to the imposition of additional taxes on them.
The likelihood of additional taxation for oil and gas companies is also heightened by the fact that there is an upcoming presidential election in the US in 2024. The parties are now deciding on their candidates, and politicians can move on from words to deeds to boost their ratings among the public.
Conclusion
- The value of oil tends to rise during the rate hike cycle
- A higher inflation rate means a further tightening of monetary policy
- OPEC forecasts that oil consumption will continue to rise
- China and India are gradually increasing their consumption of black gold
- The US is selling off oil reserves to keep prices down
- The states will have to replenish reserves and become a buyer in the oil market
- The Fed is trying to slow down the country's economy
- Oil prices, if maintained or increased, will have a positive impact on the business of oil and gas companies
- The main risk is a slowdown in the US economy, reduced demand for oil, and its depreciation.


