Divergence and convergence stand for the process of diverging/converging of the price chart and the trading indicator. These are good trading signals used for opening and closing positions.
All posts

Standard Deviation indicator helps to assess volatility dynamics of a financial instrument and to find promising entry points. The article explains how to use it in trading and gives examples of its main trading signals.
The Hammer and Shooting Star patterns on the price charts warn of an upcoming correction or a reversal of the current trend. The article describes how the patterns form and how to trade them.

We provide insight into the “Daily Breakout and Moving Average” strategy, explain how to buy and sell by it correctly using and combining three different indicators.

The Debt to Equity market ratio demonstrates the ratio of the liabilities of the company to the equity. How is it calculated? What advantages and disadvantages does it have? The answers are in the article.
Have you mastered graphic analysis? Can you differ a Flag from a Pendant or a Head and Shoulders pattern from a Triple Bottom? Take our quiz and check yourself.
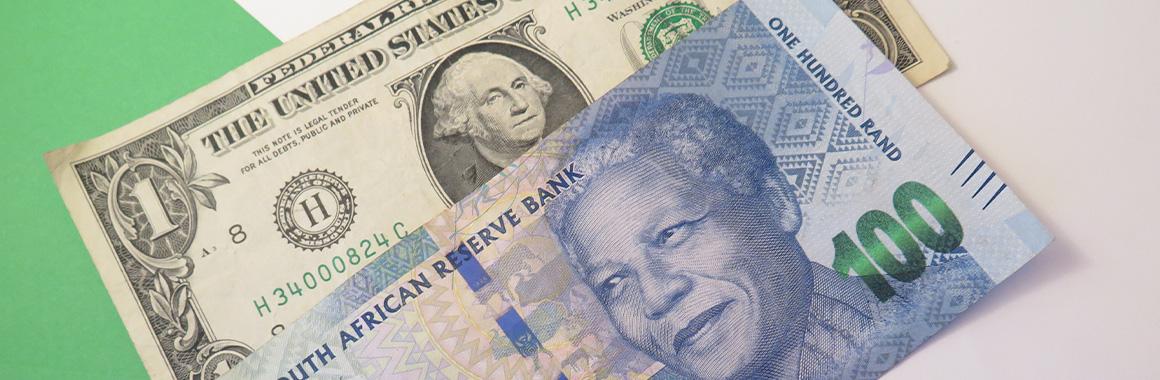
USD/ZAR is an exotic currency pair with high volatility. Some traders tend to avoid it. The article describes trading options for this pair.

The EIA report on the changes in the US oil inventories has a great influence on the quotations of black oil. Traders and investors assess the data carefully and use them for short-term and long-term trading.

Demystifying Stock Dilution: Dive into the mechanisms of stock dilution, its impact on share prices, and strategic moves for shareholders. Uncover comprehensive insights in the article.

This article describes forming and trading principles of the Piercing Pattern and Dark Cloud Cover. These reversal candlestick patterns predict the beginning of a correction or a reversal of the current pattern.
The article goes into the details of the “Follow the Trend” strategy, its rules and principles. It explains how to buy and sell, using it correctly and combining three indicators.

What does the On Balance Volume indicator show? What is its calculation method? What are its characteristics and settings? How is OBV used for trading? The answers to these and more questions are given in the article.
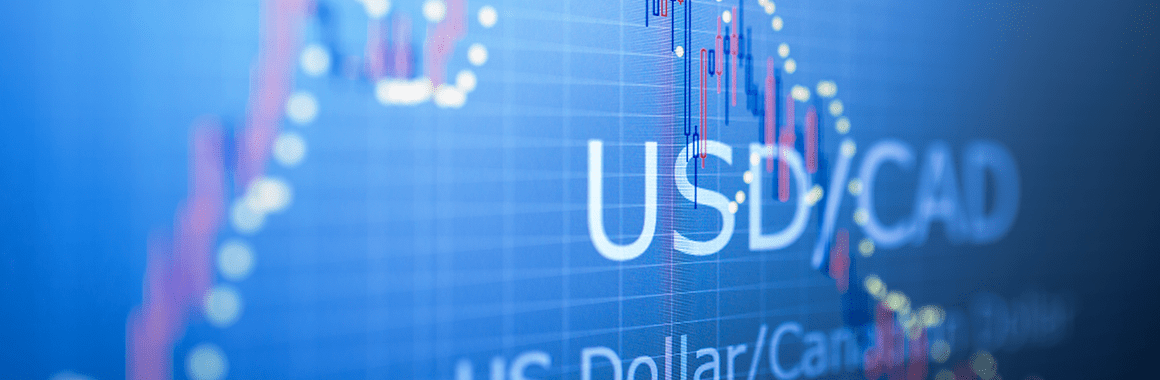
USD/CAD – the US dollar against the Canadian dollar – is a major currency pair, popular among Forex traders. The article describes some factors that influence the quotations and the main ways of trading the pair.
In this post, we have put together information for beginners on how to invest in stocks. We described it in the most simple and accessible words. If you still think that investing in stocks is difficult, then this post is for you!

This article is devoted to financial reports of companies, their contents, period, and place of publication. We will see how this information can influence trading decisions.