EXTRA Trading Strategy Basics

6 minutes for reading
EXTRA Strategy - is the art of thinking.
The word strategy is derived from the Greek "strategos" which means hero, leader, commander-in-chief, the one able to manage people and resources in order to reach a goal.
EXTRA strategy implies the ability to read the situation and see the perspectives of the financial markets.
EXTRA strategy, like any other, has long-term, mid-term and short-term goals. At the basis of this strategy lies a MATRIX. A matrix is practically the basic structure of the Elliott waves.
Elliott waves

The MATRIX of EXTRA strategy
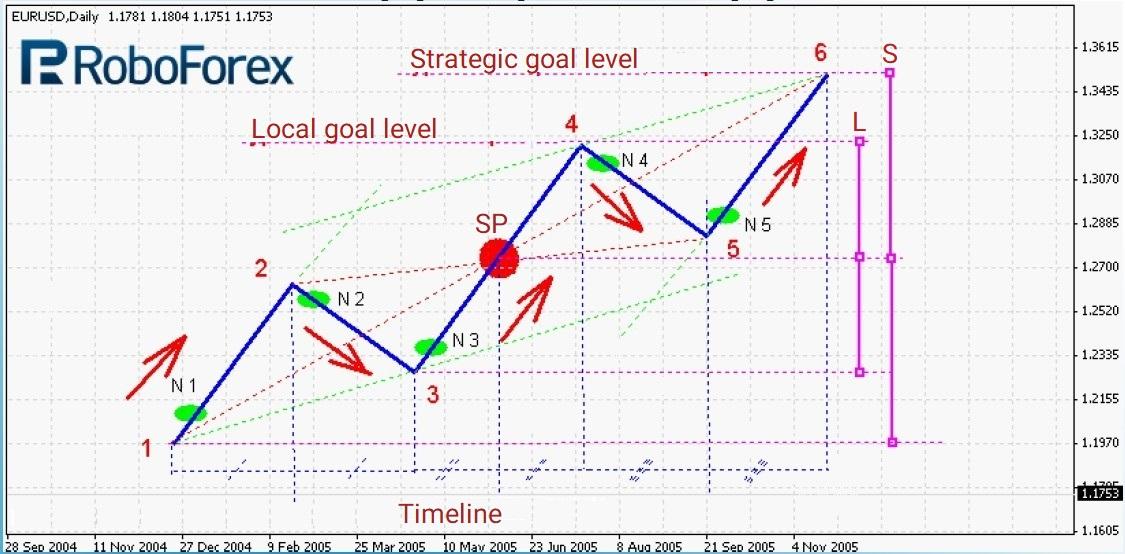
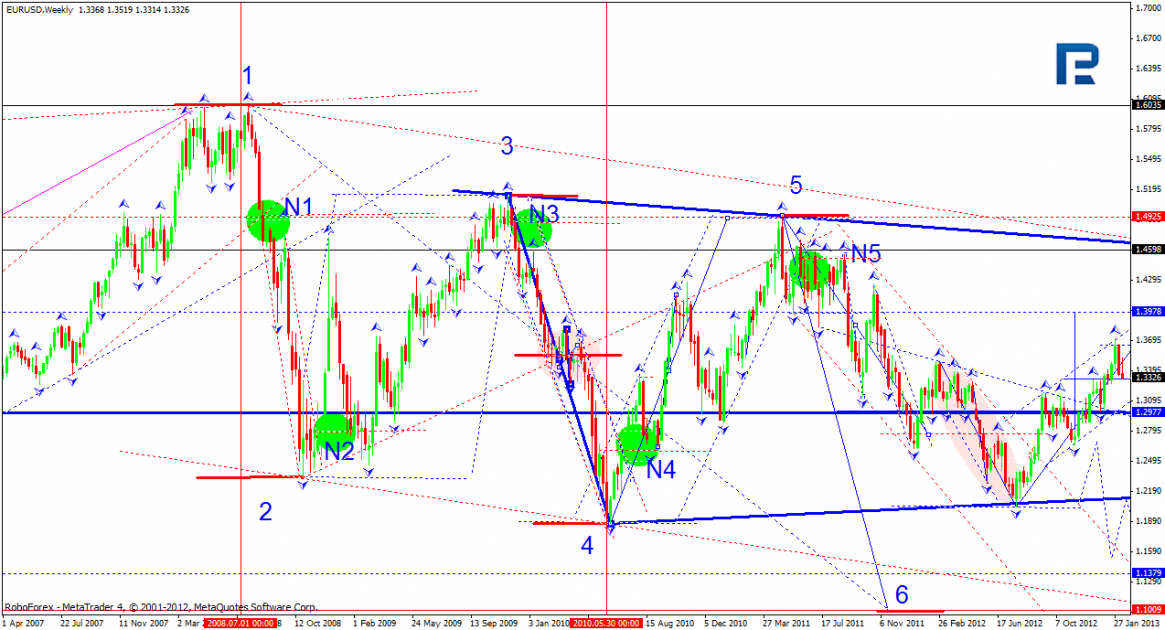
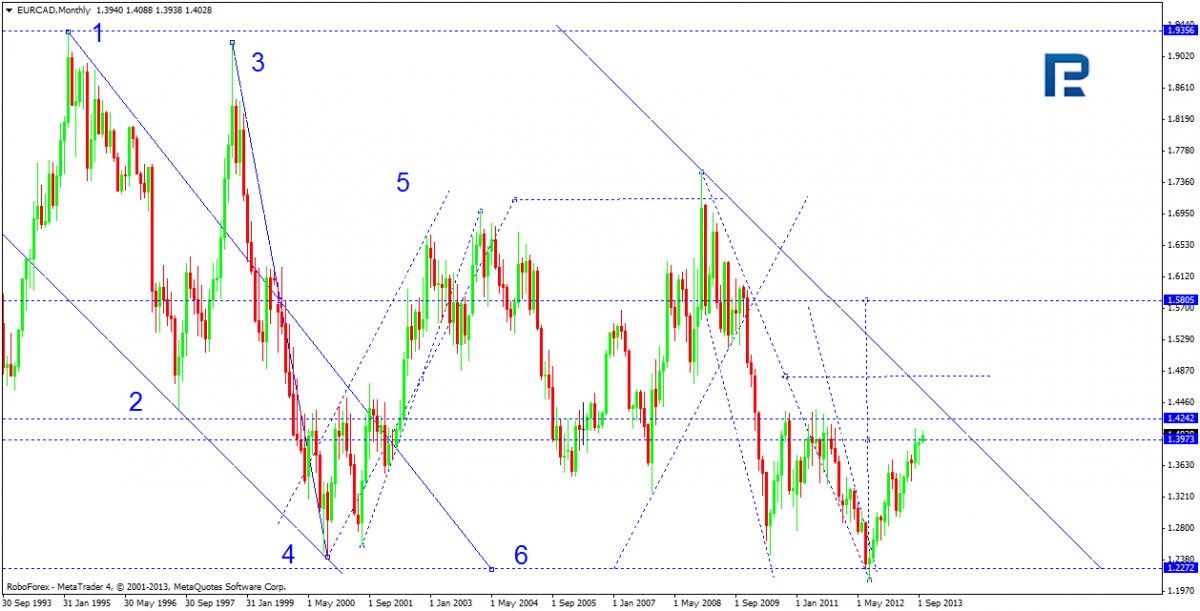
According to Elliott, there are 13 models of market behavior that can be singled out. However, the complexity of these models leads traders to misinterpret the events. So, trading by them is an especially hard task. The MATRIX allows for trading each tendency separately. In the picture, the pivot levels of the model are highlighted: 1,2,3,4,5,6.
The model is shown in its perfect variant, symmetrical both in terms of time and levels. The division into five waves is clearly visible. In practice, we will most likely have certain deviations of time; however, the minimum of pivot levels is carefully executed.
- Red arrows are market tendencies.
- N1; N2; N3; N4; N5 green ellipses are areas of interest for buying and selling.
- SP (ТВ) is the spinning point
- L (Л) is the local goal
- S (С) is the strategic goal.
Practically, 1-2-3-SP and SP-4-5-6 are two symmetrical mirror-image rhombuses.
- If the rhombus, reflected through the spinning point, is, in reality, bigger, we can speak about fractal development of the wave.
- If the SP is above the pivot 2, we can speak about a new trade wave developing. After a correction, the trend will resume its development.
- If the SP is below the pivot 2, there is a correctional structure in the wave development. And the market is going to continue the trend that appeared before this model.
Let us give a number of examples of such MATRIX models on different trading instruments:
AUD/USD

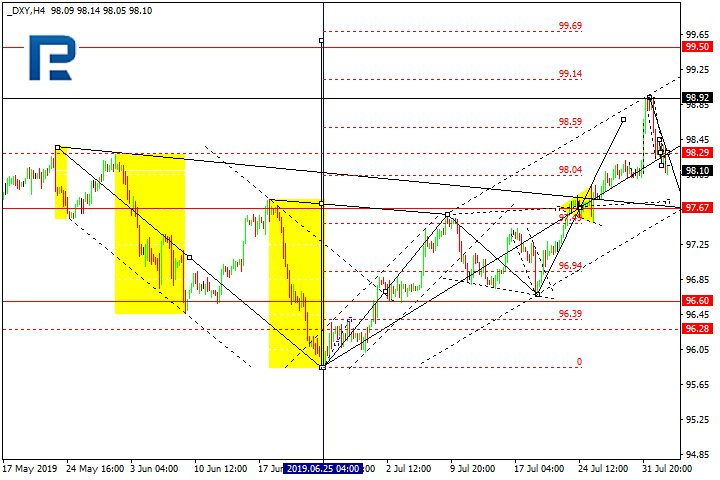
In each MATRIX special importance is assigned to the forming of the pivot level. This level is the beginning of a new trend. Let us have a look at such a level formed on the dollar index on June 25th, 2019. Such levels are characteristic of all markets: financial, commodity, stock, etc.
DXY
EUR/USD

There are ten such phenomena in the MATRIX. Since 2005 all of them have been structured and united in the EXTRA trading system, that can be used successfully for trading on financial markets.
EXTRA does not have indicators. It is used either for forecasting the market behaviour or for real trading on marginal accounts.
EXTRA is the first system to introduce such notions as:
- pivot level
- carriers
- interest areas for buying and selling
- investor step
- spinning point - local goal of development, strategic goal of development,
- growth/decline potential.
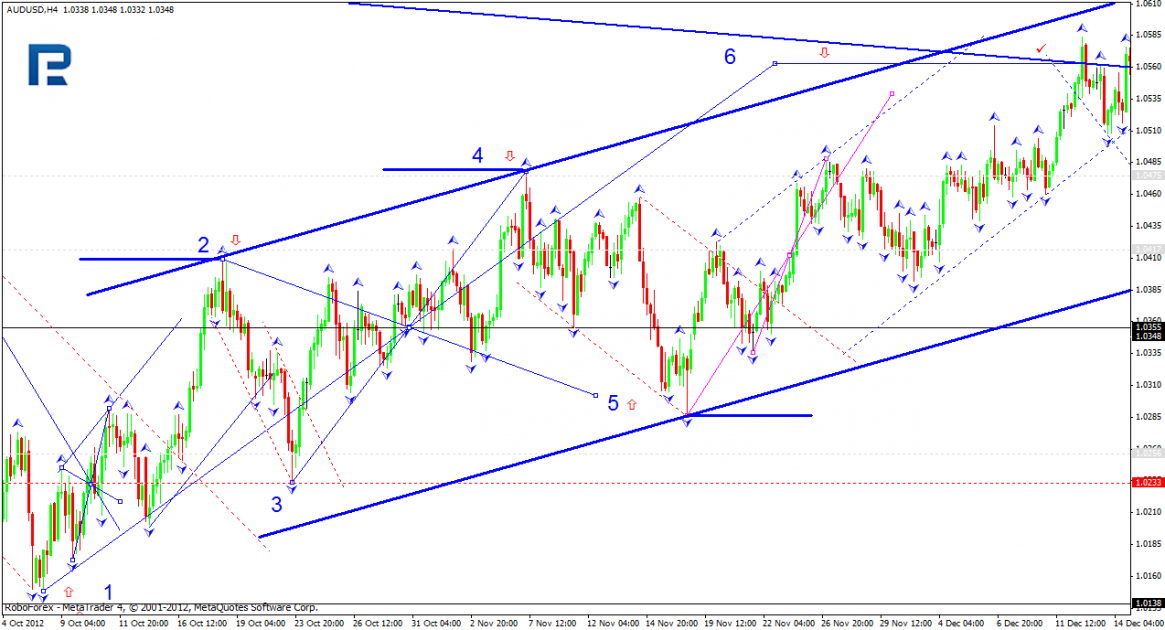
The drawing of channels on such models is based on the two pivots 2 and 4 and the parallel from 5.
For the main work, daily timeframes are used. They are easier for defining the shape and the structure of the model, as well as calculating the growth/decline potential in the direction of another goal.
In order to start, we should have a look at an older timeframe. If the whole daily pattern does not fit in the screen, we switch to an older timeframe, for example, the weekly one:
EUR/CAD
EUR/USD
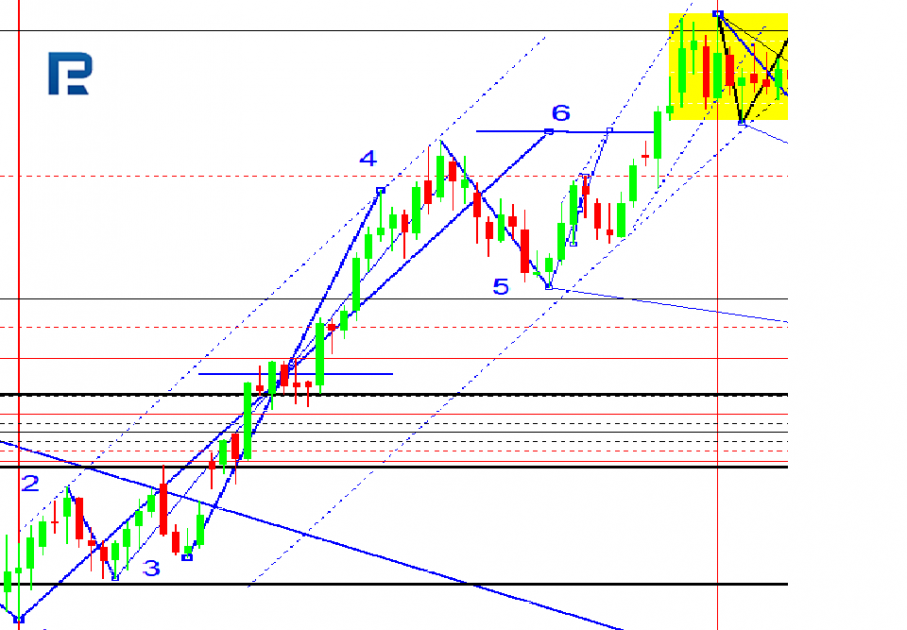
This MATRIX started in 2017 and finished in 2018. On February 16th, 2018 a new wave of growth of the US dollar began.
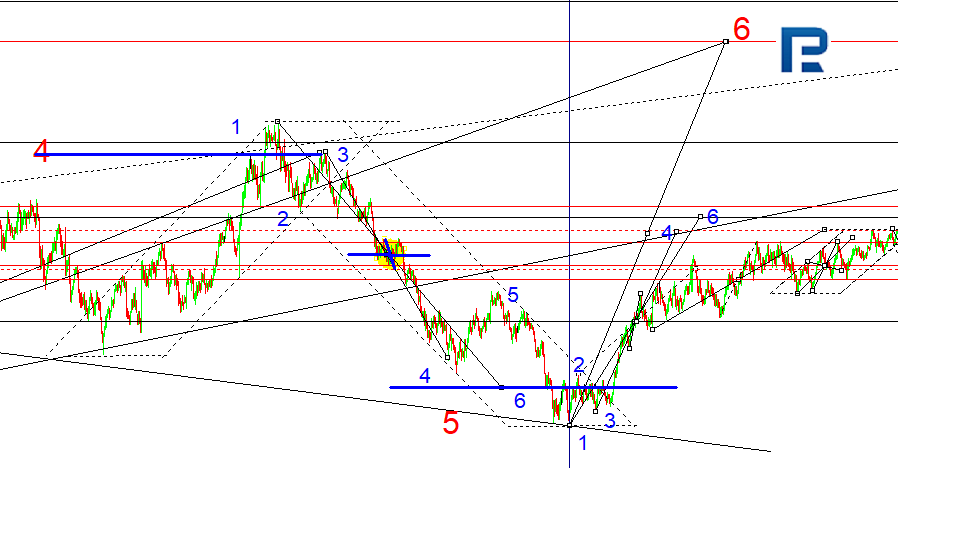
On the euro the beginning of the new trend looks as follows:
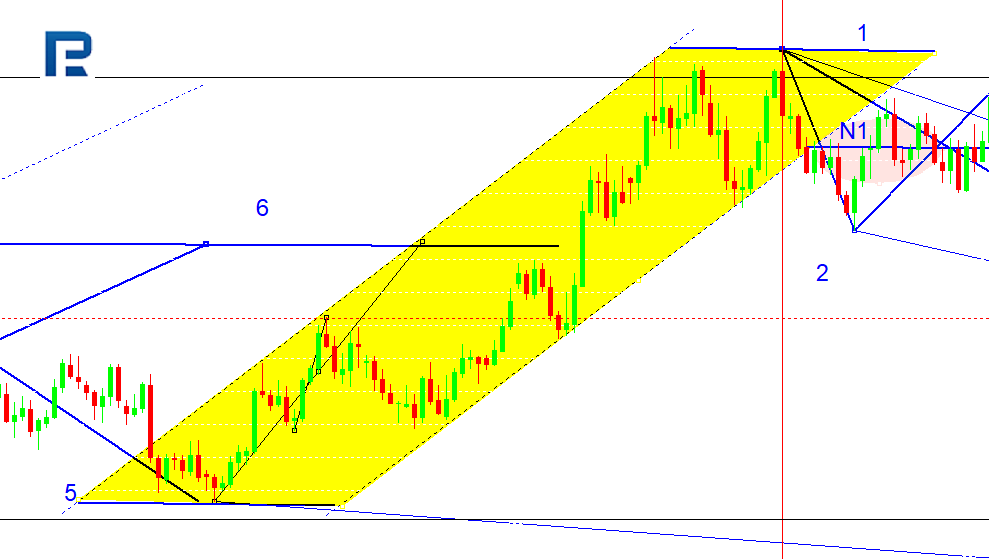
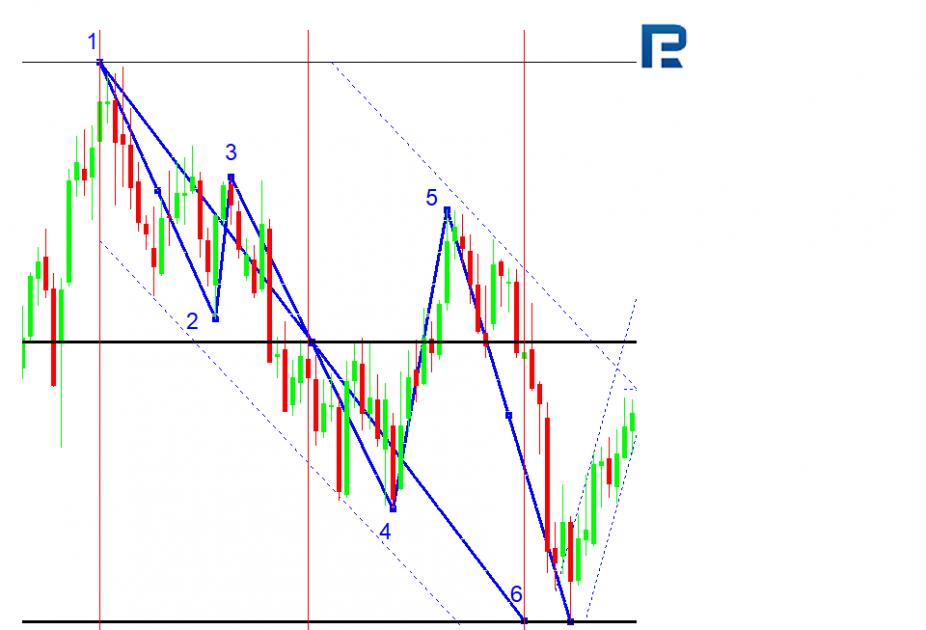
Those levels are considered pivots, on which the market demonstrates the start of a trend reversal towards the next pivot level. Practically, these are the levels, from which we start counting the growth/decline potential to the next pivot level. The probable beginning of the formation of such a level would be the emergence of three impulses against the previous trend. These three impulses must be elongated one against the other. In other words, all three impulses are a full-scale five-wave model of the MATRIX, in which 5-6 is bigger than 3-4, and 3-4 is bigger than 1-2. Such impulses are called CARRIERS because they carry the price to the interest area for buying or selling.
An example of the development of the carriers on EUR/USD:
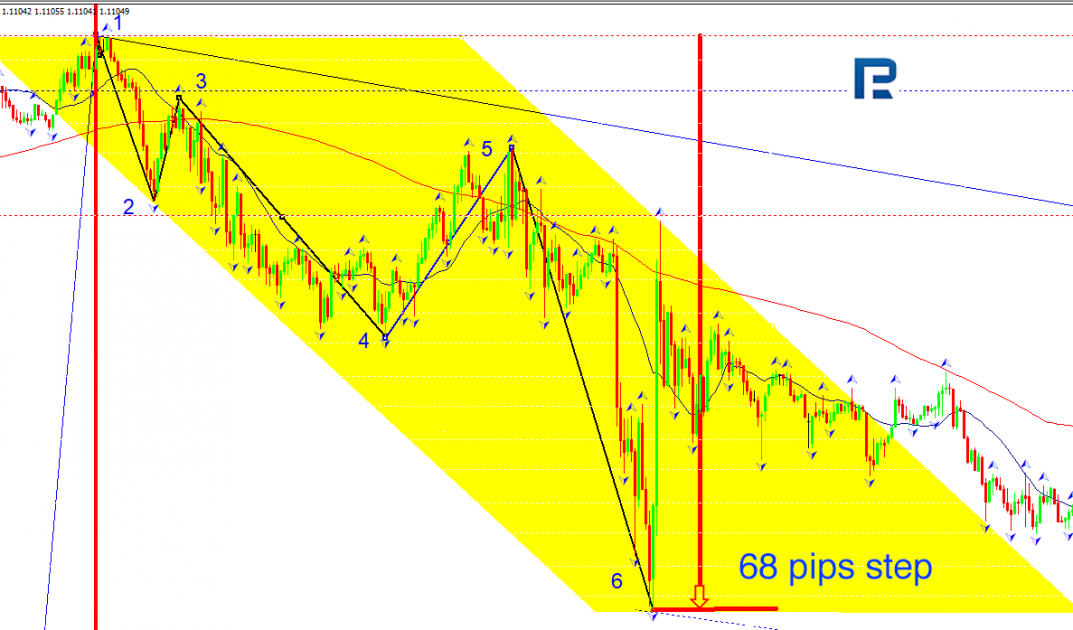
Such impulses can emerge only then when the market is invaded by really big money able to reverse the trend. However, such money does not appear at a split second, neither at a full scale at once. Filling up money on certain levels is called support and resistance in classic. We call these levels INVESTOR STEPS — those steps investors make towards another pivot, to the level of a trend reversal, to the level where another investor comes and reverses the trend. That is why there appear pronounced maximums and minimums on the market. We call them PIVOTS. These are practically those levels that the chart relies on moving in the channel. An example of a classical step:
Example of a classical STEP
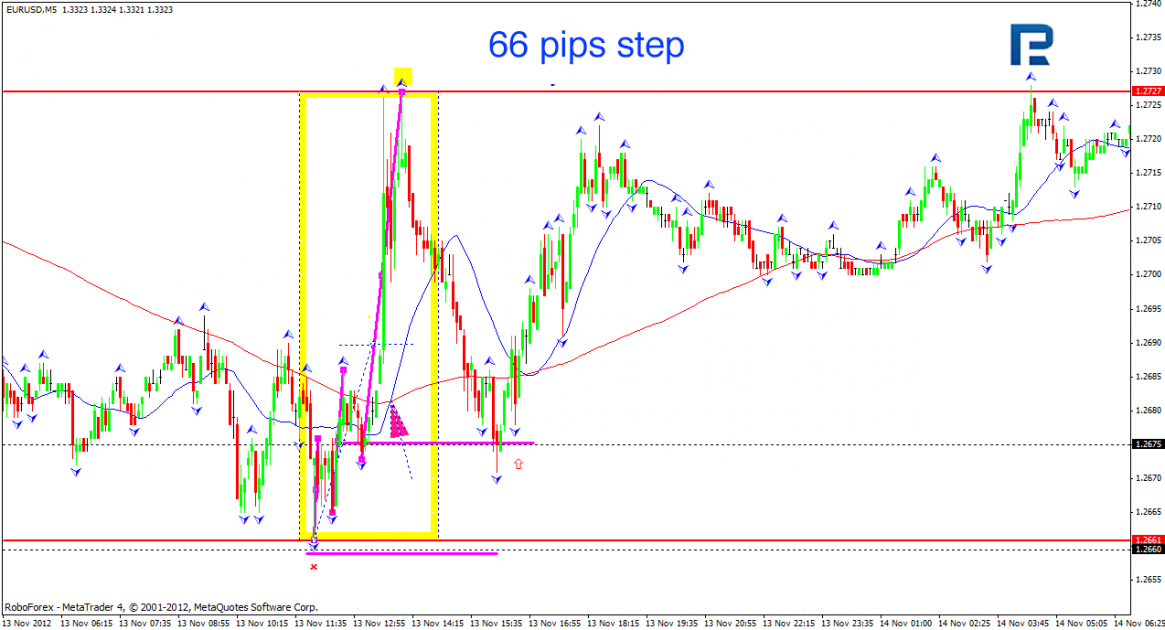
Example of a STEP on the EUR/USD
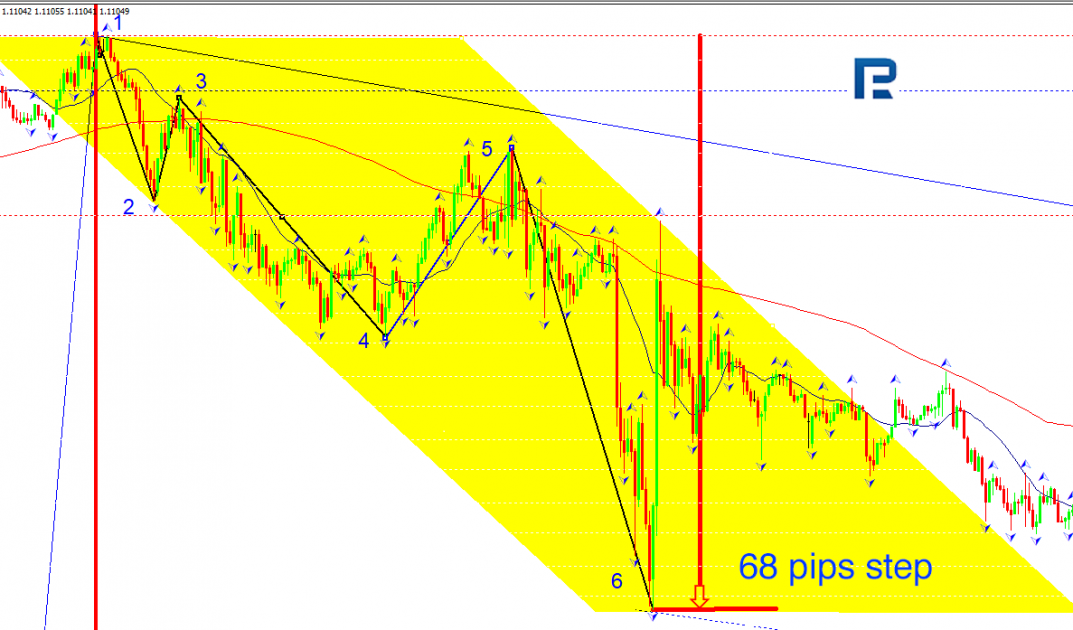
This step works until another investor appears, ready to reverse the uptrend by their money potential. A pivot 2 forms, forming its carriers and step. The second investor works until the third one appears, etc. Each support level has its own individual investor, with its individual step and individual character. That is why searching for a universal indicator, as well as creating advisors on its basis, turns out nothing but a big disappointment.
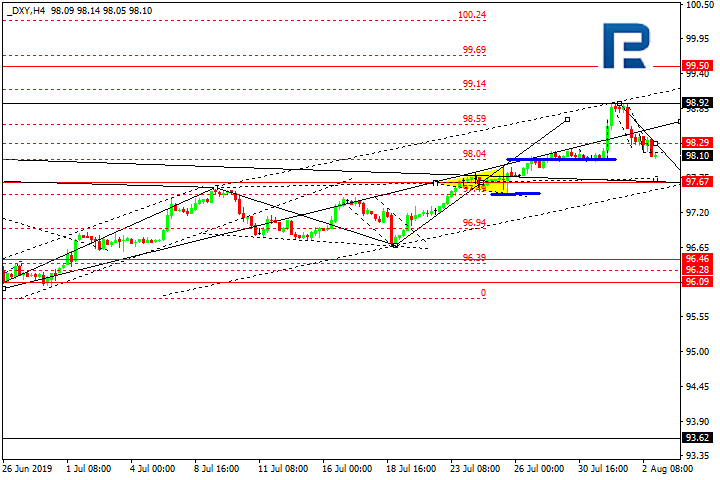
This is how the chart with an investor step looks on the example of the dollar and EUR/USD.
DXI
EUR/USD

The EXTRA system detects the arrival of such investors to the market and helps traders make wiser trading decisions, working on the side of those investors but not against them, for the latter entails losses.
EXTRA is a compass, a guiding thread that will always help you stay on the right side of the market.


