The Wolfe Waves: Description and Trading Strategy

8 minutes for reading
This structure of price movement is, in fact, a Wedge pattern. According to the author of the method, a trader should have their unique features and use rare trading instruments in order to be different from the rest of the market players. The Wolfe Waves pattern is able to provide a beginner trader with the keys to a new understanding of market behavior. However, as with any other trading strategy or technical instrument, no matter how successful its trading history may be, much depends on the hands the instrument gets in.
It is worth remembering that, apart from owning a good trading method, one should learn to wait for a model to form, to prepare for trading and to look for a forming model in advance in order to be ready to enter the market fully prepared. If there is no such a structure on the market presently, it will be wiser to just wait and remain without positions as the necessary pattern will appear sooner or later, if not today or tomorrow, then in a week.
What the Wolfe Waves are
Any graphic analysis of the market is subjective, that is why it is so important to gain experience in using and finding the Wolfe Waves pattern in order to identify it clearly in the future. In my experience, this pattern quite often turns out to be an irregular Head and Shoulders pattern. Here, we do not wait for the Neck line to be broken away, but instead, we expect a bounce off this level and a contrary movement. It will be probably easier for a beginner to look for such a structure.
The structure of a Wolfe Wave
The Wolfe Waves are a price structure basing on the Wedge pattern. According to the author, it is important to know how to draw the trendline as well as have handy the chart where we are going to draw it. In fact, the most important thing is to recognize the model itself and draw several lines in order to define the entry point and calculate the potential profit that this model will yield. Also, this model helps define the goal and the estimated time of reaching it. However, these estimations of time are not reliable. It is vital to remember that the model is based on a Wedge.
Drawing the Wolfe Waves
The pattern may be symbolically divided into two variants: the one for buying, where the growth of price is expected, and the one for selling, where a bounce and a decline of quotations are expected. Let us discuss the Wolfe Waves for buying, also known as the Bullish Wolfe Wave. It is important to find point 2, which is, in our case, the Head of the irregular Head and Shoulders pattern and the peak. Point 3 is the basement of the first decline.
Point 1 is the beginning of growth; it should lie above point 3 but below point 2. Through points 1 and 3, the Neck line of the irregular Head and Shoulders pattern is drawn. At the moment of testing this line, we do not wait for a breakaway; conversely, we expect the growth to begin here. Point 4 is the end of the growth, it should be below the point 2 but above point 1. In point 5 we expect the start of growth and the realization of the Bullish Wolfe Wave.
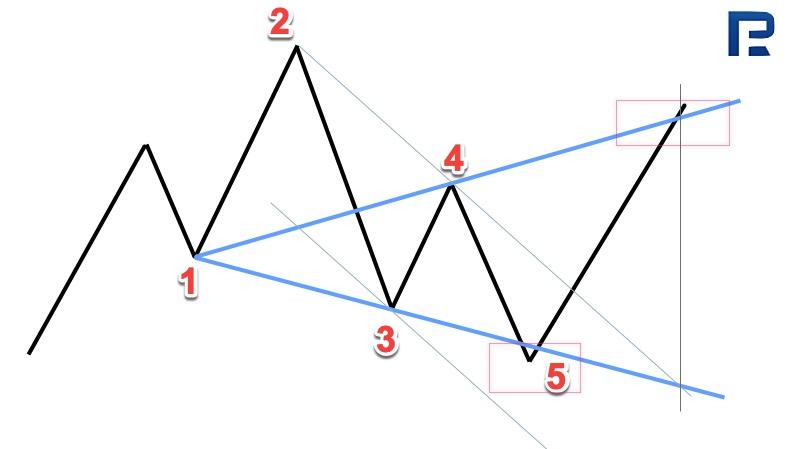
To set a goal, we should draw the trendline through points 1 and 4 — this will be the target line. Also, the author singles out the Sweet Zone; to define it, we should apply the line drawn through points 1 and 4 to the level of point 3, this way defining the area where the price may drop before the growth begins.
In case of the Bearish Wolfe Wave, the pattern is drawn mirror-like, as an irregular upside-down Head and Shoulders pattern. Point 1 will be the beginning of the decline. Point 2 will set the place where the decline will stop and turn into growth, i.e. it will be the very minimum. Point 3 should be higher than point 1, after which another decline will start.
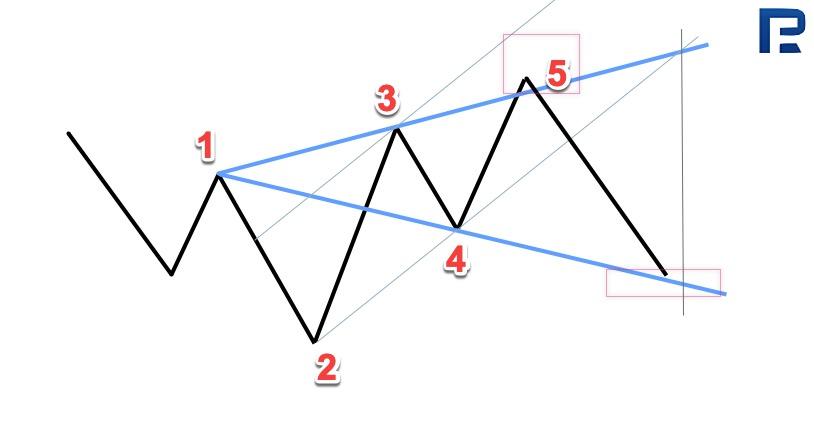
Point 4 is the place where the decline stops; it should be lower than the level of point 1 but not below point 2. Then follows growth and forming of point 5, where a decline is expected. In order to define the goal of the decline, the line drawn through points 1 and 4 is used.
Examples on the Wolfe Waves on Forex
Such patterns can be traded on various timeframes. As an example, we should consider the structure of the wave on the H4 of the AUD/USD. As we see, the pair attempted at a correction after a strong decline. We could suppose formation of the reversal Head and Shoulders pattern, that should be followed by further growth. However, the important point here is the inclination of the Neck line against the previous trend; so, this model is irregular, and no growth should be expected. In most cases, this pattern turns out to be the Bearish Wolfe Wave. At the moment of testing the level of $0.7070, there happened a bounce and strong decline. It is worth noting that the quotations did not advance much into the Sweet Zone.
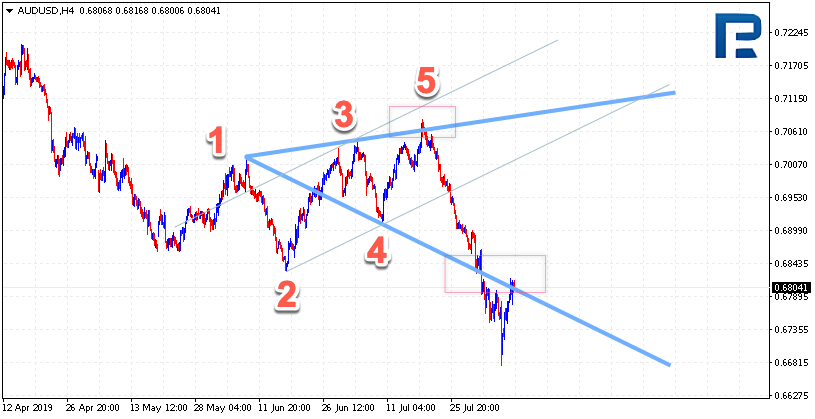
The falling is confirmed by the breakaway of the trendline and closing of the quotations under $0.6950. The scenario might no longer be valid in case of strong growth and a breakaway of $0.7130, which would signify a breakaway of the Sweet Zone. Such a strong decline was provoked by the market being descending, so the pattern was in accordance with further declining.
Let us have a look at a Bullish Wolfe Wave on the example of the USD/CHF pair. Here, the quotations are moving in a flat. As we may see, there is the upper border of the range and the lower one but no clear trend. There may appear several patterns in a flat, following one another. This is exactly what we see here. A Head and Shoulders pattern was forming, but the Neck line is inclined downwards, which is not characteristic of a reversal pattern.
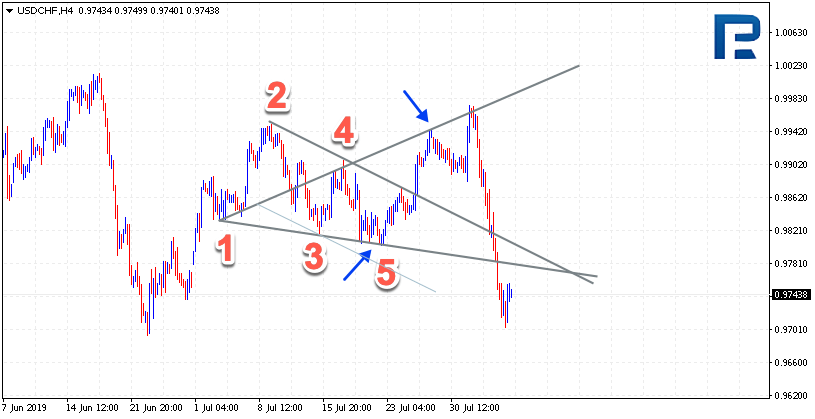
That is why we do not expect this line to be broken through, instead, we are waiting for a bounce and growth from the target line drawn through points 2 and 4. The aim of the growth and the realization of the model is the level of $0.9940, where the price did come sometime later. The scenario may no longer be valid if the quotations fall below $0.9750, which would mean a breakaway of the Sweet Zone; it is no use holding the positions after such a breakaway.
An interesting option of trading the pattern is not just buying from point 5 but forecasting where this area will be as early as the moment when point 4 is forming. The author recommends against selling from point 4, but on the whole, such an approach has the right to exist because the pattern is still based on Head and Shoulders, and in the latter pattern, an optimum entry moment is the formation of the Right Shoulder. Have a look at the example of the chart of GBP/NZD where a bullish Wolfe Wave is forming:
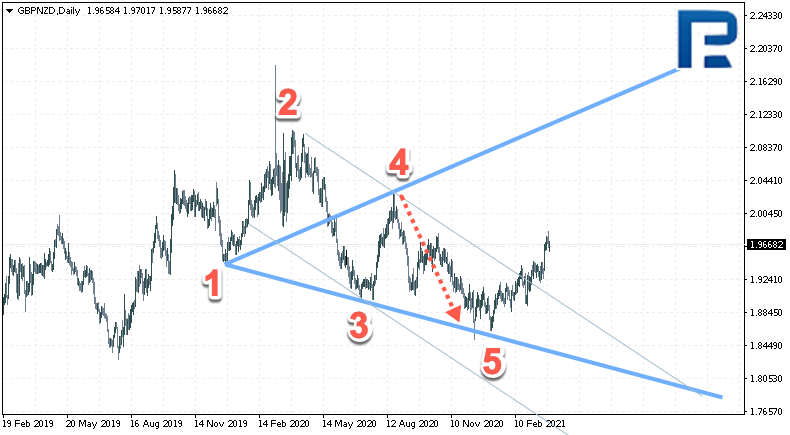
The quotations are pushing off point for, a decline of GBP/NZD to 1.85 is expected, from where we may expect growth to 2.15 and higher. Hence, we can interpret these fluctuations as a part of the pattern. The scenario can be canceled by a decline below 1.75. As you see, the Sweet Zone lies quite deep. A signal confirming the growth will be a breakaway of the descending trendline going through points 2 and 4, and securing above 1.94, which has already been broken.
Of course, some traders customize patterns, adding their own features to them. For example, we may add the MACD indicator as a confirmation at the moment of point 5 forming; on the MACD we should wait for a divergence then.
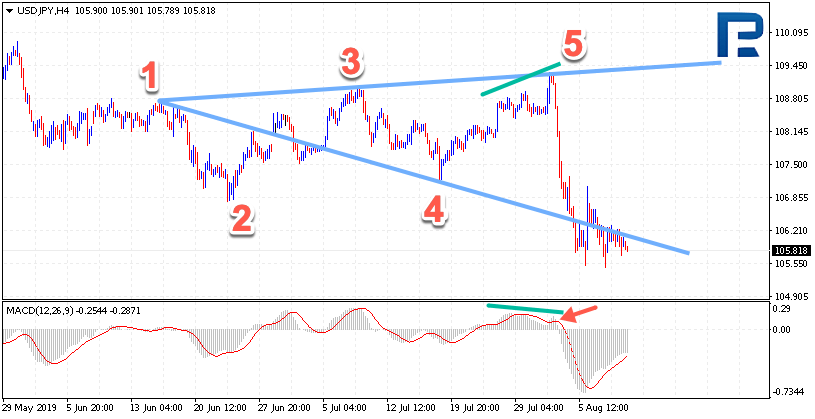
As soon as the signal line escapes the histogram area, if there is a signal to sell, we may consider opening short positions. What is more, the risk will be significantly lower than the Sweet Zone.
Next option will be drawing a trendline after testing point 5. Here, we expect a breakaway of this line and only upon it we make up our mind about entering a short position with the USDJPY pair.
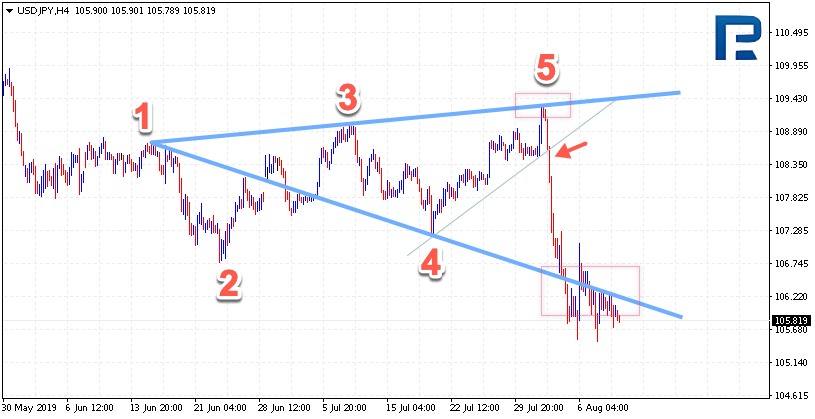
A Stop Loss, in this case, is placed after the point 5 maximum, which is, again, much less than the whole Sweet Zone. However, at the same time, we do not sell at the maximum and may miss part of the movement.
Summary
This variant of trading features serious advantages, such as simple rules of entering and exiting the market with a clear structure of the price movements; there is no need to apply additional methods of analysis; this approach will equally suit a beginner and a more experienced trader. However, there are certain disadvantages as well. Identification of and search for patterns on a chart is quite a subjective strategy, so success depends a lot on the experience and abilities of each trader.
An important part here is preparing for trading and the ability to wait for the completion of the pattern on the price charts. Trading in the direction of the current trend is not to be forgotten either, in most cases a Wolfe Wave will form against the current trend, and the possibility of the realization of such a pattern is lower; if the pattern goes along the trend, it appears much stronger. We shall discuss trading along and against the trend in the next posts.
