Andrew's Pitchfork - Efficient Graphic Instrument
6 minutes for reading
Andrew's Pitchfork is an instrument of graphic analysis based on the middle trendline and an equidistant channel. Unfortunately, this method of trading and analysis is not very popular among traders; however, it seems to be perfect for drawing a channel quickly and trading bounces off and breakouts of its borders.
Many traders try to draw such channels themselves based on price movements, and ofter change the rules of drawing depending on the situation. In the case of using Andrew's Pitchfork, the rules never change, regardless of any market movements, so the trader does not need to choose or customize such channels depending on the market conditions.
How to add Andrew’s Pitchfork to the chart?
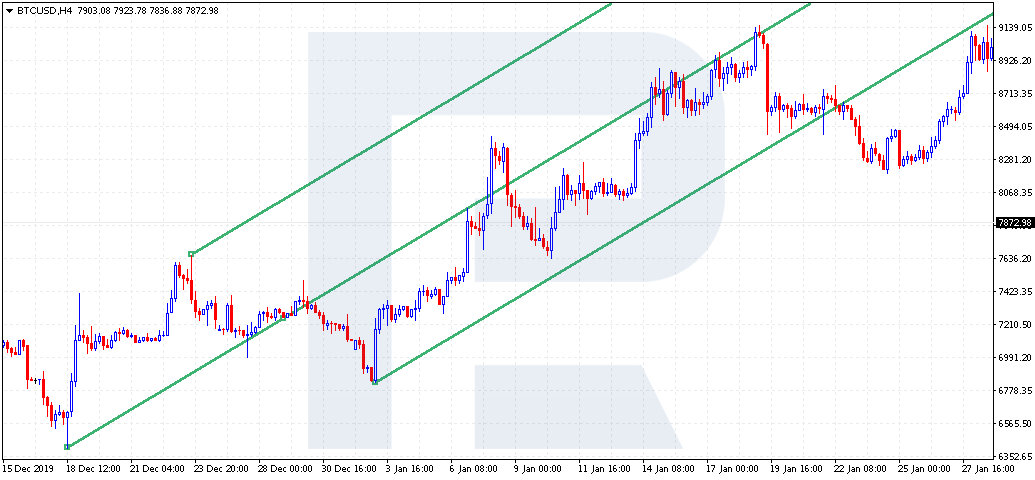
The instrument is available in the standard settings of MetaTrader 4. To use the indicator, just click Insert on the terminal and choose Andrew's Pitchfork. Then, choose three points to draw the channel, and it will become available on the price chart.

As a rule, the first point is the beginning of the trend, the second point is the high from which a correction has started (if we are speaking about an uptrend) and the third point is the low where the falling has stopped.
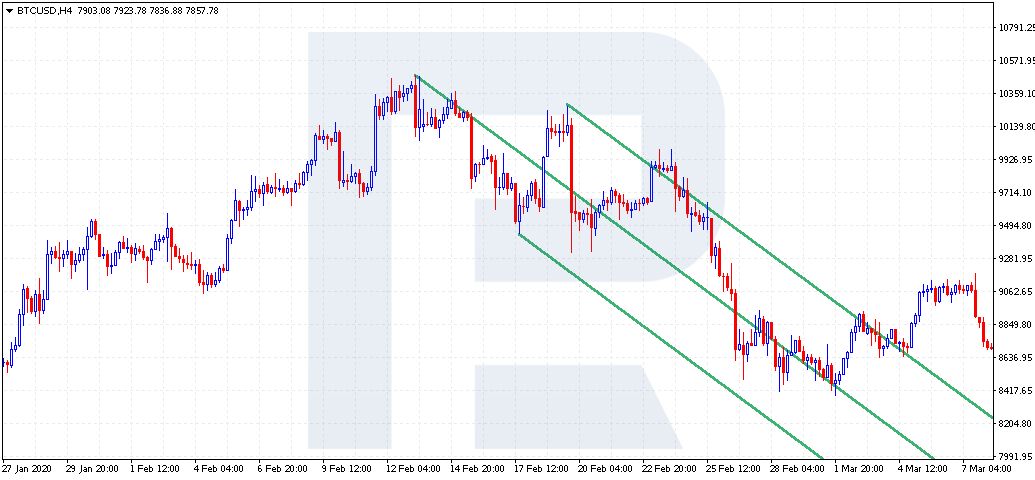
If there is a downtrend on the chart, then the second point will be the low from which the growth has begun, and the third point will be the high where the prices reversed and falling has started.
Andrew’s Pitchfork principles
The idea that the indicator is based on is the fluctuations of the price near the middle, or median, line. However, trading a line that is constantly crossed by the prices is not very comfortable, Alan Andrews added an equidistant channel for its signals to be used for work. Any of these lines act as support or resistance. If we draw the channel by ourselves, in most cases, it will differ from that of Andrew's Pitchfork.
The main difference here is the fact that we draw the channel through the extremes while Andrew's Pitchfork first draws the middle line and only then - an equidistant channel.
The author also added a couple of interesting observations. If the prices are above the middle line and do not even touch it during a correction, we may speak about a strong uptrend on the market. And if the prices are falling and do not reach the middle line during a bullish correction, this means a strong downtrend on the market.
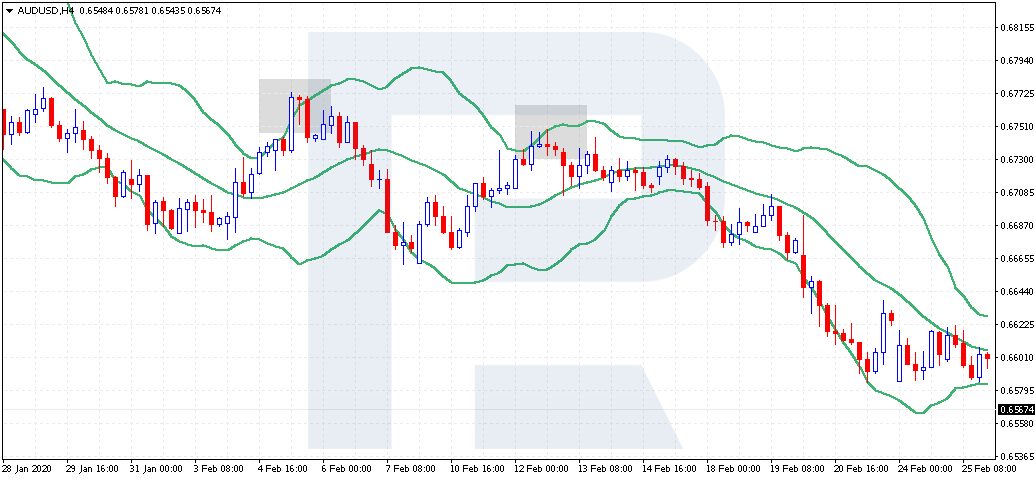
It should be noted that these observations apply to the Bollinger Bands indicator. When the prices push off the lower border, we may see a good uptrend, while when the prices bounce off the upper border and fail to rise higher, this means a strong downtrend.
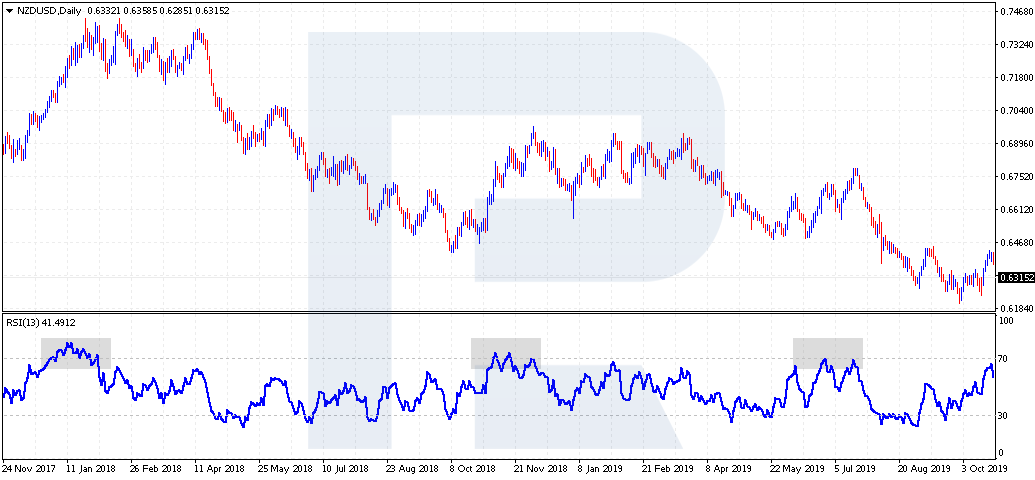
Analyzing the market with the RSI, we may see something similar: when the prices keep pushing off level 30, there is a strong uptrend on the market. Conversely, if the prices fail to break out level 70 and keep breaking the area of 30, this means we are witnessing a strong downtrend. However, these observations can be made only at the moments of active trading with these methods and keeping a close eye on the market.
How to use Andrew’s Pitchfork in trading?
As we have noticed above, with this method, we can trade bounces off and breakouts of the channel borders. Unfortunately, not always will the market execute the signals perfectly; it should be remembered that any trading option can be customized and supplemented by your preferred trading methods. Also, we must not forget that Andrew's Pitchfork is just an instrument of graphic analysis, so the picture will be estimated somewhat subjectively.
The author himself spoke about the high probability of reaching the middle line. If the prices fail to do it, a decline to the nearest important support or resistance level is to be expected. Thus, the prices will come back in point 3.
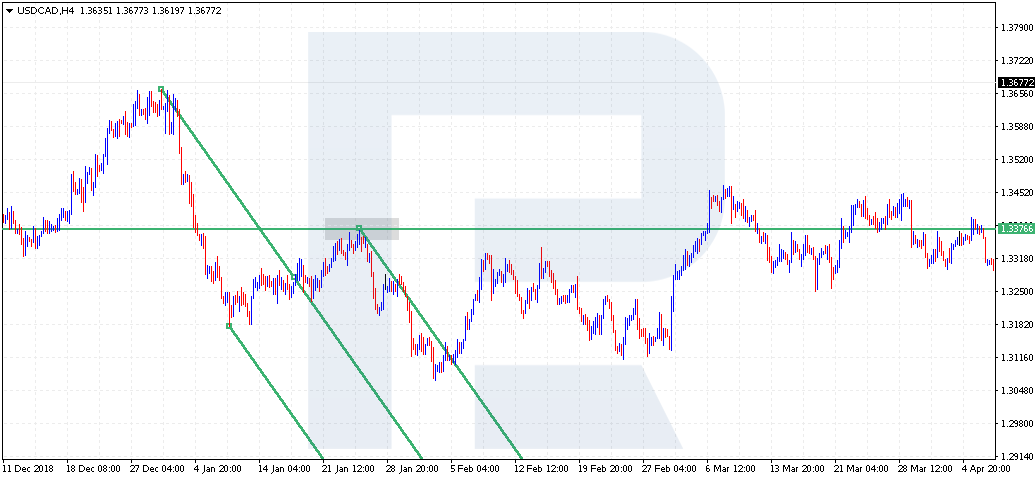
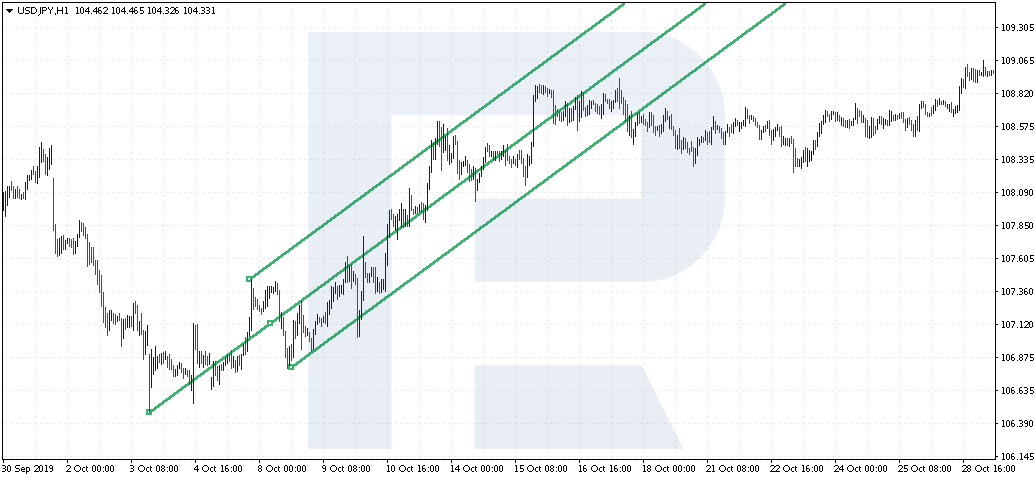
The simplest way of work is to add Andrew's Pitchfork to an H4 chart at the very beginning of the trend when there have already formed three easily detectable points. In this case, you can simply trade bounces off the border of the channel. And if such a channel is broken out, we may speak about a trend change or speeding up of the current trend, which also giver a good entry signal.
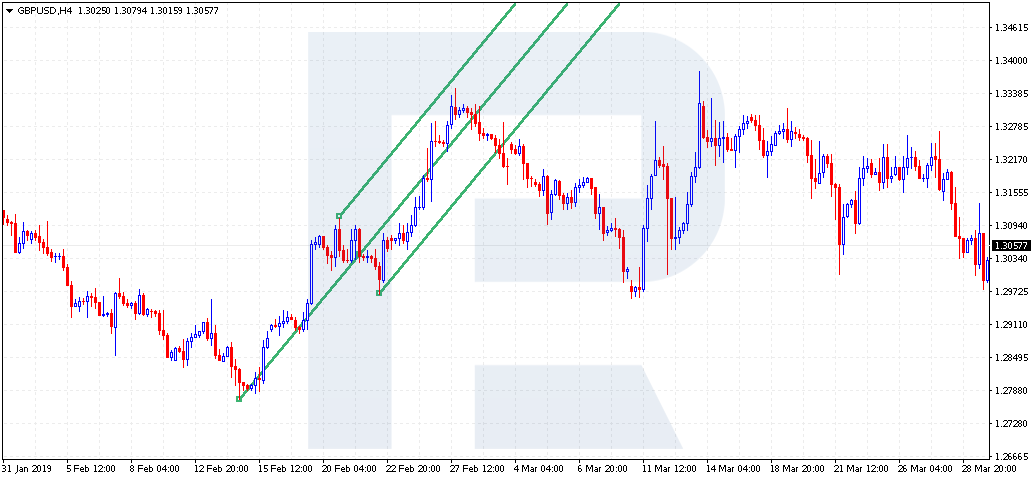
As in the classical tech analysis, here the author also takes the width of the channel from the middle line to the border and mark it off in the direction of the breakout, thus creating a landmark for the price movement. On the whole, this approach is similar to that by Eric Nyman, where he defines the strength of the entry signal by the price escaping the channel. For example, if an ascending channel is broken upwards, this is estimated as a strong signal of trend continuation, so buying is recommended.
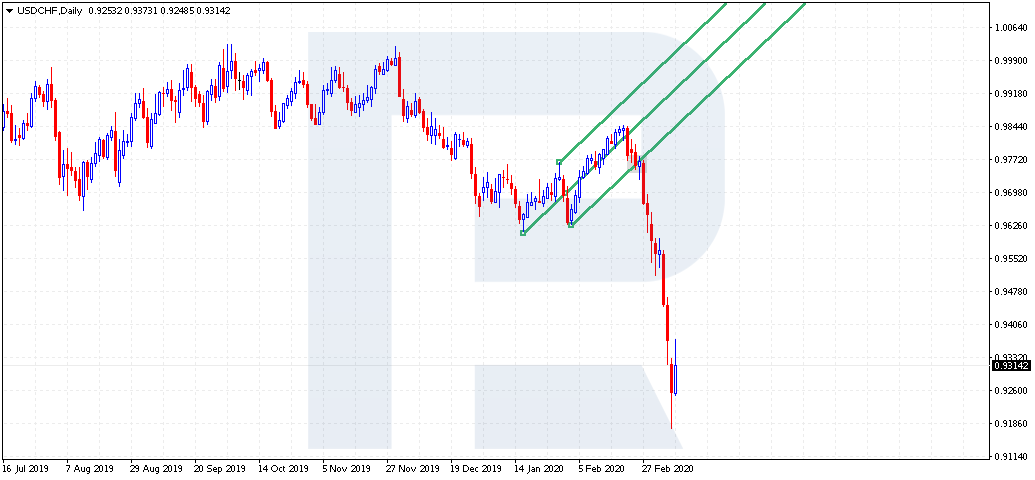
However, the best option will be trading breakouts in the direction of the general trend. Imagine we are watching a downtrend on the D1 of USD/CHF. When we switch to H4, a bullish correction forms; here we may add ascending Andrew's Pitchfork and consider selling at the breakout of the lower channel border.
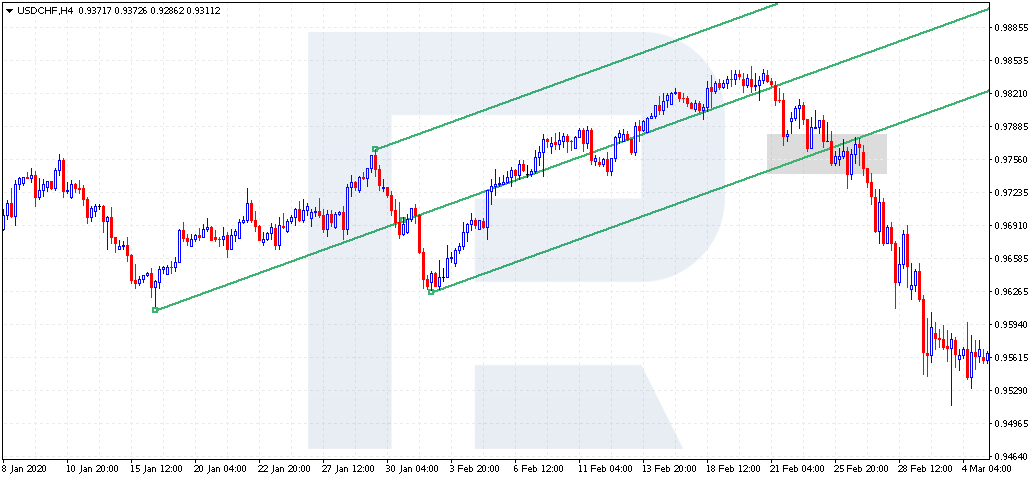
As we may see, in our example, the prices went quite down after the breakout. If you try buying in this situation, the trade will be losing.
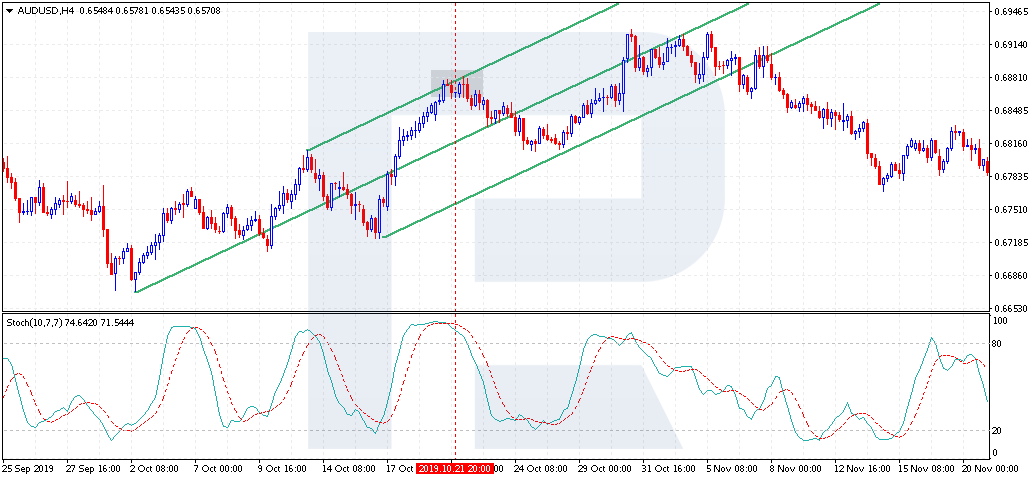
Also, the author adds to the Pitchfork the Stochastic Oscillator and tries using it as a supplementary signal at the moment of testing the middle line. This approach is rather simple: if the prices are testing the middle line while the indicator values are below 20, we should expect the beginning of growth. And if the prices are a bit higher than the middle line while the indicator values are above 80, we may speak about the beginning of a decline.
Summary
The follower of this method and the author of the book "The Best Trendline Methods of Alan Andrews and Five New Trendline Techniques" Patrick Mikula highlights that recently, there have not been presented any interesting trading methods using trend lines, which makes Andre's Pitchfork a fresh and appealing method. Moreover, the latter is the best option of using trend lines in trading.
However, it should be remembered that this approach might seem too complicated for a beginner who has not mastered support and resistance levels yet. For a trader who uses graphic analysis actively, the strategy may be interesting and add new instruments to their strategy.
As Bill Wolfe, the author of the Wolfe Waves method used to say, the trader must differ from their peers by a unique work strategy - thus they will succeed in the long run. So, a deep look into Andrew's Pitchfork, not so frequently used, will push the trader to a new level of expertise.


