What is Happening to Global Stock Indices?

4 minutes for reading
The global economy has just started recovering after the crisis caused by the coronavirus pandemic. However, now market players are concerned about the new delta strain of the COVID-19, which is more contagious and can slow down the recovery procedure and rewind the time to an early-pandemic phase. How do global indices respond to these events? We’ll discuss it right now.
The third wave strikes the economy
On July 19th, bears took over the market ahead of the news about the oncoming third covid wave, which may not be stopped even by a massive vaccination campaign. Analysts believe that the increase in the number of new cases destroys a positive influence of the influx of financing into developing economies and a strong earnings season.
According to experts, we are now witnessing another significant slowdown in the earnings-growth rate and the global economy. Confirmation of this point of view comes from major stock indices decline, which could be seen on Monday. It is fair to say that many of them managed to recover the next day, on Tuesday.
USA indices
The week got off to a rocky start from the very beginning: Dow Jones Industrial Average (DJIA) lost 2.09% (724.56 points), S&P 500 (SPX) — 1.58% (68.53 points), NASDAQ Composite (IXIC) — 1.06% (152.2 points). The next day, these indices got a boost and added 1.62%, 1.52%, and 1.57% respectively.
European indices
On Monday, STOXX 600 (STOXX), an index of European stocks, dropped 2.3% (10.45 points), German DAX (GDAXI) — 2.62% (407.11 points), British FTSE 100 (FTSE) — 2.34% (163.7 points), French CAC 40 (FCHI) — 2.54% (164.11 points).
On Tuesday, the tendency reversed and indices added 0.52%, 0.55%, 0.54%, and 0.81% respectively. As of this writing, they continued moving upwards: STOXX 600 added 1.14%, DAX — 0.5%, FTSE 100 — 1.39%, and CAC 40 — 1.04%.
Asian and Pacific indices
On July 19th, Japanese Nikkei 225 (N225) reduced by 1.25% (350.34 points), South Korean KOSPI (KS11) — на 1% (32.87 points), Chinese Shanghai Composite (SSEC) and SZSE Composite (SZSC) — 0.01% (0.18 points) and 0.07% (1.74 points), Australian S&P/ASX 200 (AXJO) — 0.85% (62.1 points).
The next day, only SZSC managed to recover as it added 0.18%. The others continued falling: N225 lost 0.96%, KS11 — 0.35%, SSEC — 0.07%, AXJO — 0.46%. As I write this today, the negative tendency remains only in South Korean KS11 — it lost 0.52%. As for other indices from this region, they are growing, +0.9% on average.
Tech analysis of stock indices by Maksim Artyomov
Dow Jones Industrial Average
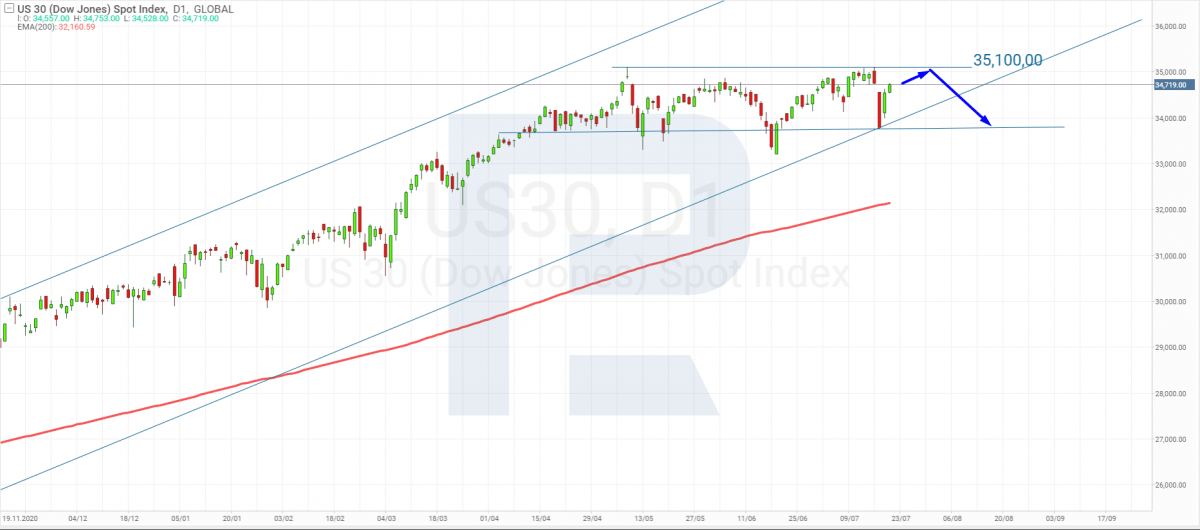
“In the daily chart, the Dow Jones index is forming another rising wave and moving towards the local high. At the moment, the upside target is the resistance level at 35,100. After reaching it, the asset may start a new correction. Considering that the price is still trading above the 200-day Moving Average, one may assume that after completing the pullback, the instrument may break the resistance level, update its highs, and then continue moving within the uptrend”.
S&P 500
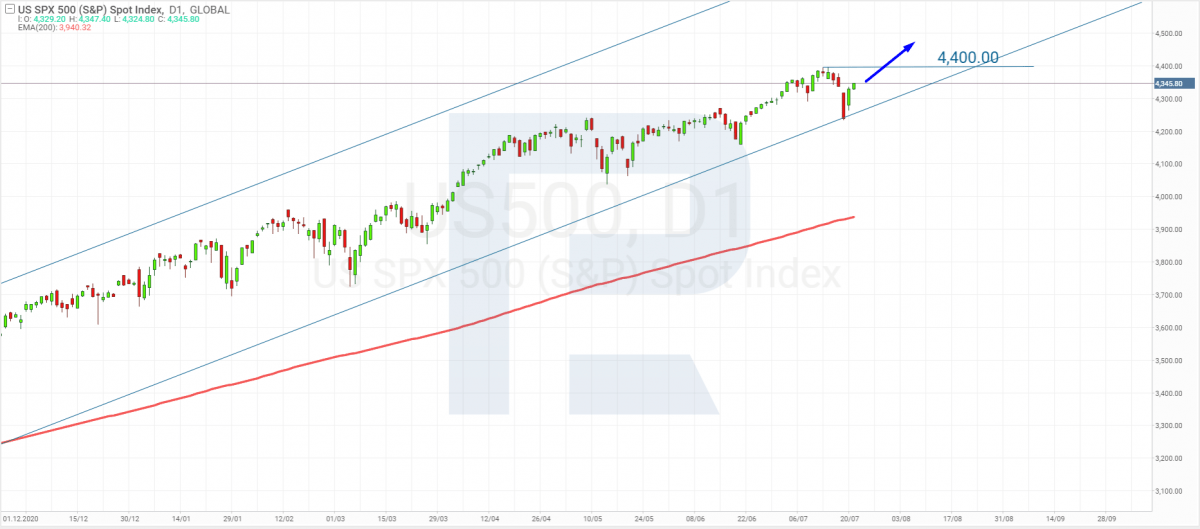
“The S&P 500 index is forming one more rising wave towards the highs. In this case, the upside target is 4,400, a breakout of which may lead to a further uptrend. A signal to confirm this idea is the 200-day Moving Average, which is moving below the chart. In the future, the asset may continue rising within the ascending channel”.
NASDAQ Composite
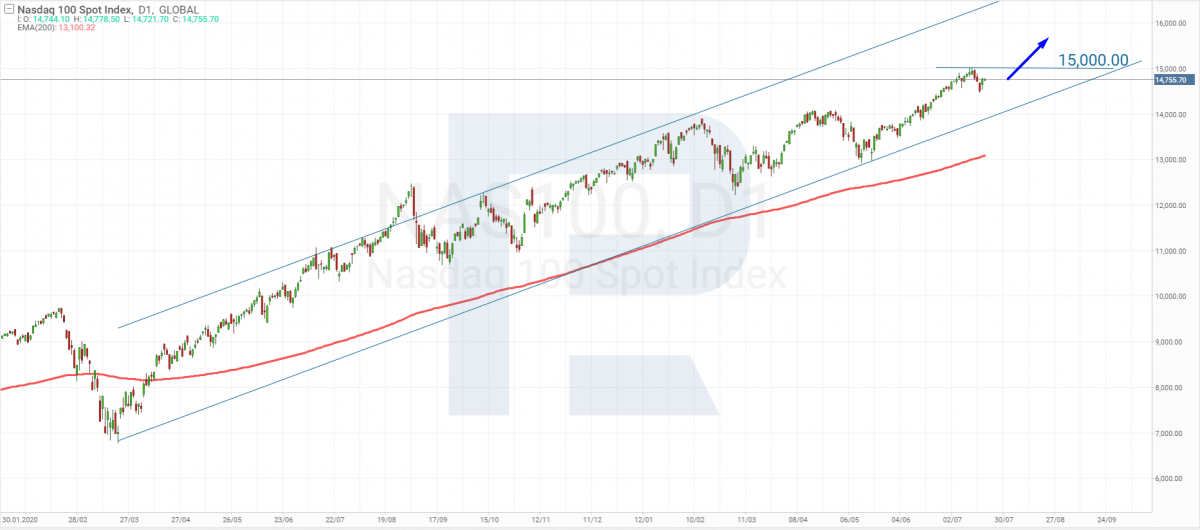
“The NASDAQ Composite index is generally behaving the same way as other indices traded on the US stock market. The price continues forming the rising wave within the uptrend. The upside target is the closest resistance level at 15,000. An update of the highs may lead to a further uptrend. A signal to confirm this idea is the 200-day Moving Average, which is still moving upwards below the chart”.
Stoxx 600
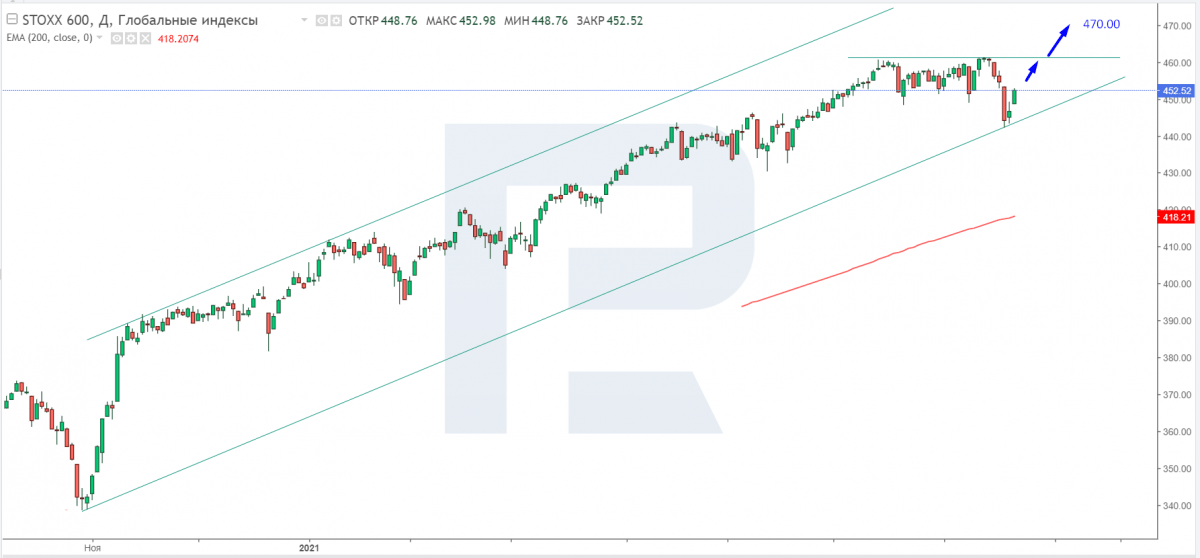
“After rebounding from the channel’s downside border, the Stoxx 600 index continues forming the rising impulse. Remembering that the asset has already tested the resistance level twice, one may assume that the next test may result in a breakout. Later, the index may continue trading upwards. A signal to confirm this idea is the 200-day Moving Average, which is also moving upwards. The upside target is at 470”.
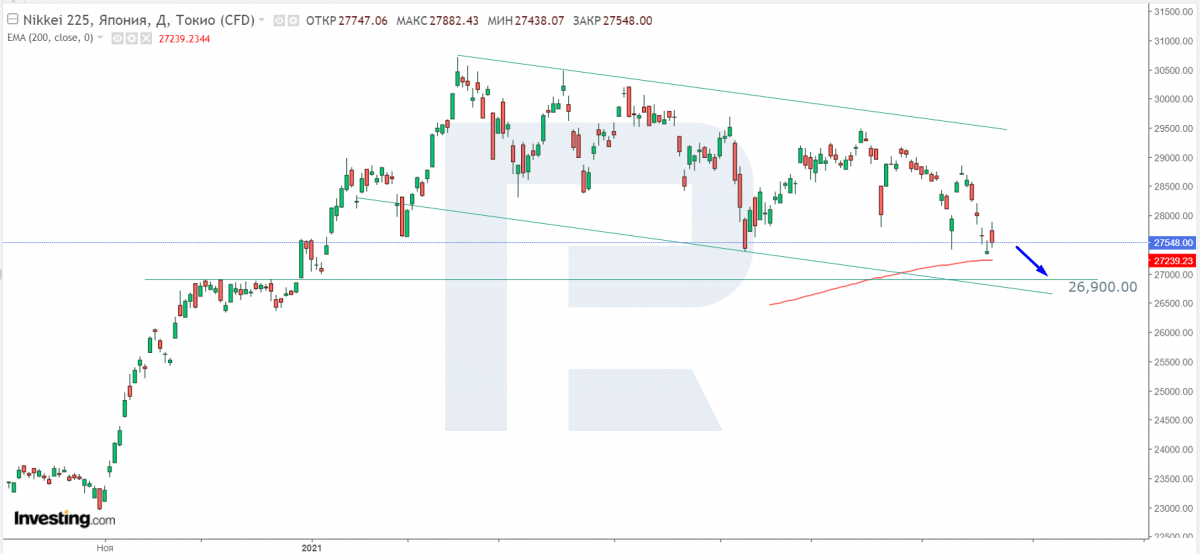
Nikkei 225
“Unlike American and European indices, Nikkei 225 is moving downwards; right now, it is testing the support level, the 200-day Moving Average, a breakout of which may lead to another descending impulse. The downside target is the descending channel’s downside border and the support level at 26,900".
Summing up
Early in the week, concerns about the third wave of the coronavirus pandemic resulted in the decline of global stock markets. However, the next day many of them managed to recover. Analysts are reporting a slowdown in the global economic recovery.


