What is Depth of Market and How Does It Work?

6 minutes for reading
This overview is devoted to the phenomenon of DOM (Depth of Market): how it works and how traders and investors can use it.
What is DOM?
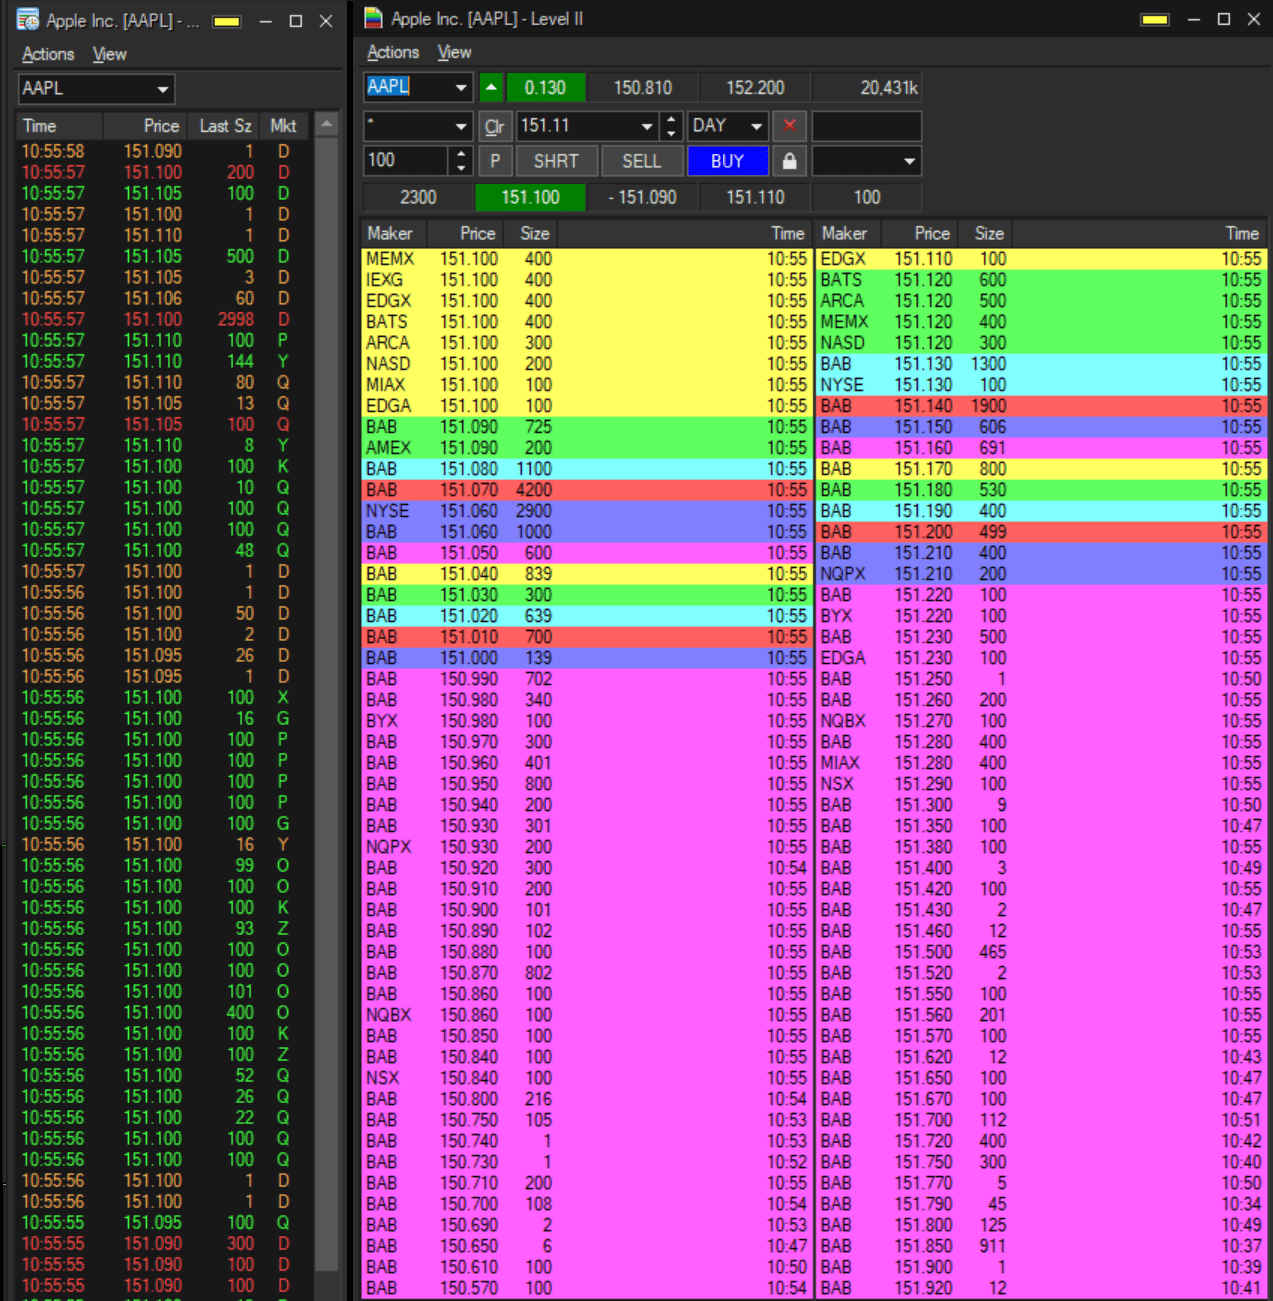
DOM (Depth of Market, a.k.a. Level 2, Order Book) is a list of current orders to sell and buy a certain trading instrument, presented as a handy table. It demonstrates prices that market players offer at the moment. DOM shows the actual balance of sellers and buyers and thus serves a handy instrument for traders and investors.
Stock market, in essence, is an auction in which sellers and buyers participate. For example, you want to buy 10 stocks at a price you set yourself. Your order gets into DOM, and if your price is close to the current market price, a seller will appear quite soon. However, if there are people in the market who want to buy the stocks at a higher price, you will need to wait until their orders are executed.
What does DOM look like?
Classic DOM is divided into two columns: in the left one prices and volumes of buyers (the number of lots) are presented; in the right one there are prices and volumes of sellers. The difference between the nearest orders to buy and sell is the current spread.
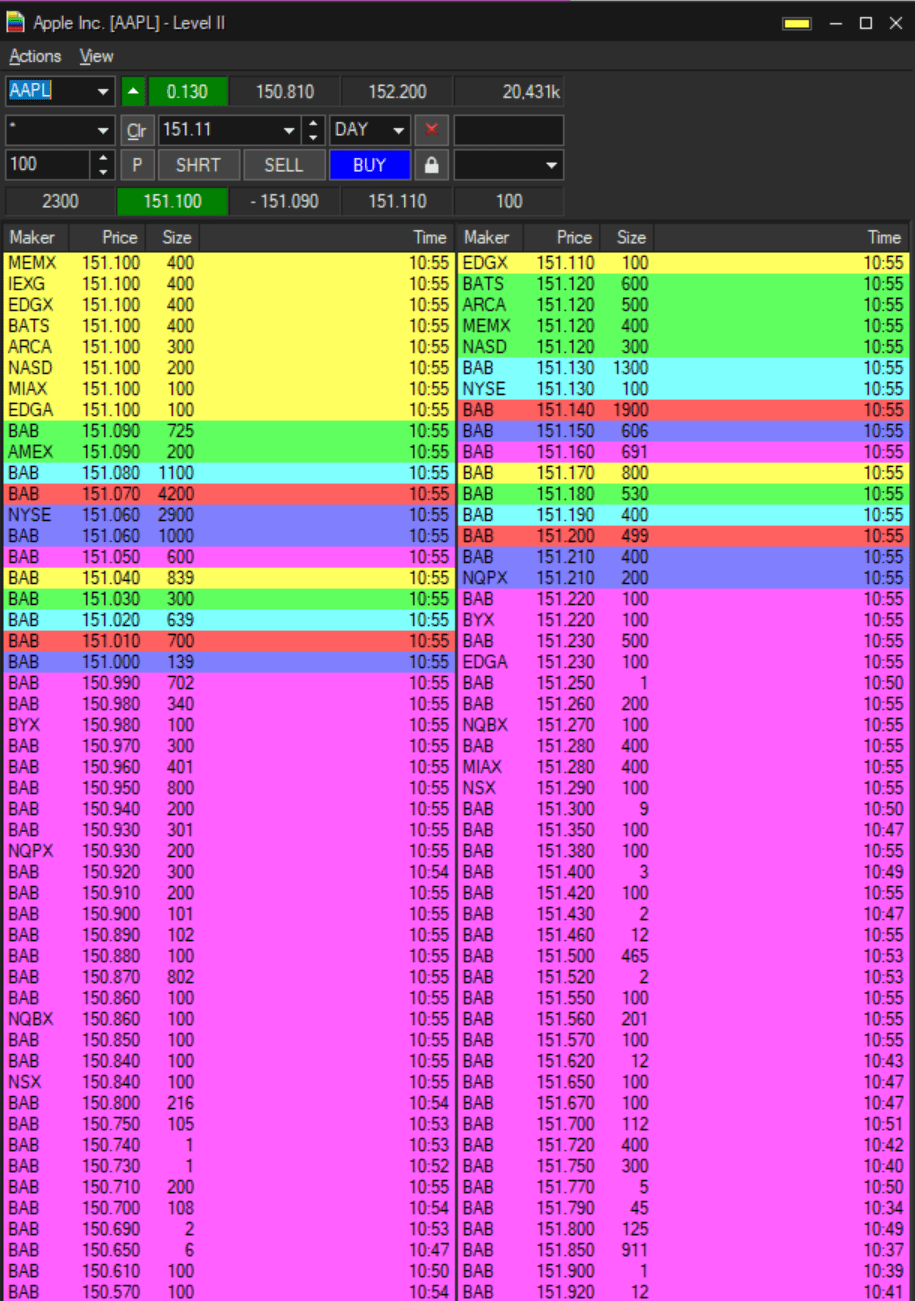
The look of DOM depends on the trading terminal you use but general parameters are the same. Normally, orders to sell are at the top and orders to buy are at the bottom. DOM cannot accommodate for all orders placed by buyers and sellers real-time online. Hence, it shows online those orders that are the closest to the current market price.
They are what form the so-called DOM. For example, if DOM is 20*20, the table consists of 20 nearest buy prices and 20 nearest sell prices. This is quite a wide-spread look of DOM that brokers use. However, you can customize it in the trading terminal settings.


Types of stock market orders
Main stock market orders are:
- Market order is an order to immediately buy or sell your asset at the current market price that you do not specify separately. The priority of such orders is their immediate execution: if there is necessary liquidity volume in the market, your position will be opened (or closed) at once.
- Limit order is an order to buy/sell your asset at a specific price. A limit order excludes the probability of execution at a better price and it will be executed if and only there is the limit (or available) price in the market.
DOM only represents limit orders. Market orders are not there because they are executed immediately.
Placing limit orders in DOM is easy. Choose your price (to buy or sell), your volume, and activate the order. You can use one-click trading, when you specify the volume in advance, and then order is executed by a click of your mouse. You can then check your executed trades in the feed (log, Level 1).
There are two ways how orders influence the quotations of the asset:
- Minor orders do not influence the price one by one. They can, however, cause a limited influence on the quotations if they group in a narrow range.
- Major orders are orders of larger volume that can have a greater influence on the quotations and attract attention of investors and traders.
I would specially mention iceberg orders, which are orders to buy/sell that have a visible and hidden part of the price. For example, there are 100 lots to sell at a certain price, and this is the visible part of the order. At the moment those 100 lots are sold, a new order at the same price appears.
The process repeats until the seller gets all the hidden volume bought from them – 5,000 lots, for example. Such orders can be placed at certain conditions, not always and everywhere. You can track the execution of iceberg orders on Level 1.
How traders and investors can use DOM
Many experienced traders and investors use DOM as an additional instrument of analysis. For example, you find important support and resistance levels on the chart, then you can try to assess the probability of a breakaway or a bounce in DOM.
To do it, check the number of orders and their volume near the price of the level you have found. If there are a lot of trades accumulated at the important level, the price is likely to bounce off it. On the contrary, if there are few orders and the volume is small, the level is quite likely to be broken away.
Also, you can check the “activeness” of orders:
- Aggressive orders are those that move the quotations actively. They appear suddenly and push the price in a certain direction. Their appearance can be used for assessing the current price impulse.
- Passive orders protect a certain price level. Those are large orders that stick to a certain price and never move. Traders often use them for controlling risks, hiding protective Stop Loss orders behind them.
Bottom line
DOM, or Level 2, alongside your trade feed, or Level 1, is a useful instrument for traders and investors. The skill to analyze the information from DOM can help you assess the state of the stock market more closely. You can also confirm strong support and resistance levels by it, as well as check the direction of the current price impulse by DOM.


