How to Use Correlation Calculator for Currency Pairs

5 minutes for reading
This overview is devoted to the issue of correlation of currency pairs, counting it with a special calculator, and using it in trading.
What is currency pair correlation
In finance, correlation is a statistical measurement of how two assets move one against another. In other words, this is the capability of one financial instrument follow another one. For example, gold and silver have high correlation.
The idea of currency correlation represents the connections between currency pairs in Forex, the dependence of their movements one from another. Correlation demonstrates whether two pairs fluctuate similarly: the higher the correlation, the more in run are the two pairs. Currency pairs with strong correlation move somewhat in unison.
Positive correlation
Positive (or direct) correlation means that quotes go in the same direction – up or down.
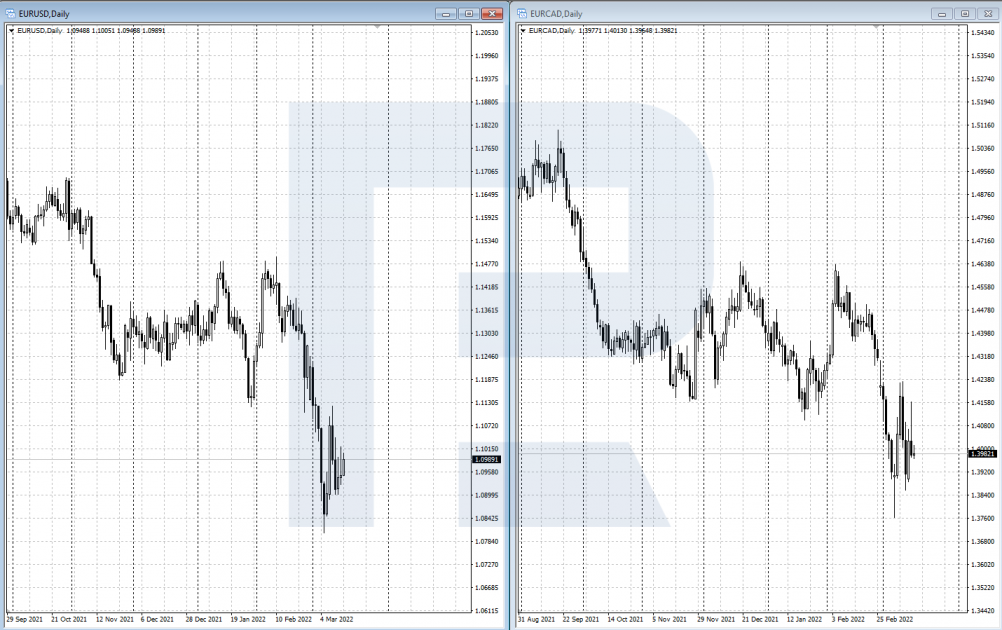
For example, strong positive correlation is demonstrated by EUR/USD and EUR/CAD. In the picture below it is obvious that the quotes of these pairs often go in one direction, and their charts look quite similar.
Negative correlation
Negative (inverse) correlation means that two financial instruments change similarly but in the opposite directions. In other words, the chart of one currency pair mirrors the chart of the other one.
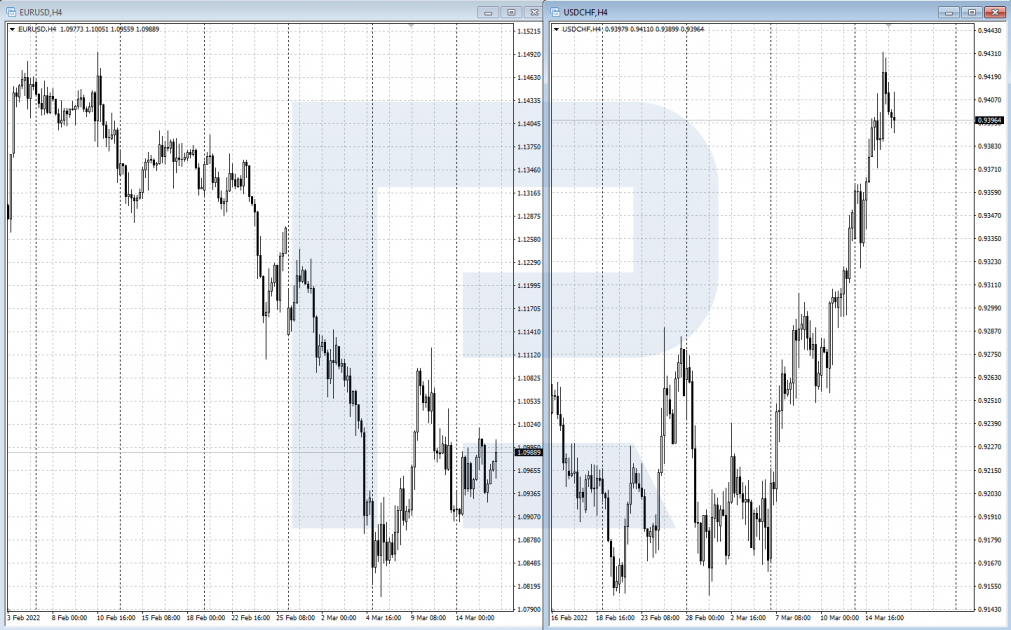
For example, strong inverse correlation is demonstrated by EUR/USD and USD/CHF. In the picture below, there is a chart mirroring the other one: while one pair grows, the other one drops, and vice versa.
How to calculate correlation indices
To assess the correlation of two instruments, there is a special index. It is estimated in shares, or percent: 100% = 1 for positive correlation and -1 for negative.
For calculating the index, Pearson’s formula is used. First, a set of values of both assets is formed – X and Y. Then average X and Y values are calculated. Next, they add up the product of the deviation of each set from the average and divide them by the product of the standard deviation.
The values of the correlation index are between +1 and -1.
The meaning of the values is as follows:
- 0 – no correlation. Currency pairs show no dependence on one the other.
- +1 – full positive correlation. Two currency pairs go in one direction, coinciding in movement size.
- -1 – full negative correlation. Two currency pairs go in the opposite directions, coinciding in movement size.
How to use calculator for currency pair correlation
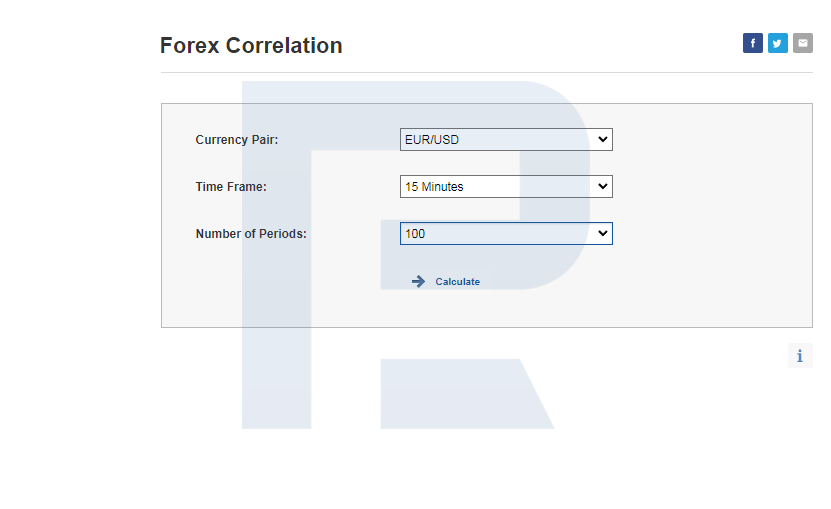
There is a special online correlation calculator for counting the correlation of currency pairs. For example, there is a calculator on the investing.com platform. To calculate correlation, choose a currency pair, the timeframe, and the number of TFs.
When calculations are done, there appears a table with correlation indices and the chart of the main pair. In our example, it is EUR/USD. From the table below, any two pairs for the comparison of charts can be chosen.
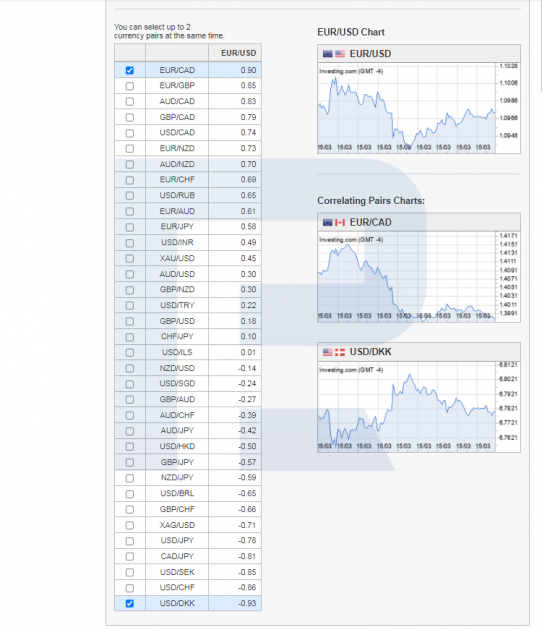
Depending on the indices the trader concludes whether the correlation is substantial to be used. Roughly, correlation can be assessed like this^
- 0-0.4 – weak
- 0.5-0.7 – moderate
- 0.7-0.8 – high
- 0.9-1.0 – strong
For positive correlation, there is a “+” before the values above, for negative correlation – a “-“ sign.
For trading, high and strong correlation is recommended.
Forex trading strategies with correlation
- Following the movement. By this strategy, out of the two correlating pairs one is used for tracking signals for possible further movements of the second pair. When one of the two pairs begins a strong directed movement and the second one is lagging, a position can be opened in the lagging pair, following the movement.
- Hedging decorrelation. Decorrelation is the divergence of correlating currency pairs. As a rule, it is temporary. Using the divergence, the trader simultaneously opens proportionate positions in both pairs, counting for the correlation to recover. In this case, the size of the decorrelation will be the trader’s profit as soon as the two currencies synchronize again.
- Diversification. Instead of opening one large position in just one currency pair, the investor opens two smaller proportionate positions in two or three correlating pairs. This diversifies the position by several instruments, decreasing risks of investing in just one asset.
Risks of using correlation in Forex
It should be noted that correlation between two currency pairs is not a stable and constant factor. It can change with time. Different political and social crises, unexpected changes in credit and monetary policies can alter the normal correlation at any moment, so that it stops working normally.
So, when using correlation in trading, the trader has to follow their risk management rules. Correlation can be used as some sort of a filter alongside classical fundamental and tech analysis. Before using correlation for real, practicing on a demo account is highly recommended.
Forex correlation widget
© Powered By Myfxbook.com


