AMD's Profit Surged by Over 1000%: Implications for the Stock

10 minutes for reading
Advanced Micro Devices Inc. (NASDAQ: AMD) saw its net profit for Q3 2023 soar by an impressive 1007% compared to Q2 2023, reaching 299 million USD. It is worth noting that its primary competitor, Intel Corp. (NASDAQ: INTC), reported a net profit of 2 million USD lower for the July to September period.
In today’s article, we will examine AMD’s quarterly financial statistics, look at the potential drivers of this massive profit surge, delve into the forecasts provided by the corporation’s management and Wall Street analysts, conduct a technical analysis of the stock, and talk about the risks of investing in these securities.
Analysis of the Q3 2023 report of Advanced Micro Devices
Advanced Micro Devices Inc. released its Q3 report on 31 October 2023. Revenue increased by 4% compared to the figures from the same period in 2022, reaching 5.8 billion USD. Net profit skyrocketed 353% and 1007% compared to Q3 2022 and Q2 2023, respectively, reaching 299 million USD, with EPS surging 350% and 800% to 0.18 USD. Operating profit stood at 224 million USD, marking a 450% increase from the previous year.
AMD’s Q3 2023 revenue by segment
| Segment | Q3 2023 Revenue | Y/Y | Q/Q | Driver |
| Data Center | 1.6 billion USD | +0% | +21% | Strong demand for 4th Gen AMD EPYC processors |
| Client | 1.5 billion USD | +42% | +46% | Higher sales of Ryzen processors for PCs, laptops, and tablets |
| Gaming | 1.5 billion USD | −8% | −5% | Declining demand following a boom caused by the COVID-19 pandemic and mining popularity |
| Embedded | 1.2 billion USD | −5% | −15% | A drop in revenue in the communications market |
Drivers of growth in Advanced Micro Devices net profit for Q3 2023
A surge in Advanced Micro Devices Inc.’s net profit for July to September 2023 is likely to be attributed to increased revenue and strict expenditure control.
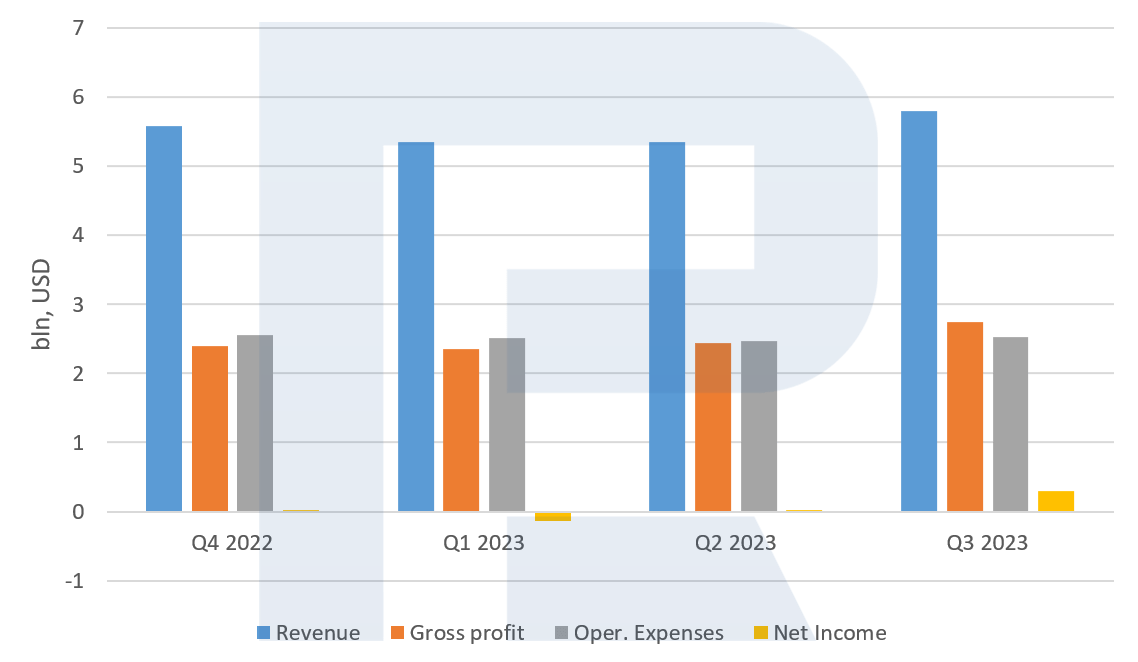
The below diagram shows operating expenses, gross profit, revenue, and net profit for four quarters from Q4 2022 to Q3 2023. As we can see, AMD’s operating expenses for this period have hardly changed, remaining at about 2.5 billion USD. However, compared to the figures for the end of 2021, they nearly doubled, driven by increased investments in AI-related products.
It follows from the diagram that gross profit for Q3 2023, which is linked to earnings, surpassed the operating expenses in contrast to the preceding three quarters. The result for July to September indicates that the net profit significantly outperformed the previous quarters.

AMD forecast for Q4 2023
The corporation’s management expects that Q4 2023 revenue will amount to 6.1 billion USD, reflecting a 9% year-over-year growth and a 5% quarter-over-quarter increase. The company predicts that such results could be attributed to a two-digit increase in Client and Data Center segment revenues. At the same time, the Gaming and Embedded segments are expected to experience a decrease in revenue.
Advanced Micro Devices Inc. specifically noted the strong demand for GPUs used in the artificial intelligence field. The company projects revenue of 400 million USD from the sales of these products in Q4 2023, with the potential to reach 2 billion USD based on the 2024 results.
Expert forecasts for AMD shares for 2023-2024
According to Barchart, at the time of drafting on 6 November 2023, 21 of 28 analysts rated Advanced Micro Devices Inc. stock as Strong Buy and set an average price target of 139 USD per unit. Six analysts assigned a Moderate Buy rating, with only one expert recommending holding the stock in the portfolio. It is worth noting that there are no recommendations to sell AMD’s shares.
Analysts at Tech Stock Pros have raised their rating from “Sell” to “Hold”, saying that they believe the more conservative forecasts provided by the company’s management for the upcoming period are closer to reality. These adjustments allow the company to move from pursuing ambitious projected figures. On the other hand, analysts from Bank of America do not recommend buying Advanced Micro Devices Inc.’s stock and have rated it as “Hold”. They are concerned that AI-related earnings will not be sufficient to compensate for the declining revenue in the Gaming and Embedded segments.
AMD stock analysis
Advanced Micro Devices Inc.’s stock broke the trend line on 6 October 2023, leaving the descending channel, which could suggest the end of the downtrend. The quotes later tested the trend line from the other side and rebounded from it. This might serve as an additional signal confirming a potential price rise.
The release of the quarterly report drove AMD’s stock up with the price breaking the resistance level at 111.50 USD. It can be presumed that the quotes may reach the resistance levels at 120.00 and 132.00 USD next. However, if the price returns to 95.70 USD, this might cancel the stock appreciation scenario, leading to a potential decline in the price to the support level of 81.00 USD.

Advanced Micro Devices Inc. live chart
AMD competition analysis
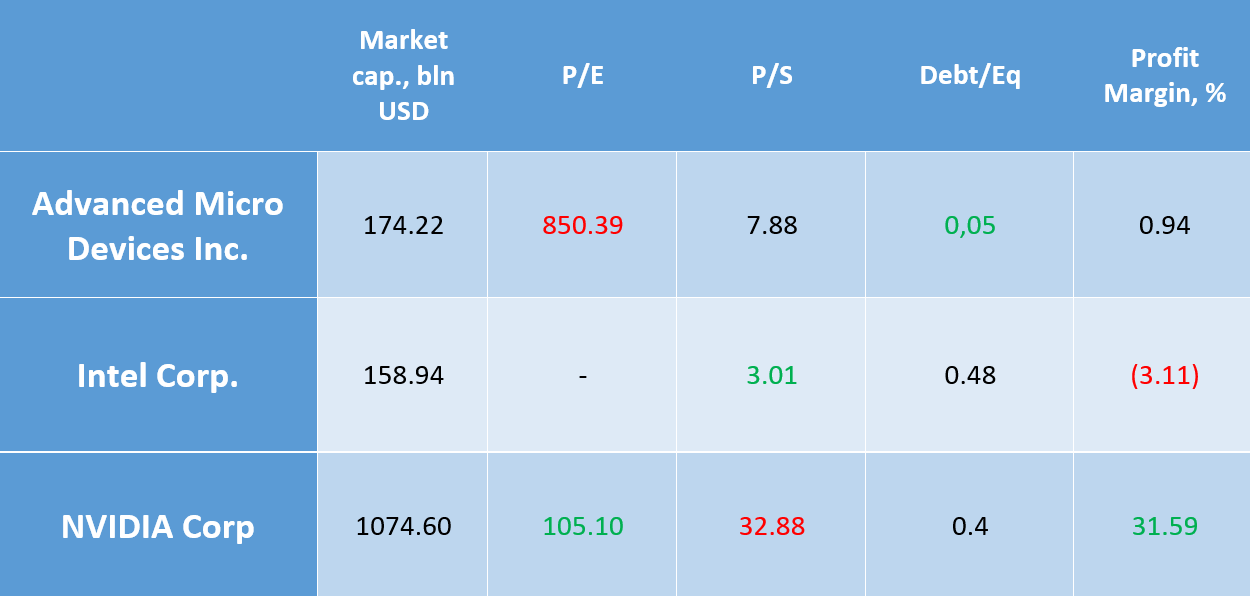
Let us compare Advanced Micro Devices Inc.’s performance with the statistics of NVIDIA Corporation and Intel Corp. for Q4 2022-Q3 2023. The first company is AMD’s competitor in the gaming and AI GPU market, while the second is its rival in the PC and server CPU market. In both cases, the corporation does not take the lead but is making efforts to increase its market share gradually.
Financial performance:
- Market capitalisation
- The Price-to-Earnings ratio (P/E) shows how much investors pay for each dollar of the company’s profit. It helps evaluate whether the company is undervalued or overvalued compared to other firms. The lower the ratio, the better
- The Price-to-Sales ratio (P/S) demonstrates how much investors pay for each dollar of the company’s revenue. The lower the indicator, the better
- The Debt/Equity ratio shows a share of borrowings in the company’s capital. The value below one is considered acceptable
- Gross margin demonstrates the portion of revenue that remains for the company after it has covered its production or sales expenses. A higher margin means a great share of capital retained by the company

Analysing comparison results
- Advanced Micro Devices Inc.’s P/E ratio reached 850, significantly exceeding the results of NVIDIA Corporation and any other company. Intel Corp. did not post a net profit for the period in question, which explains why it has no P/E ratio. AMD’s high P/E ratio is attributed to poor statistics for the previous four quarters, with the profit at zero values. Based on the Q1 2023 results, the company even posted a loss. It can be presumed that if Advanced Micro Devices Inc. manages to reach 2022 average earnings, the P/E ratio will likely return to the 30-40 range. This will be considerably lower than that of NVIDIA Corporation. The average P/E ratio in this sector stands at 24.19
- The average P/S ratio in the semiconductors industry is 2.87. All three companies have an above-the-average ratio, which is an indication of an overbought status. NVIDIA Corporation has the highest P/S ratio of 32.88
- AMD is taking the lead in the Debt/Equity ratio, which means that the company may utilise a significant amount of funds for its development, not for debt servicing. However, it is essential to note that the debt burden of competitors does not exceed 1 either, showing an acceptable result
- NVIDIA Corporation is the leader by business margin. This is likely to indicate more efficient conduct of business compared to the competitors
Risks of investing in AMD shares
Unfortunately, US semiconductor companies became victims of the trade war between the US and China, as part of which the US is limiting the sale of chips to China. The latest news to this effect was a ban on exports of NVIDIA and AMD’s AI chips to China. Advanced Micro Devices Inc. is already considering selling specifically designed chips to comply with sanctions. However, this will entail additional costs, and there are no guarantees that these products will not be banned in the future. The company says that China is its important target market.
Competition also presents a risk to investments in Advanced Micro Devices Inc. Notably, Intel Corp. reported a net profit of 297 million USD for Q3 2023, indicating the company’s return to profitability. Meanwhile, NVIDIA Corporation’s strong business margins provide the company with the flexibility to adjust its product prices to enhance competitiveness.
Conclusion
Advanced Micro Devices Inc.’s shares are trading 32% below their all-time high; the company returned to net profit while its management forecasts better financial performance, and experts recommend buying its stock. All these factors along with technical analysis suggest a potential further rise in the stock value. Unless the US economy experiences any turmoil during the next few quarters, AMD shares are highly likely to be able to reach the resistance level at 130 USD and the price target of 139 USD, as indicated by the experts mentioned above.
Frequently Asked Questions (FAQs) about AMD and its stock
What was the percentage increase in AMD's net profit in Q3 2023 compared to Q2 2023?
AMD's net profit surged by 1007% in Q3 2023 compared to Q2 2023.
How does AMD's Q3 2023 net profit compare with its main competitor, Intel Corp?
AMD's Q3 2023 net profit was 299 million USD, which is 2 million USD more than Intel Corp.
What is the forecast for AMD's revenue in Q4 2023?
AMD's management expects Q4 2023 revenue to reach $6.1 billion, marking a 9% year-over-year increase and a 5% quarter-over-quarter increase.
What are the Wall Street analysts' expectations for AMD's stock in 2023-2024?
As of 6 November 2023, 21 out of 28 analysts gave AMD's stock a "Strong Buy" rating with an average target price of $139.
What segments contributed to AMD's revenue in Q3 2023, and which showed the highest growth?
The Data Center and Client segments showed significant growth, with revenues of $1.6 billion and $1.5 billion, respectively, while the Gaming and Embedded segments saw a decline.
What factors contributed to the significant rise in AMD's net profit in Q3 2023?
The significant rise in AMD's net profit is attributed to increased revenue and strict cost control.
How is AMD performing in the market compared to NVIDIA Corporation and Intel Corp?
AMD competes with NVIDIA in the graphics processors market and with Intel in the PC and server CPU market, gradually trying to increase its market share.
What are the risks associated with investing in AMD shares?
The risks include the impact of the US-China trade war, particularly the sales restrictions of AI chips to China, and intense competition, especially from NVIDIA and Intel.
How did AMD's stock respond to the release of the Q3 2023 report?
AMD's stock price broke through the descending channel trend line and resisted the downward pressure, indicating the potential for price growth.
What is the significance of AMD's P/E and P/S ratios compared to the industry average and competitors?
AMD's P/E ratio reached 850, significantly higher than its competitors, signalling a high valuation by investors, while the P/S ratio for all three companies exceeds the industry average, suggesting overvaluation.
* – The charts presented in this article are provided by the TradingView platform, which offers a wide range of tools for analyzing financial markets. It is a convenient, high-tech online market data charting service that allows users to perform technical analysis, research financial data, and communicate with other traders and investors. Moreover, it provides valuable guidance on how to read forex economic calendar effectively and includes insights into other financial assets.


