
In this article, we will examine the medium-term indicator trading strategy "Three Moving Averages + MACD". We will learn how to install these indicators on the chart and use them in trading.
All posts

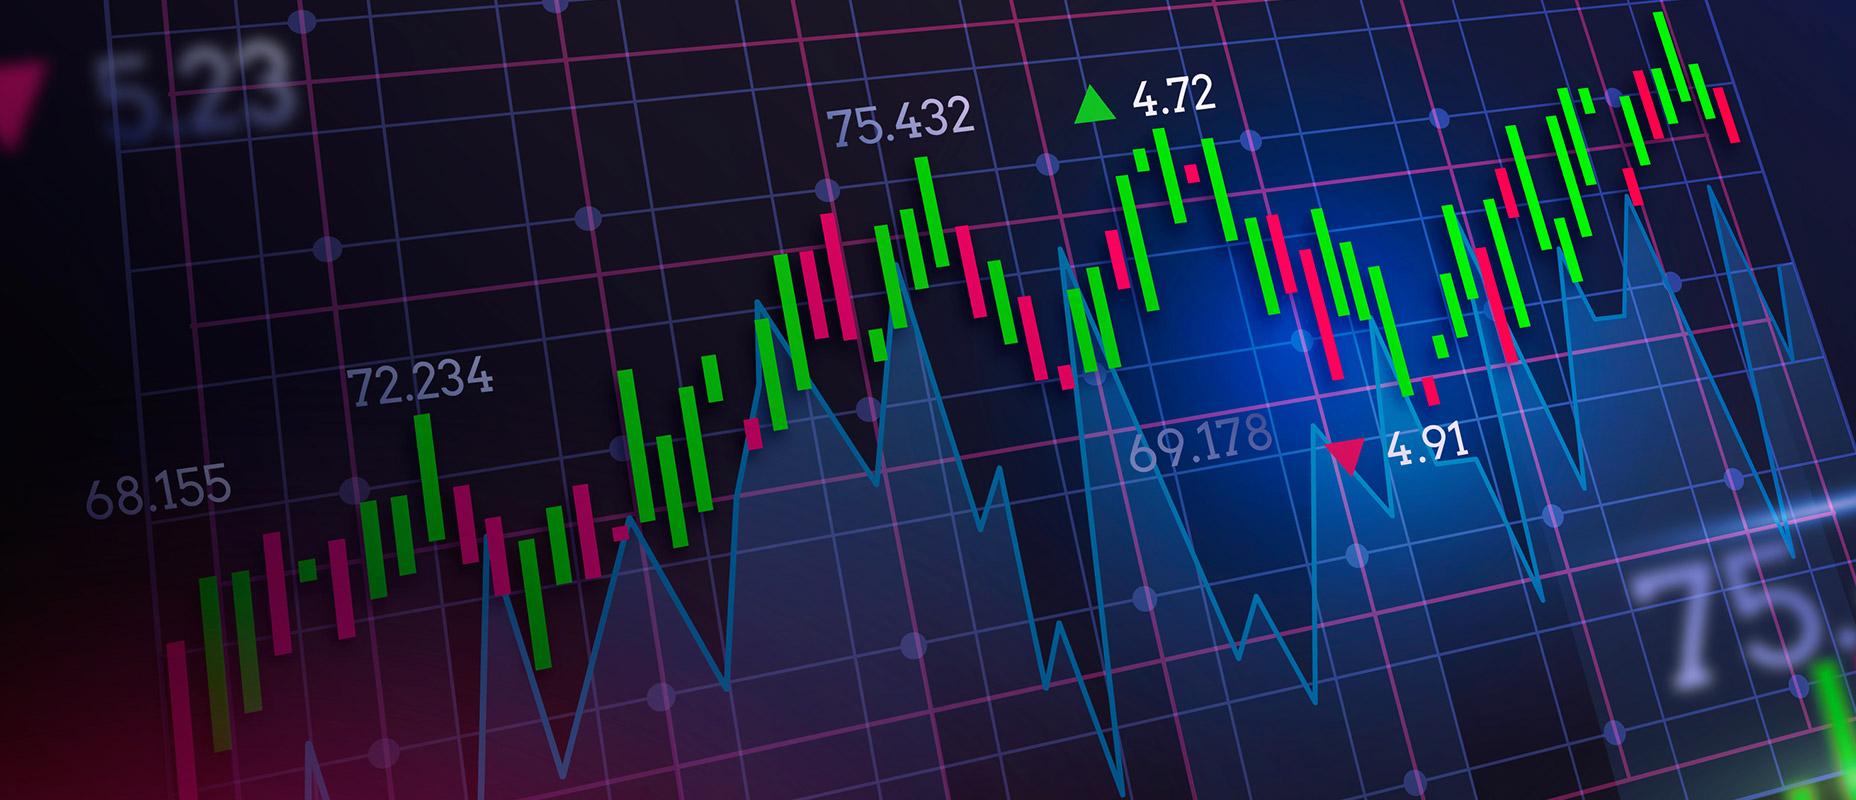
Trading chart patterns are specific and repeated areas on the price charts and sometimes they are called price patterns or formations. Here you can find the description of the 14 most popular trading chart patterns.
We explain how the long-term "S&P 500 Trend Following" strategy works, how it is used in trading, what its advantages and disadvantages are, and what indicator signals it is based on.

In this review, we will get acquainted with the candlestick trend continuation pattern called "On Neck". We will consider the features of its formation and the trading rules with its application. We will learn its main advantages and disadvantages, as well as list a few important recommendations for its use.
Take our quiz to evaluate your knowledge of Forex by answering questions of different difficulty levels: from basic notions to technical analysis and trading strategies.

All Traders who have a CopyFX strategy for their R StocksTrader account now have the opportunity to receive additional income in the form of a “Performance fee” from Investors.
Let's look at a medium-term indicator trading strategy using multiple moving averages based on Fibonacci numbers. We will find out what indicators to set, and talk about the rules for making trades.

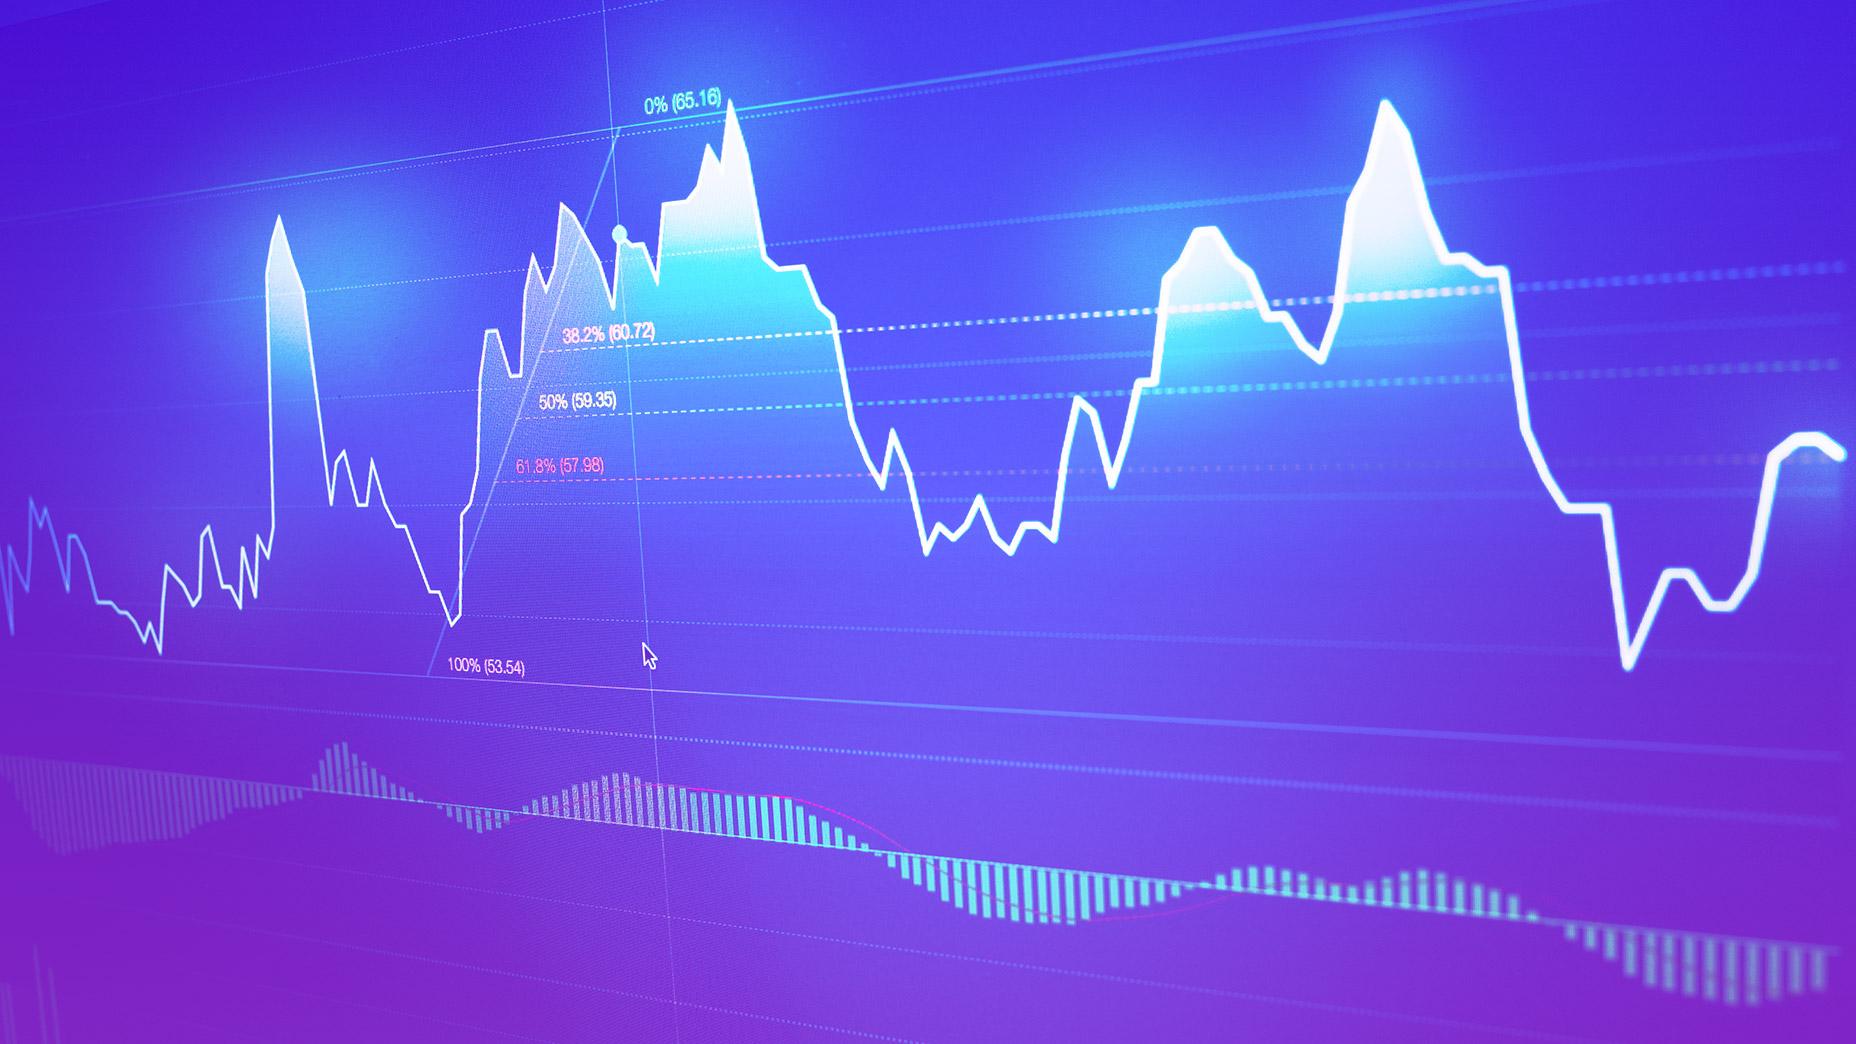
Here is how to use the Bollinger Bands indicator signals with three different deviation values. We will look at the intricacies of opening positions, and discuss the rules for setting Stop Loss and Take Profit strategies when trading GBP/JPY.

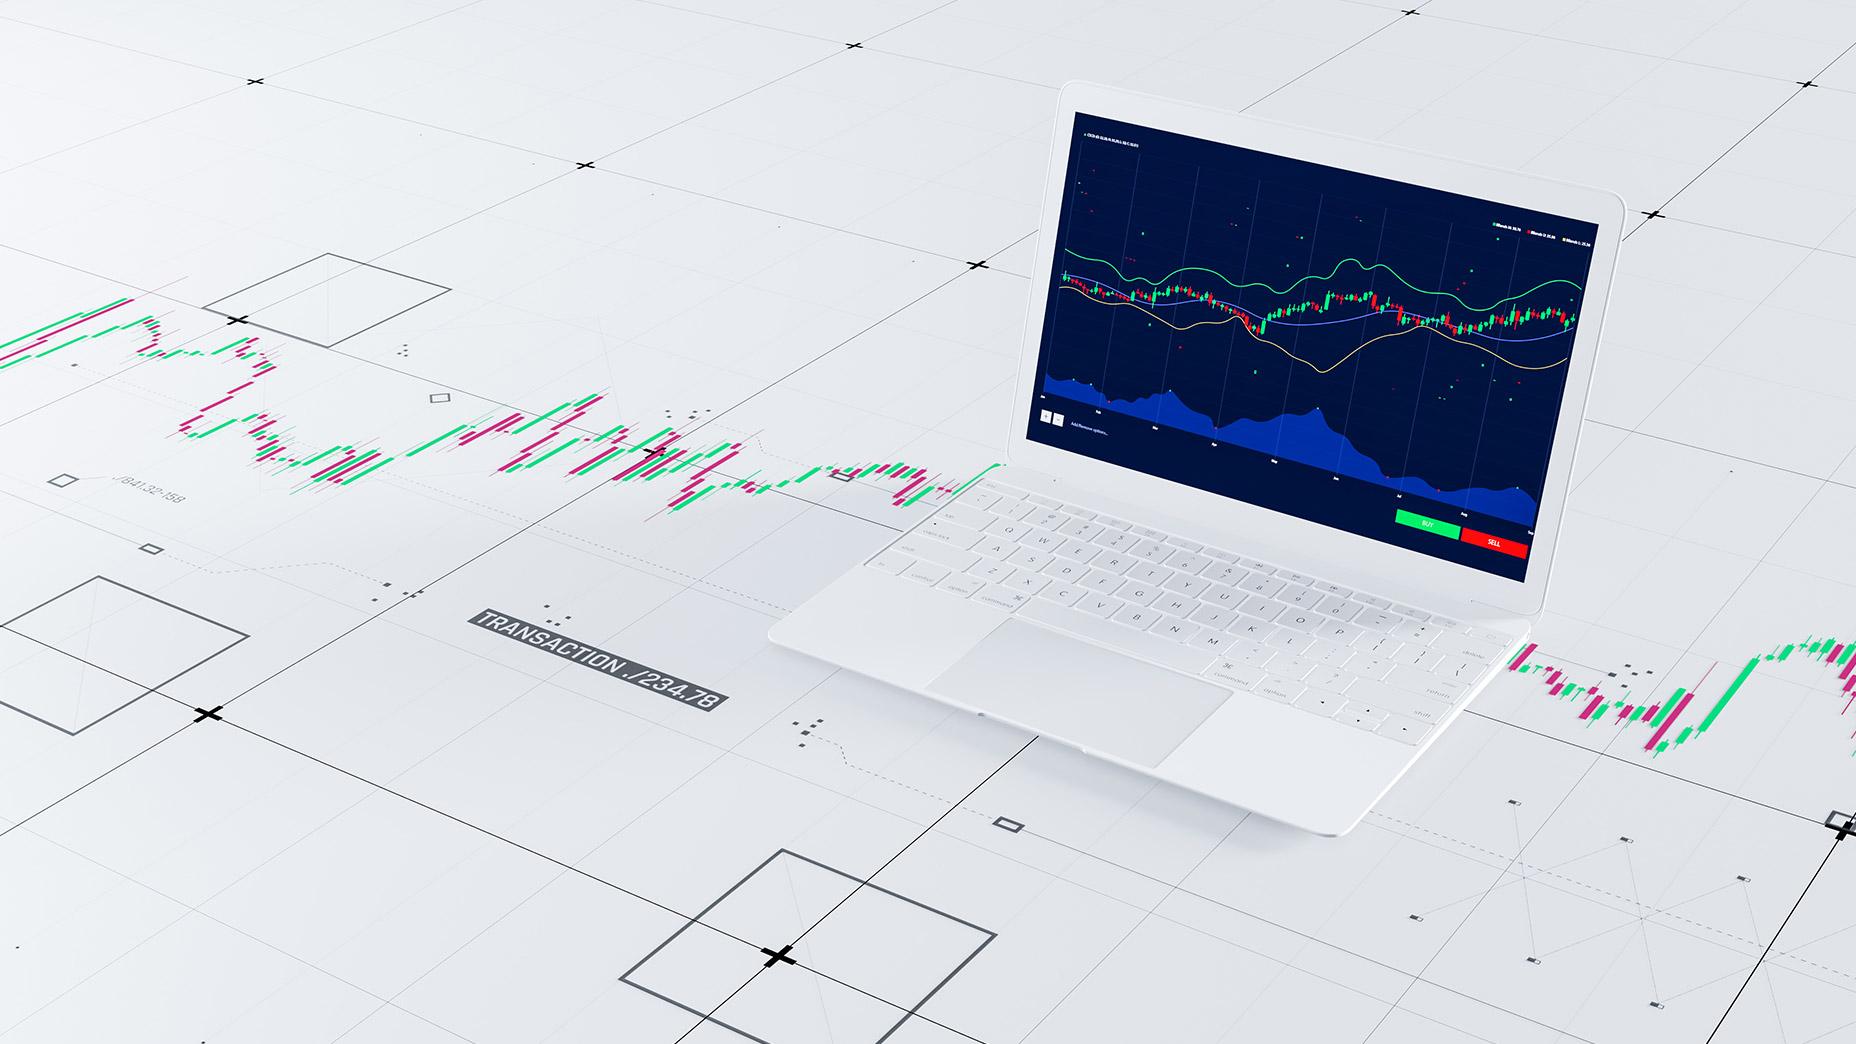
Today we will tell you how to test a trading strategy. We will begin by explaining what a trading strategy is, why it needs to be tested, and how to do this. We will also share some important recommendations.
In this material, we will get acquainted with the "Double 7” trading strategy of the famous trader Larry Connors. We will learn what it is based on, and how it can be used in trading. We will consider its advantages and disadvantages and give an example of trading with this strategy.

Description: In this article we will introduce you to the Rate of Change trading indicator. We will consider the peculiarities of its work, the formula for calculating it and the signals that can be used for trading.

We will show you how to trade the Support and Resistance Based on the 240 Bars medium-term strategy. We’ll explain the subtleties of using the SF Trend Lines indicator and the rules for setting Stop Loss and Take Profit.

In this review we will get acquainted with a strong reversal pattern from candlestick analysis called "Abandoned Baby". Let's take a look at the features of its formation and the trading methodology of this pattern.

In this review, we will get acquainted with the short-term strategy "Day Movement". It is based on identifying and trading a sideways price range (flat) formed before the start of the European trading session.

In this material, we will look at OPEC and its activities. We will look at the history of OPEC and how it was established. We will also try to analyse how it can influence world crude oil prices.