Creating Trading Strategies Based on Mean-Reversion and Momentum

8 minutes for reading
I think researches on trading systems is the main issue of building trading strategies. Our main goal is to build a strategy, which will be successful in the future and not only on backtests (curve-fitting). That is why I consider it right to start the topic with the description of the two approaches to the creation of trading strategies.
Two approaches for researching of trading systems: data mining and statistics vs market structure research

Market structure research
Understanding the essence of inefficiency, which underlies the system earnings. For speculation, the basis of this can be expressed in Buffett's aphorism: “If you've been playing poker for half an hour and you still don't know who the patsy is, you're the patsy.” If you do not know who loses on the exchange, then you lose. You should know it when you trade. To earn money on a system, other traders must lose on this system. Again, trading is a zero-sum game. Understanding the market phenomenon is very different from "dragging opinions onto the market."
First, we formulate a hypothesis about the behavior of one or another type of participant. Then we express this hypothesis in terms of price, volume, and so on. And only then we test this hypothesis on history. If it “came together” exactly as we assumed, then the chances that this is just an accident are extremely low. in this way we get at the same time both the “built-in” robustness and the “trigger”, the performance of which allows us to judge that the phenomenon has died.
For example:
- There are some common behavioral patterns of mutual funds, for example, a few days before the end of the month they sell off liquid stocks and in the first two-three days of the beginning of the new month, they buy them back. So, you can identify them and try to build Mean-Reversion trading strategies based on these price movements.
- In Brazil in 2014 there were frosts and the price of coffee was increased significantly. It was like a big coffee crop loss. Those who had access to data on the volume of Brazilian coffee for export in export certificates saw that the volumes prepared for export did not fall much. *For export, you must first obtain a certificate (you must provide information about the volume and batch of coffee for analysis). In other words, farmers saw that frost damage was not so strong and boldly sold coffee. Price then returned to previous levels.
Advantages of this approach:
- Understanding the process, its mechanisms
- Ability to start and stop trading in time
Disadvantages of this approach:
Data mining and Statistics approach
Data mining is a subset of computer science. It joins branches of computer science, machine learning, a subcategory of artificial intelligence, and database systems, with statistics. It is the process of discovering information in large data sets. The goal of data mining is to transform a data set into understandable and usable information.
You can develop and research strategies using machine learning techniques for any market or timeframe using Price and Nonprice data. You can generate and verify millions of different entry and exit conditions, order types and price levels, to find best performing strategies according to your selection criteria – for example, Net profit, Return vs Drawdown, Sharpe ratio, etc.
The source of fitting could be a set of absolutely random coincidences, or some long-lasting factor that acted on a significant part of the test period, but not the fact that it will continue in the future. Examples, long bullish trends and the advantage of long trading systems.
"Don't Confuse Genius With A Bull Market" (с).
But there may be other examples - such as a long flat period or trend, etc. Of course, one can argue here that any system uses a favorable phase that has been protracted for it and there are no guarantees that this will continue. And you can only be a bull in a bull market if you know when to stop. If the allocation of favorable phases for the system is formalized and implemented in the form of system filters, then this is good. But everything can not be formalized and know in advance. For this, there are criteria for rejecting the system, out of sample validations, etc.
Advantages of this approach:
- Research Speed
- Simplified monitoring by formal criteria
- You can trade dozens of strategies in parallel
Disadvantages of this approach:
- Additional costs for disappearing inefficiencies (lag to start and stop trading)
- Not understanding of market microstructure.
Mean-reversion vs. Momentum strategies

Momentum and Mean-reversion are 2 global classes, which include almost any trading system. These are two opposites. It’s property of price to continue movement versus the property of price to reverse back.
Who loves physical analogies, then for Momentum has the property of physical bodies to continue moving even after the initial impulse has ceased to act, and Mean-reversion is like a pendulum that by impulse passes the equilibrium point, are forced to return it.
They both seem to be opposite of each other but they both work well. The reason that is possible they work at different time horizons. If you generalize, the reason is that investors behave a certain way.
Trend-Following (Momentum) strategies have a long track record of performance. The famous expression "Trend is your friend", it refers to Momentum. One-sided, but written for the trend stock market of the last century.
Mean-reversion, especially at shorter time frames, works well. Let’s look at trend-following strategies
Why do trend-following strategies work?
Trend-following works when you look at the trend in returns over the last year or so. If you look at shorter durations like the trend over the last month and try to follow that you might lose your shirt. When Trend-Following strategies work, they usually have big gains. But when they don’t work they have small losses. This is called a “positive skew”.
A few Momentum metrics
- The forced sales/ purchases of assets of various types of funds (volume traded).
- Time Series momentum. The past return of price series is positively correlated with future returns.
- Limitations on liquidity. To enter or exit a large size, the trader is forced to split it into pieces. As a result of its periodic trades, a movement is formed on a certain time frame.
- Temporary liquidity failures at certain levels or at certain points in time. When there is low liquidity to sell, for example (limit orders if on an exchange), then even relatively small purchases will cause a significant up-pulse.
What is Mean-reversion strategies
Mean-reversion works because of short-term demand-supply imbalance. Usually, people employ mean-reversion strategies at short timeframes (minutes or days or even microseconds. The microsecond part of the trade would be HFT. It could be pair trading, spread trading, arbitrage, and quasi-arbitrage are the same; they open positions with a strong divergence in asset prices.
Mean-reversion strategies would have small gains but big losses. it is supposed to work most of the time and to avoid the big losses we need to have very strict mechanized risk management.
A few Mean-reversion metrics
- Low volatility (FX midnight time).
- The temporary strength of the limit order side versus the market order side. This is usually the case in round-the-clock markets at certain times.
- The entrance of many participants (not only speculators) is followed by exit (closing of these positions). For example, most intraday stock traders who entered a long position will sell it at the end of the trading session. It will create the opposite movement.
Are there generalized mathematical models?
There are several models - the Hurst Exponent, H-volatility and some others, which immediately contain the Momentum and Mean-reversion models as well as 3 intermediate states. There is, for example, such a model as cointegration, for which its creators received the Nobel Prize. This is a generalized model of Mean-reversion.
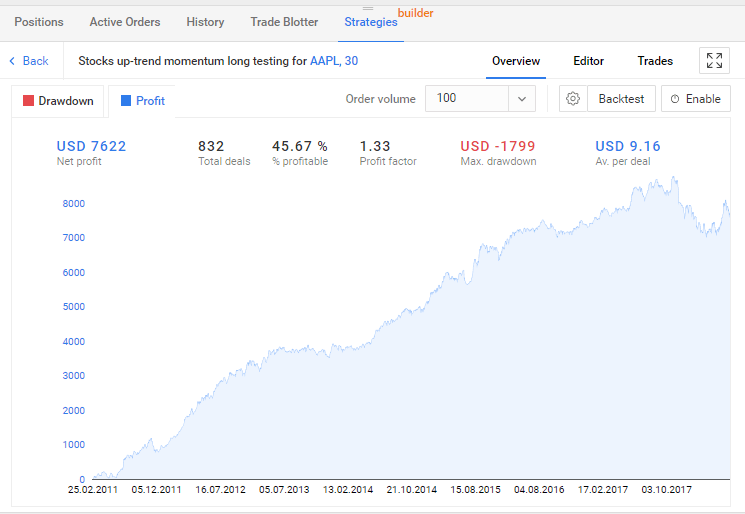
Example of Stocks up-trend momentum long strategy
You can find in https://rtrader.umstel.com/. This strategy is based on an algorithm that allows you to identify the beginning of momentum buy on the 30-minute chart, going in the up-trend direction.
- AAPL, Min 30 timeframe.
- Long entry signal: The last three bars are opening above the previous one, closing above the previous one. EMA(14) > EMA(50).
- And the difference between EMA(14) to EMA(50) less than 3%.
- Exit signal: Take Profit = 100 ticks, Stop Loss = 50 ticks or SMA(9) <cross EMA(14)
- Order volume: 100 shares.
- Time: Working days, 16:40-22:40.
In the next article, we will speak about building and testing algorithmic strategies in more detail.
See you soon!


