Measuring the Strength of Currencies with CSS Indicator

6 minutes for reading
Today we will discuss the Currency Slope Strength indicator (CSS), its settings, and application options.
Some Forex strategies require calculating the entry point parameters with the use of conditional currency strength. The CSS indicator is meant for measuring the strength of currencies relative to each other. To put it simply, it shows which currency is stronger in the pair at the moment - the pair will then move in its direction. This is a simple condition that the indicator is based on.
In the earlier versions of the indicator, the relation of only two currencies in a pair was calculated. Later, however, the author concluded that all instruments needed comparison and changed the calculation method. The key quality of this indicator is its simplicity. The deviation of the indicator from zero means that the currency signified by the indicator is prevailing. When the indicator crosses the zero level, the trend reverses. Though simple, these signals incorporate good potential and the experience of many Forex players.
CSS parameters
- CSS is a multicurrency indicator.
- It is used on H4 and D.
- It may be used 24 hours a day.
CSS indicator algorithm
For calculation, the algorithm of the TMA indicator is used: the strength of movements is defined by the line slope. The signals from TMA are processed by the CSS algorithm, and we receive a signal without lagging. For example, to evaluate the strength of the Canadian dollar, the indicator measures the slopes of all instruments with the CAD and calculates the average.
A line going upwards means the growth of the instrument, a line going down means a decline. If the line moves horizontally, it indicates a flat or a lack of an impulse. The angle of inclination shows the strength of the currency: the steeper the slope, the stronger the instrument.
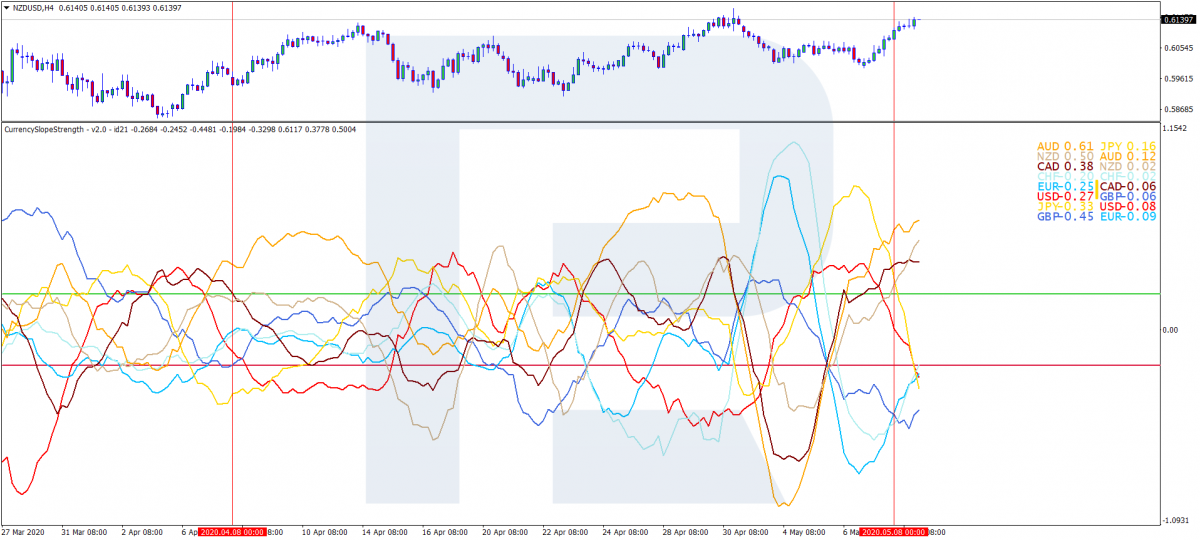
However, note that the indicator does not show the direction of the trend, only the strength of the currency. It does not give signals of a trend on the market, just forecasts one currency becoming stronger than the other. The indicator is displayed in a separate window under the price chart, as you may see in the picture below.
CSS settings in the terminal
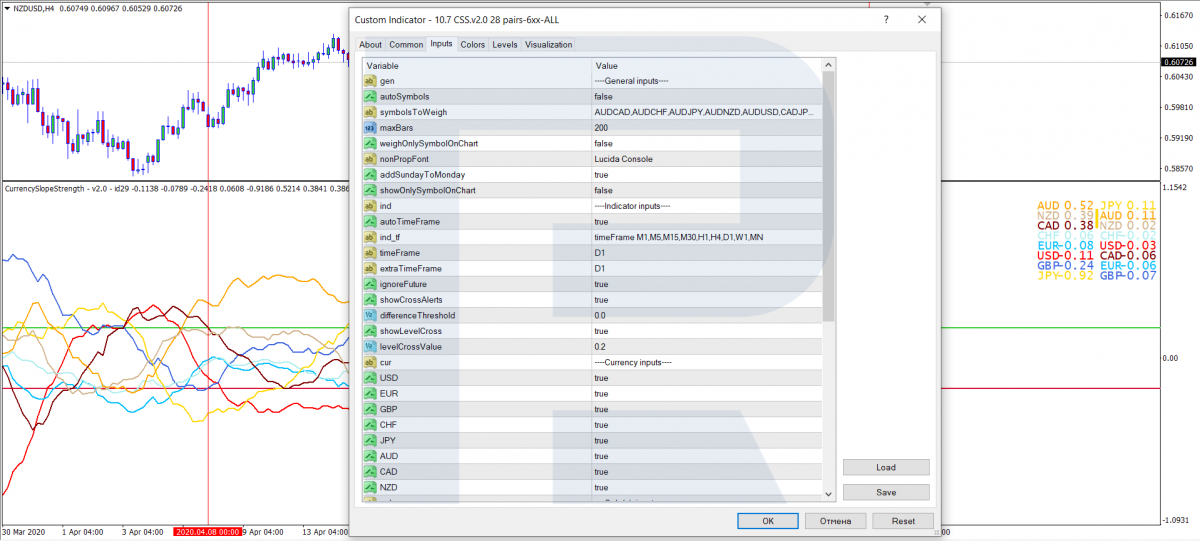
The entry parameters of CSS are quite abundant and customizable.
- Auto Symbols: choose all symbols from the market review automatically
- SymbolsToWeigh: choose symbols manually
- maxBars: the maximal number of bars used for calculations
- nonPropFont: change the font
- addSundayToMonday: delete Sunday from the calculation algorithm
- showOnlySymbolOnChart: hide all disused symbols
- autoTimeFrame: choose the timeframe automatically
- timeFrame: choose the timeframe manually
- extraTimeFrame: choose an additional timeframe
- ignorFuture: disable redrafting the indicator
- showCrossAlerts: the basic alert triggered when the lines cross
- differenceThreshold: change the background color when the spread expands
- showLevelCross: draw the channel lines
- levelCrossValue: digital channel lines
- cur: show separate currencies
- colour: choose the color of the currencies
Also, you may change the color scheme; however, the default settings will help you concentrate. All other settings are customizable according to your trading style and strategy. For your convenience, the color of the lines and the letters in the right corner of the indicator is the same.
By default, the levels are set as +20 and -20; their crossing is also a signal.
CSS indicator signals
The indicator is primarily intended to measure the relative strength of currencies, that is the advantages of one currency over another. The indicator does not predict volatility, and the actual price movement after receiving a signal may be minimal, but it can provoke a long-term trend.
The crossing of the indicator lines
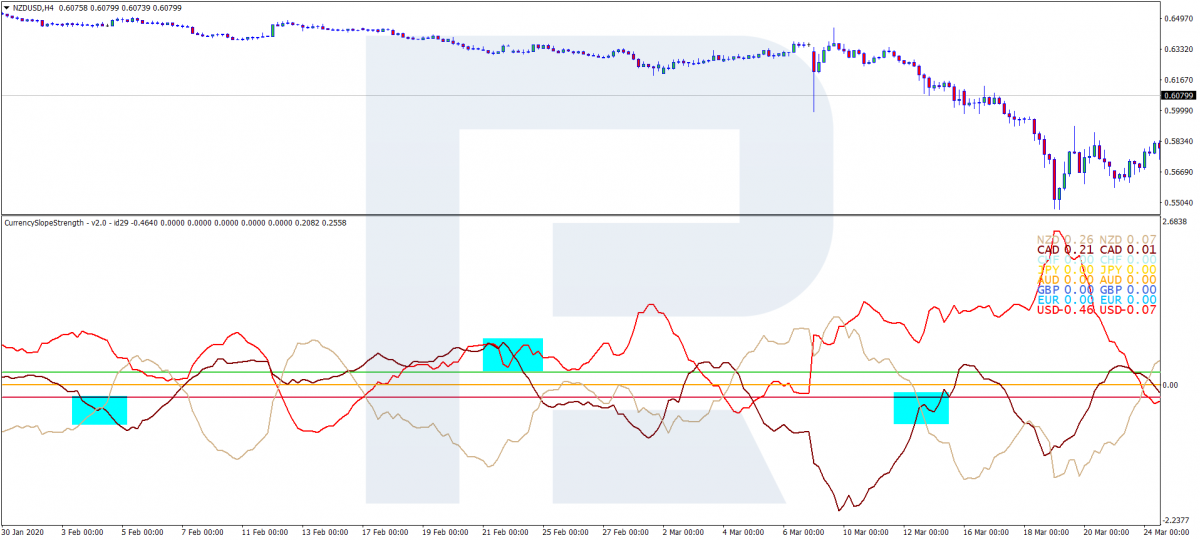
Now that we have discussed the direction of the lines, let us talk about their crossing. There are four main crossing options.
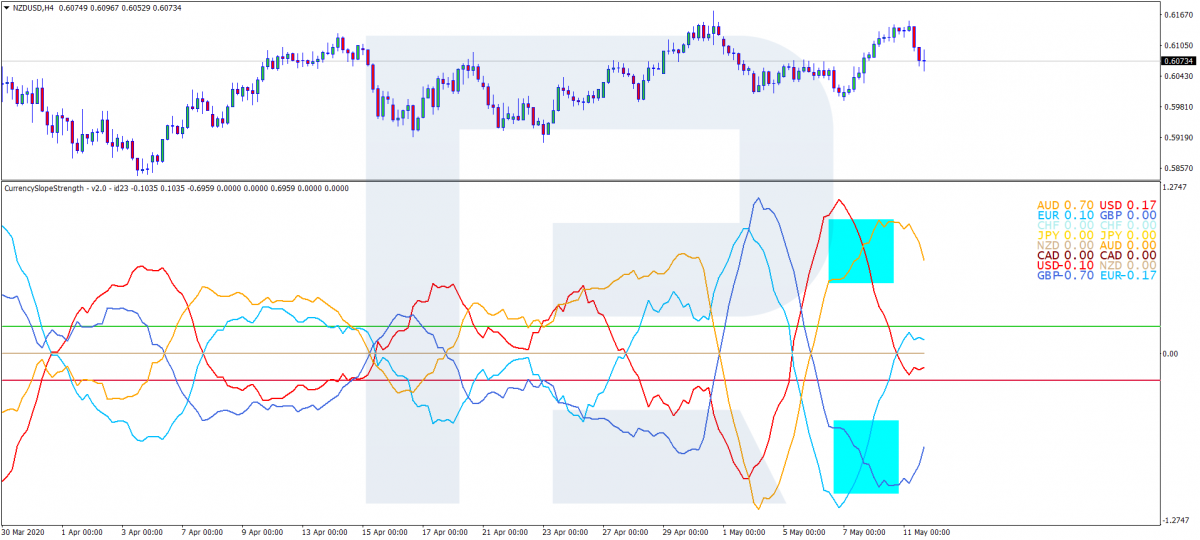
Crossing out of the channel borders
Such a crossing means that one currency is becoming stronger than the other and may signal strong momentum in the prevailing currency.
Crossing inside the channel borders
It indicates that a flat may follow. Trading signals are better ignored.
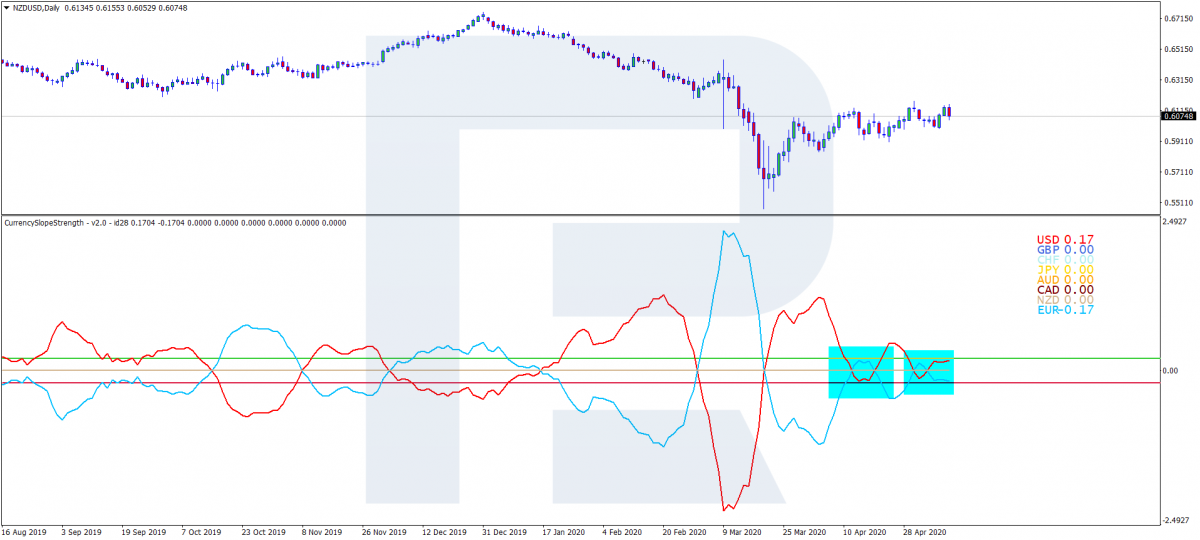
Crossing the lines while one escapes the channel and the other enters it
This is a weak signal which might mean the beginning of a new trend.
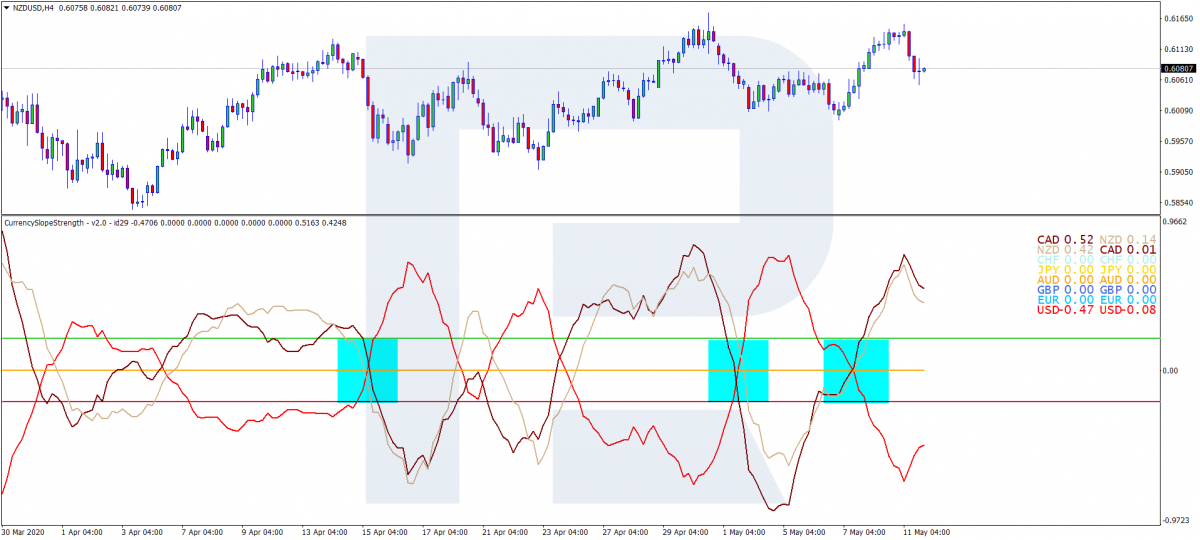
Crossing inside the channel
In this case, after the crossing, the lines go in opposite directions and break away both channel borders. This signals a strong and lengthy trend. This signal is considered to be good for opening a trade.
The movement and direction of the lines
Parallel movement
This indicates that the currencies are equally strong. As a rule, the lines may move in any direction: up- or downwards, or horizontally but on the chart, all these movements will be shown as a flat.
An escape of the signal line from the channel borders, a breakaway of +20 or -20
This signals the beginning of a trend. The color of the signal line will show which currency is becoming stronger.
Additional signals
When the signal line crosses +20 or -20, a green or red marker will appear near the ticker.
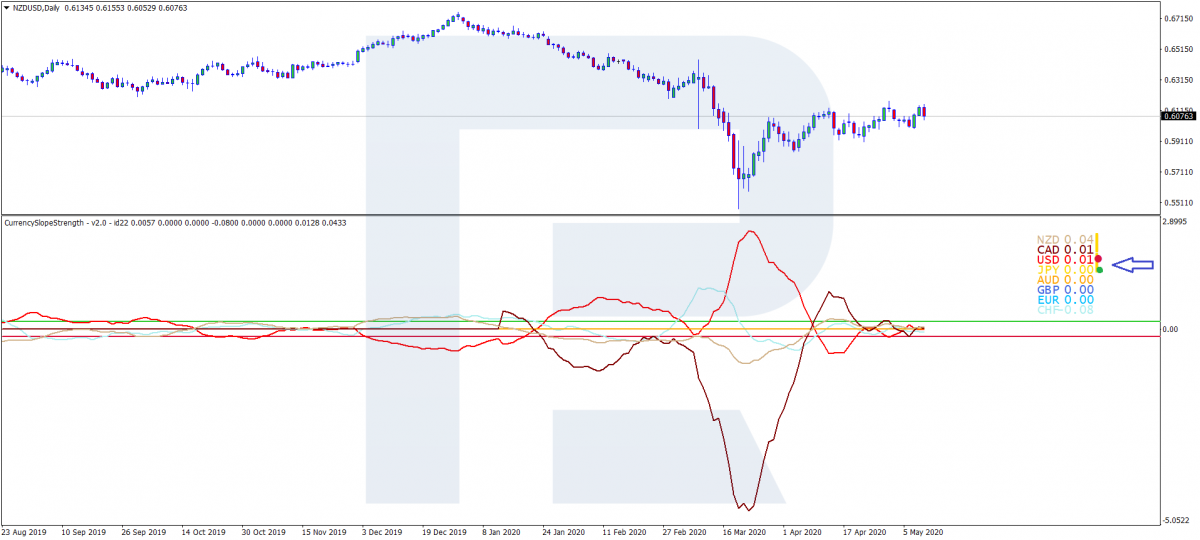
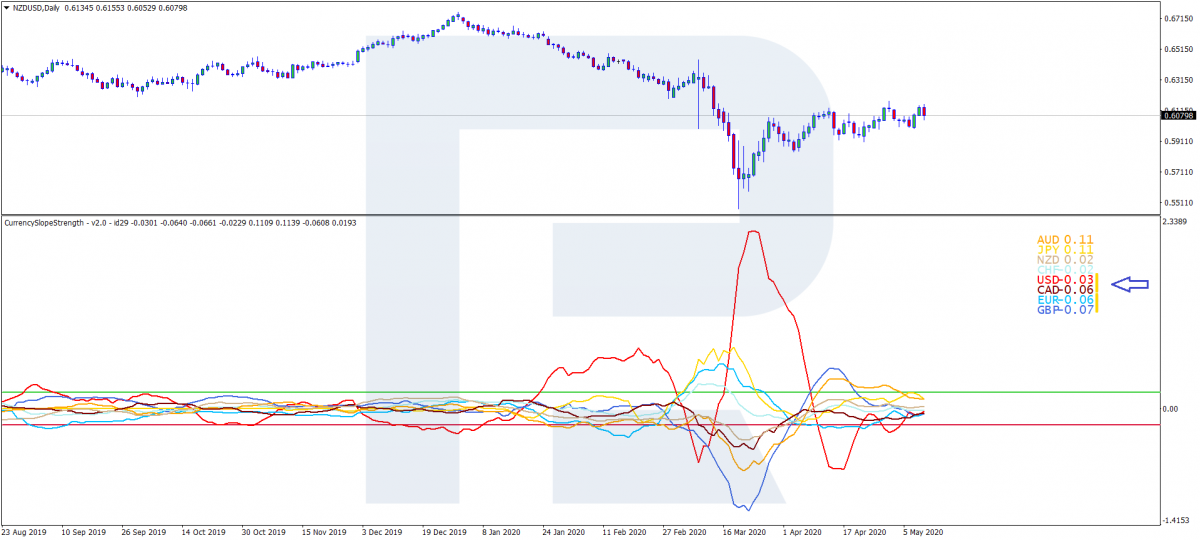
When two signal lines cross, an orange line will appear in front of the ticker.
Summary
The author aimed at making an indicator that will help to asses the relative strength of currencies for finding better entry points to the market. Practice shows that the indicator performs its task well. It might be improved further - time will show.
Keeping in mind the specifics of the signals, CSS is better used with other indicators. CSS may show when one currency starts acquiring strength, and with the help of other filters (indicators), you may find an optimal entry point. I also think that CSS will only enhance your complete trading strategy.
Anyway, to use this indicator efficiently and understand its signals better, we need to study it in detail and practice using it, including alongside other indicators and strategies, without much risk.


