How to Set Up and Use the Accumulation/Distribution Indicator?

6 minutes for reading
Today, I will get you acquainted with the Accumulation/Distribution (A/D) indicator. By the author’s idea, it must define and compare the buy and sell volumes of the asset. Such a comparison may help the trader to find the entry point to the market. For example, if buys prevail, the asset is likely to go on growing.
Let us have a look at the settings and ways to use the indicator.
Location and appearance of the Accumulation/Distribution
The A/D indicator is included by default in most trading terminals, both the mobile and desktop versions. It is not extremely popular among traders, however, it is as worth as others.
If you spend some time studying its principles of work, you may use it as a filter for ready trading strategies or along with other indicators. It might be used on its own, however, defining the signals may be difficult.
In MT4, A/D can be found in Indicators – Volumes.
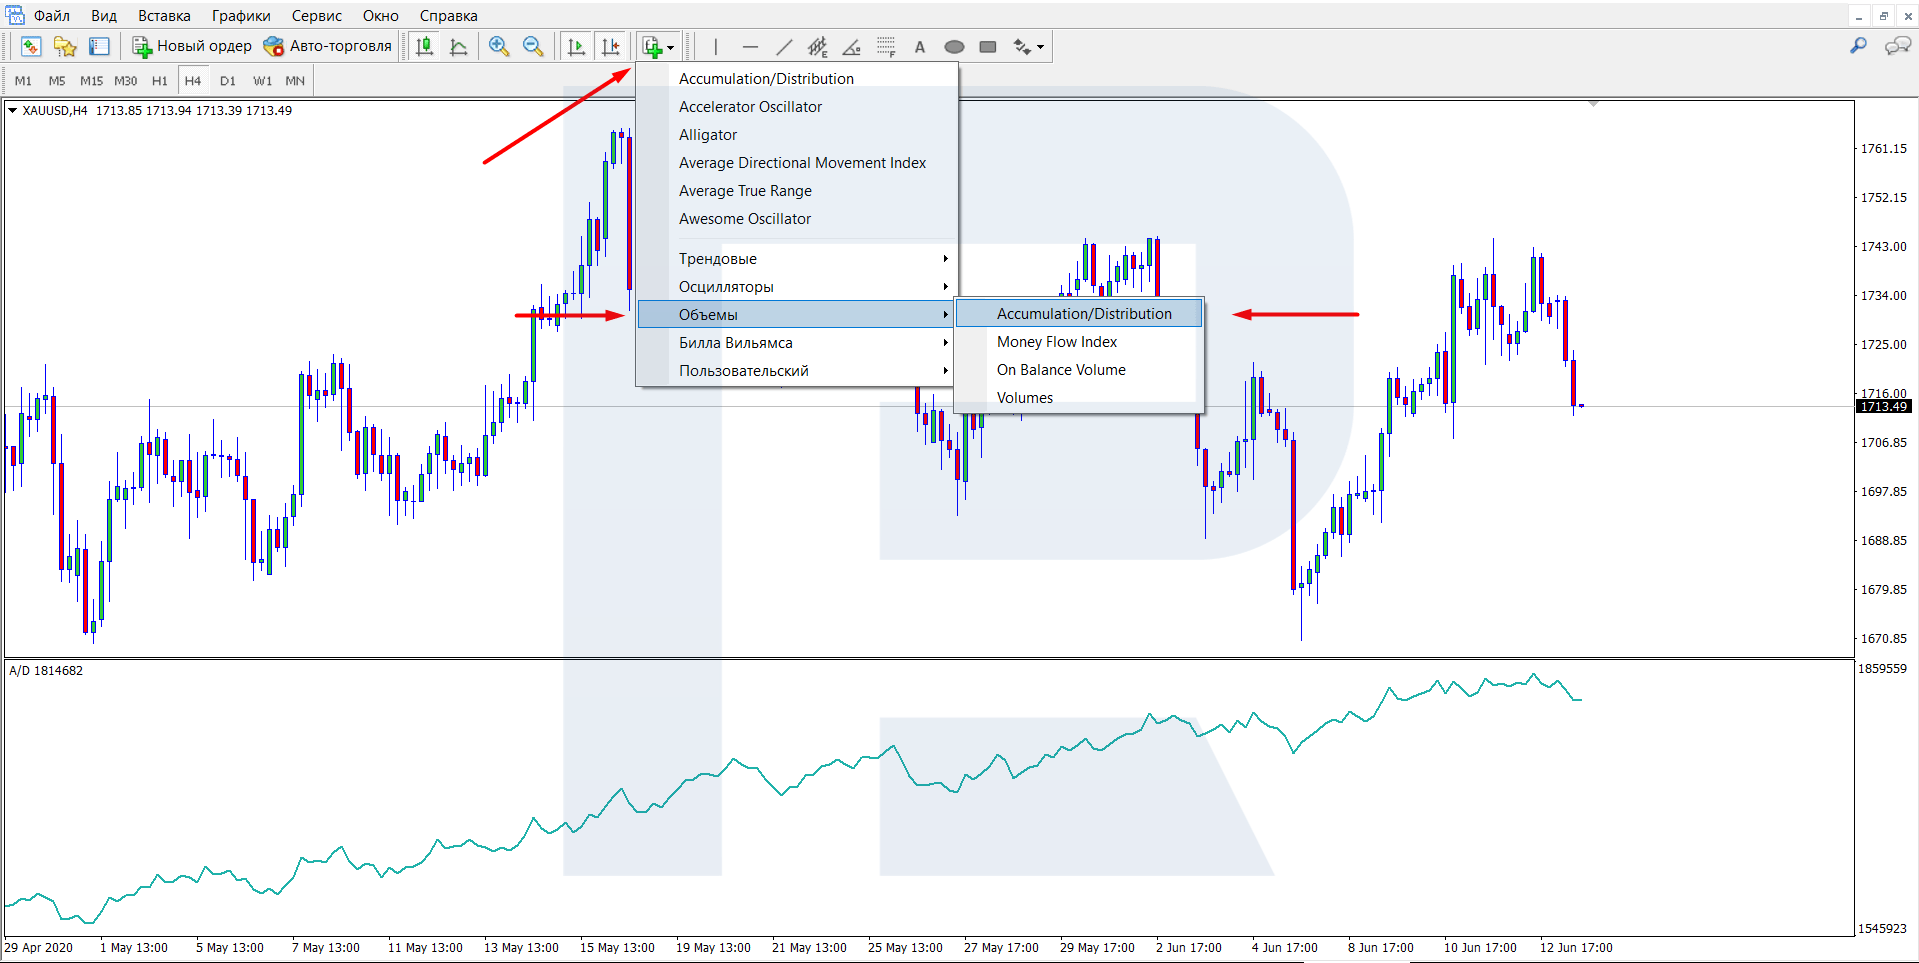
This indicator opens in a separate window and looks like a curved line that almost all the time mimics the movements of the price chart. In the settings, you may change the color and width of the line. These are the only settings of the indicator.

Calculation formula of the Accumulation/Distribution indicator
The formula was composed by a trader Marc Chaikin. It is applied to each bar of the chosen period and consists of the following:
From the difference of the close price and the low of the candlestick subtract the difference of the high and the close price; divide the result by the difference of the high and low. Then multiply the result by the trade volume of the instrument. Then add the same result for the previous bar and repeat the full calculation.
We do not need to analyze the formula and calculations deeply as the terminal knows better. Our task is to learn the signals.
Accumulation/Distribution signals
There several types of A/D signals:
- Divergence/Convergence
- Tech analysis patterns
- Defining trend direction
Let us discuss the signals in detail.
Divergence/Convergence
This is the difference between the price chart and the indicator line. As a rule, such a difference emerges in places of a trend change, at the beginning of a correction, or the end of a pullback. These points may be used for entering the trade.
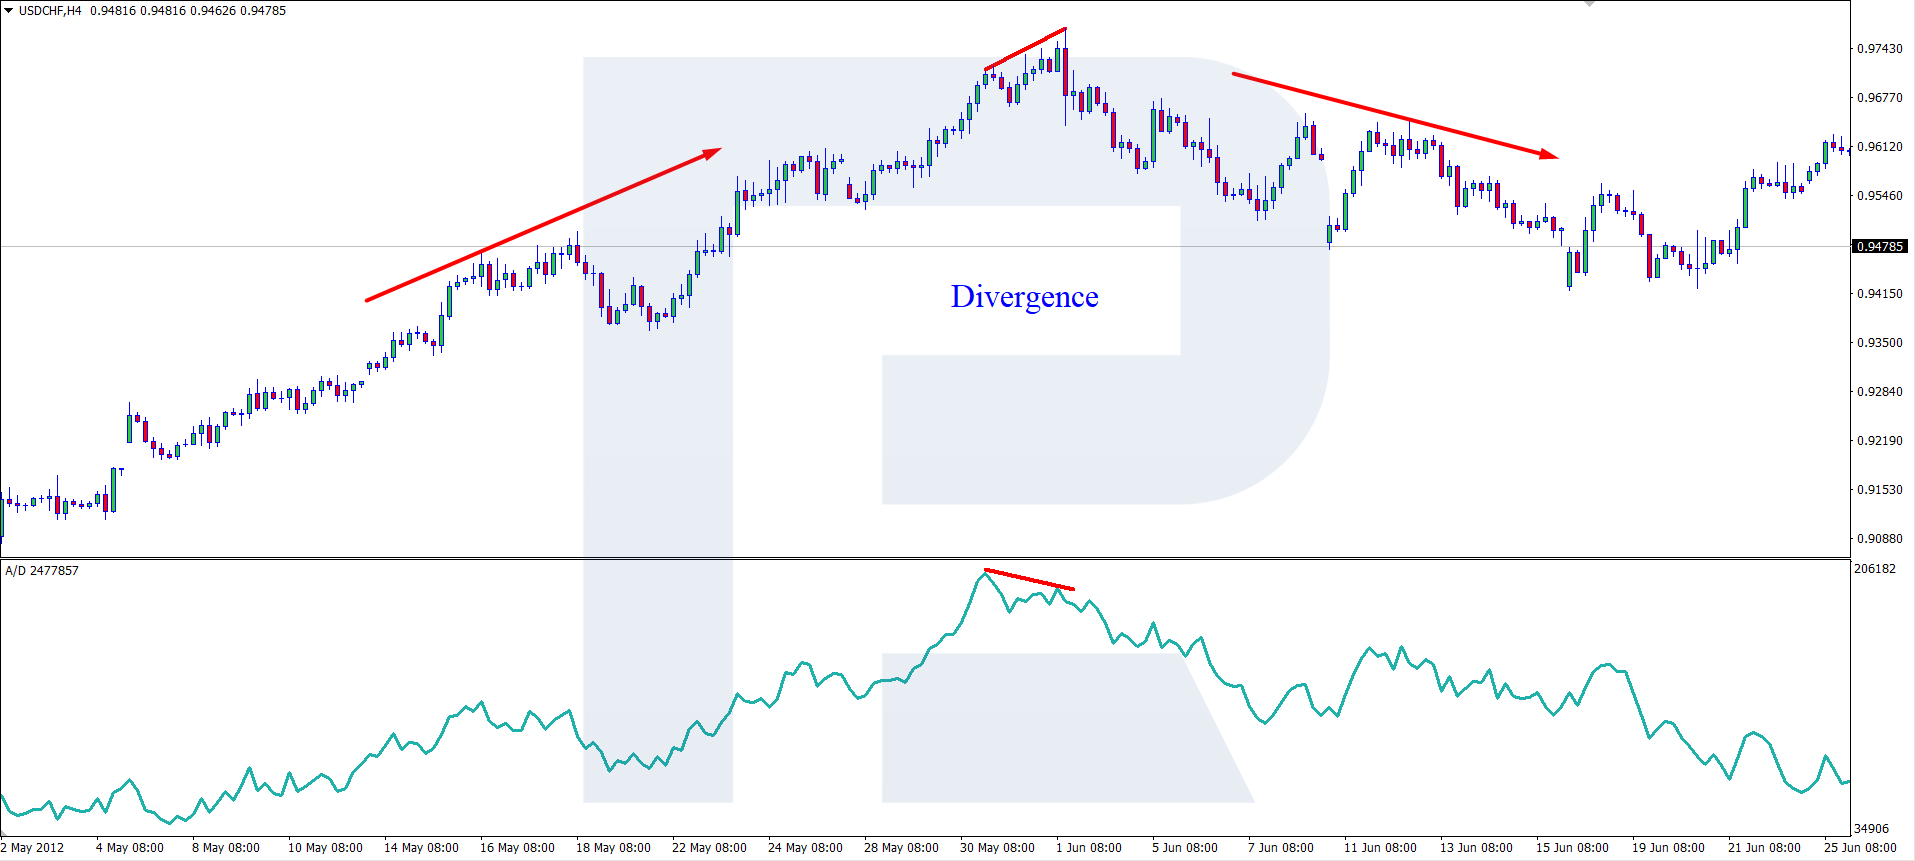
A divergence is easy to detect: on the chart, there will appear two peaks, the first one will be a bit lower than the second one; the indicator line will also form two peaks but the first one will be a bit higher than the second one. This is a divergence.
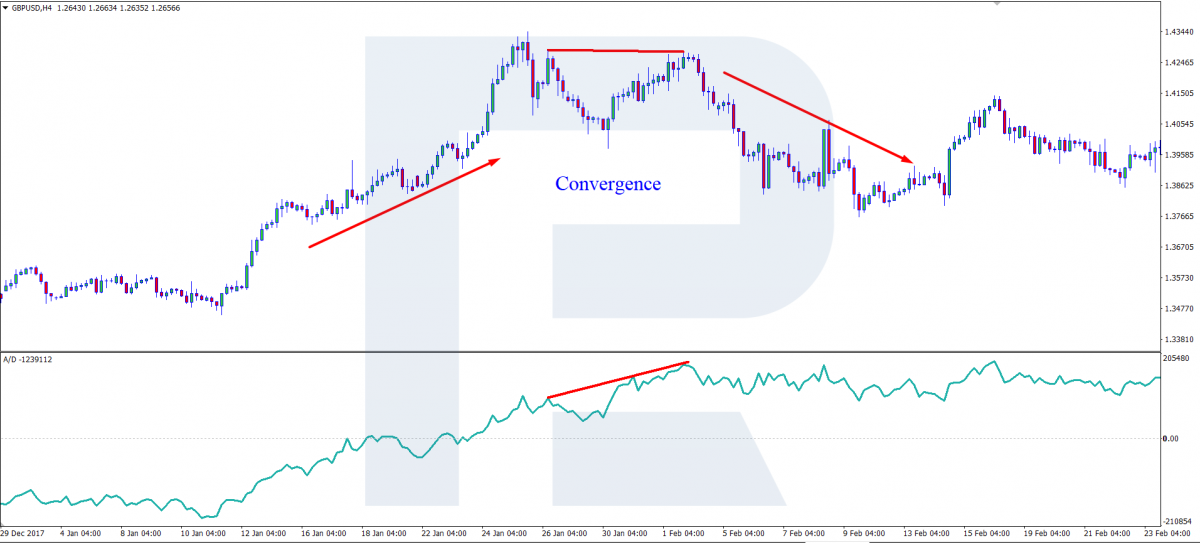
A convergence is based on the same principle but looks somewhat different. On the chart, the first peak is a bit higher than the second one, while on the indicator, The first peak is lower than the second one. If you draw two lines through the peaks on the price chart and the indicator, respectively, they will not be parallel. In the case of a divergence, they will diverge:
In the case of a convergence, they will converge:
Tech analysis patterns
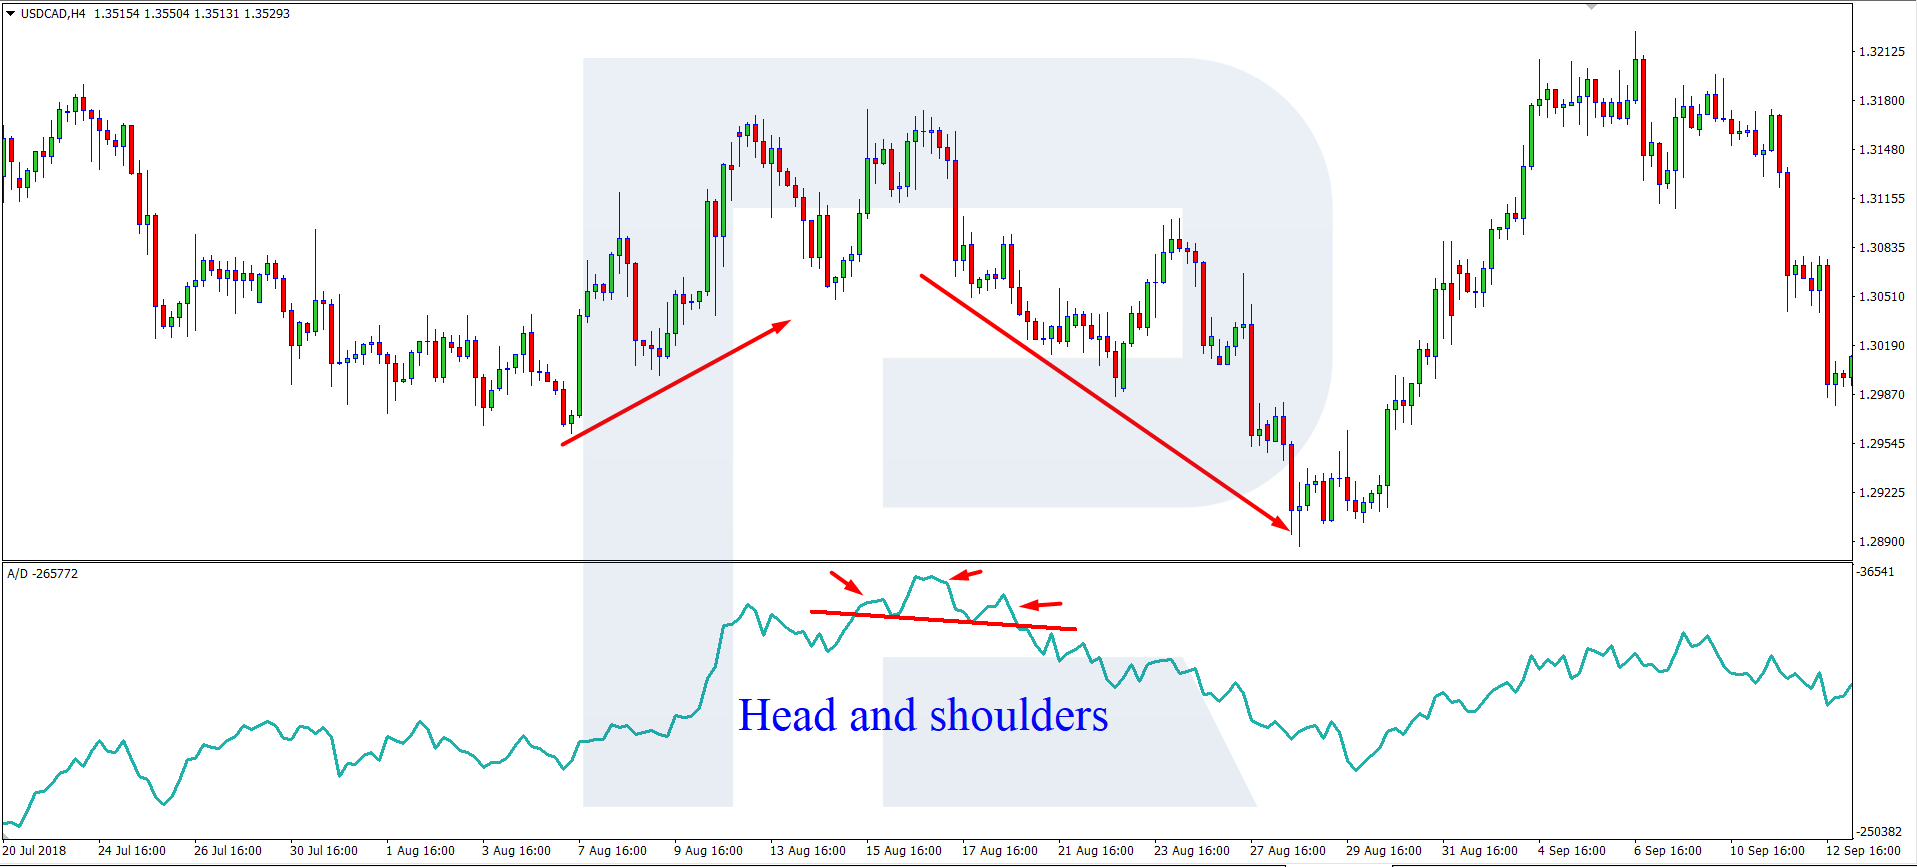
It is no harder to find tech analysis patterns on the indicator than on the price chart; the only difference is that the indicator looks like a line. Normally, you can find reversal patterns forming at the top or bottom of the trend. However, they may look quite different from what is written in the books on graphic analysis, being rather conditional.
Reversal patterns would be:
It is quite difficult to find on the indicator such patterns of trend continuation as Flag or Pennant, so skip them.
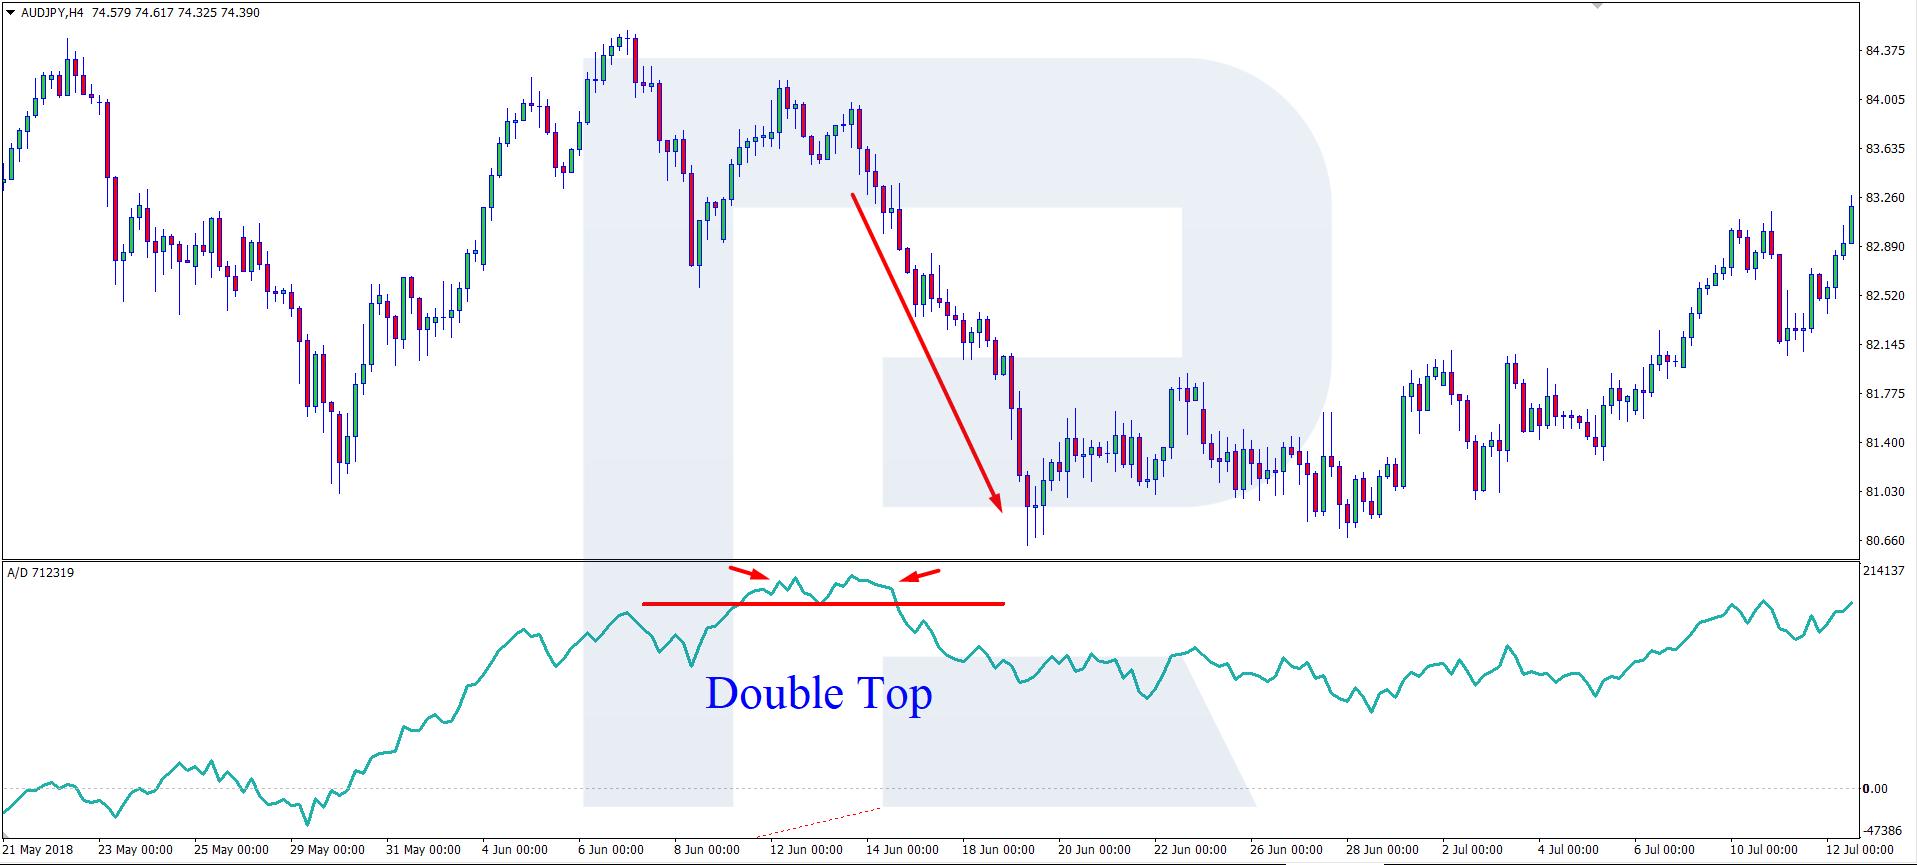
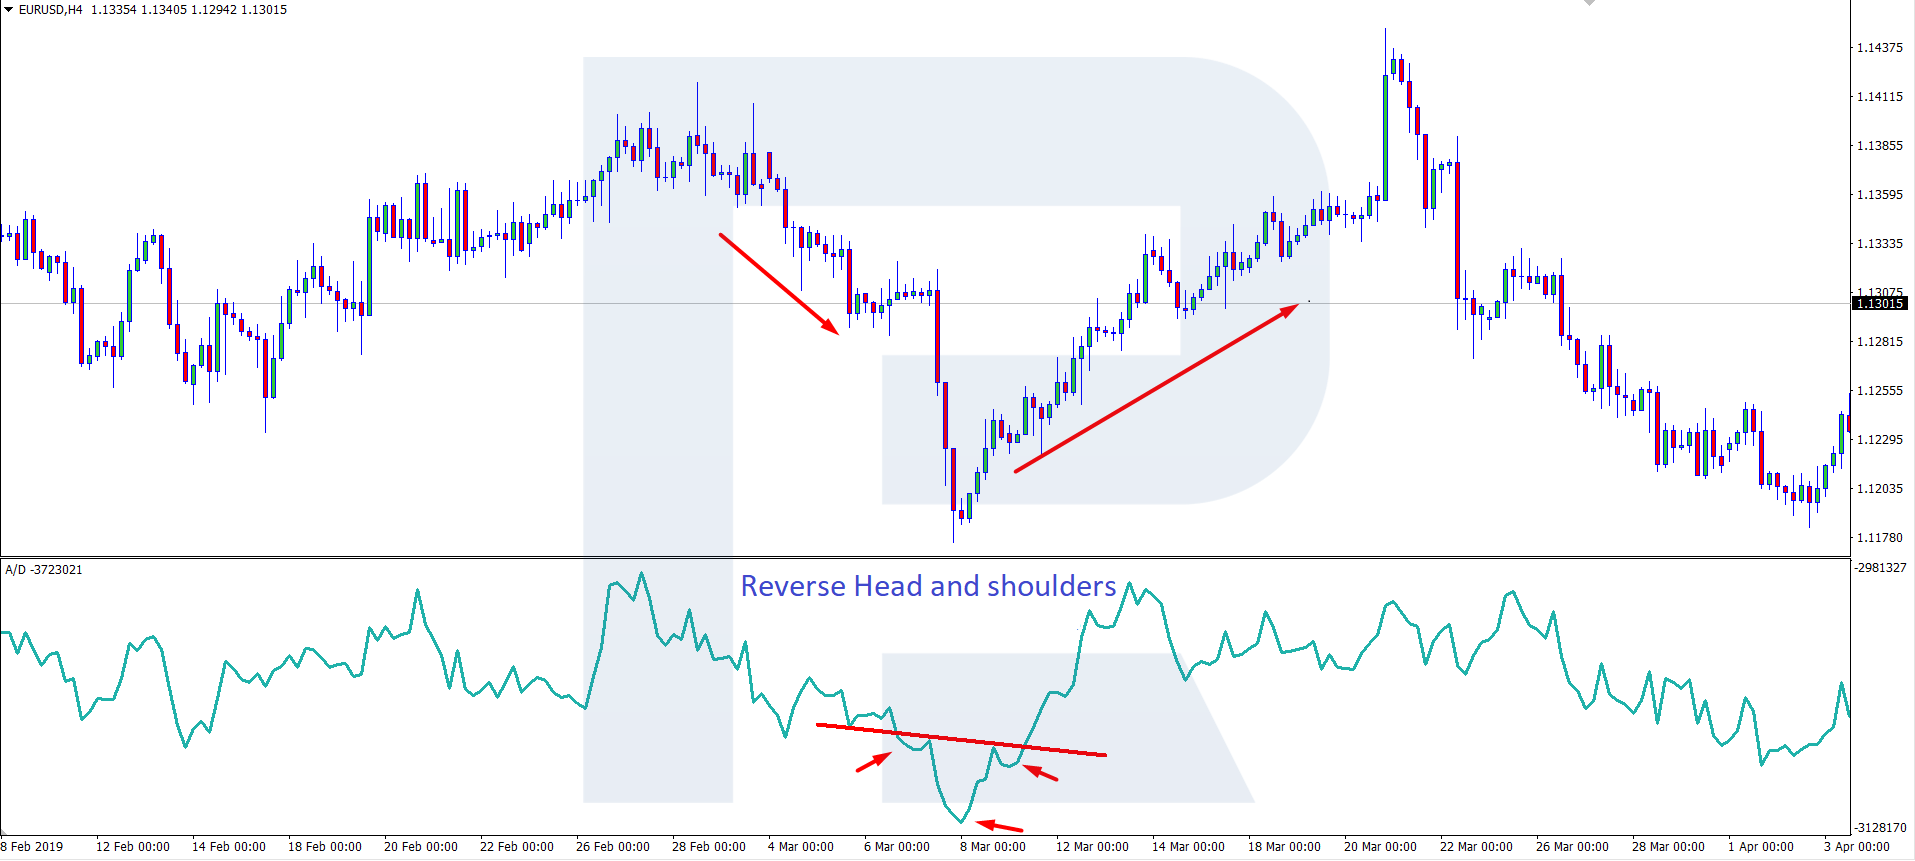
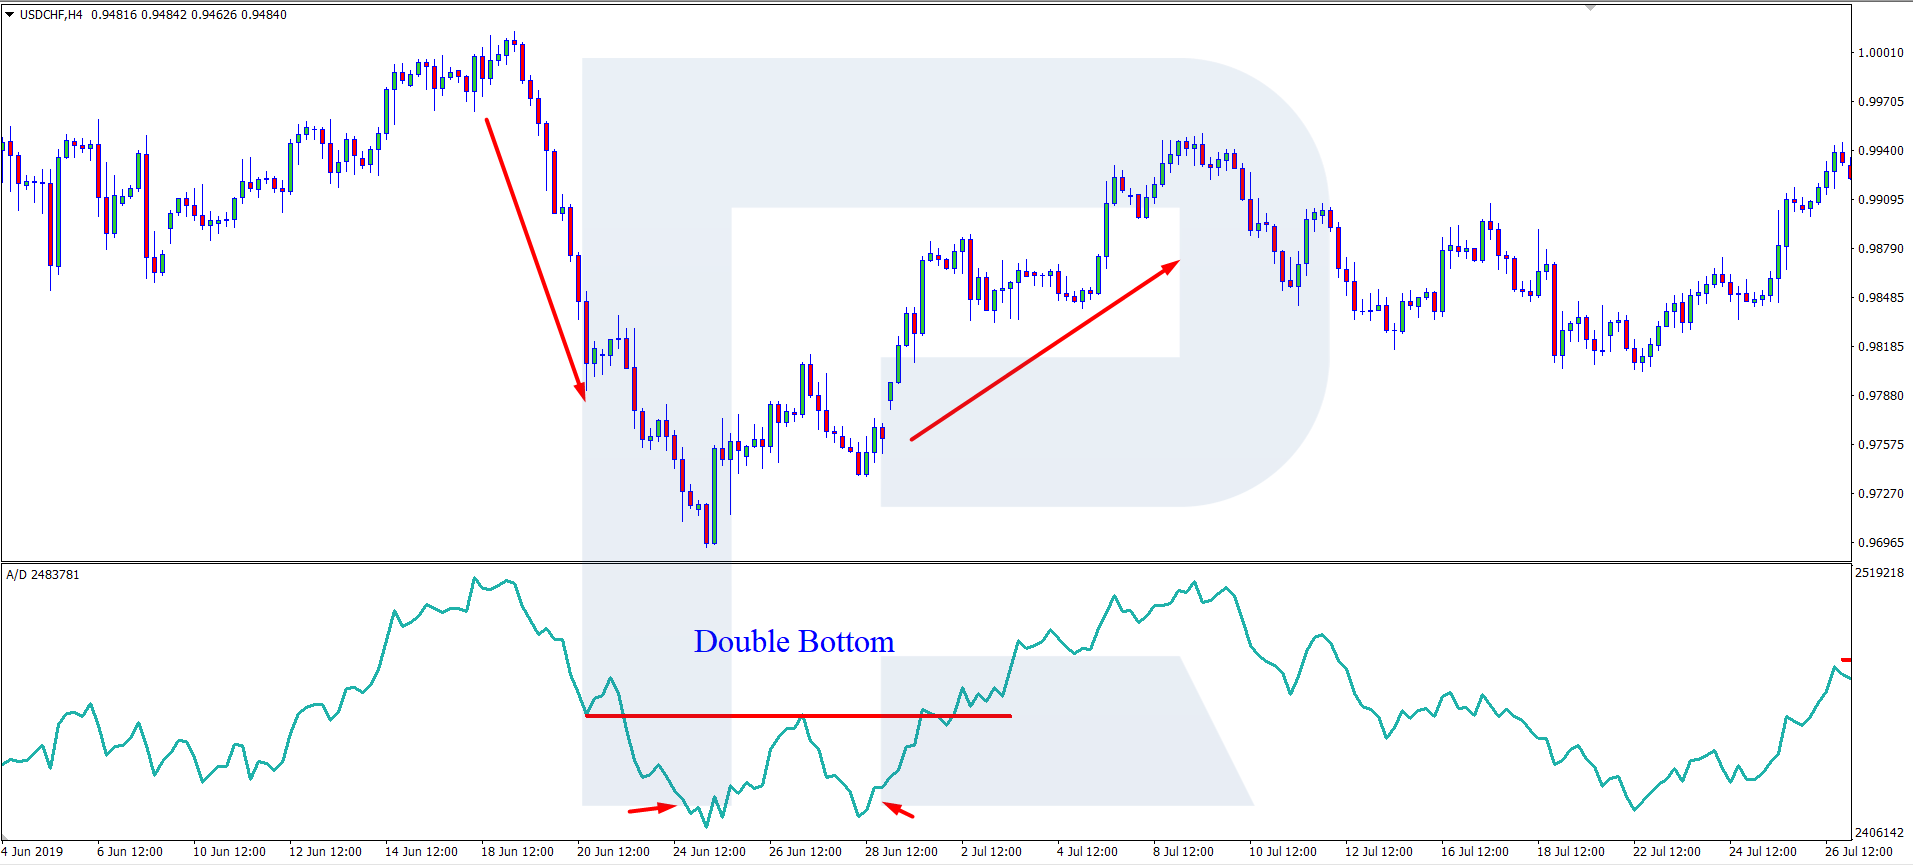
In the pictures below, find the mentioned patterns. If you look closely at the chart, you will notice that a pattern on the indicator is not always repeated on the Japanese candlestick or bar chart.
Head and Shoulders
Double Top
Reverse Head and Shoulders
Double Bottom
Defining trend direction
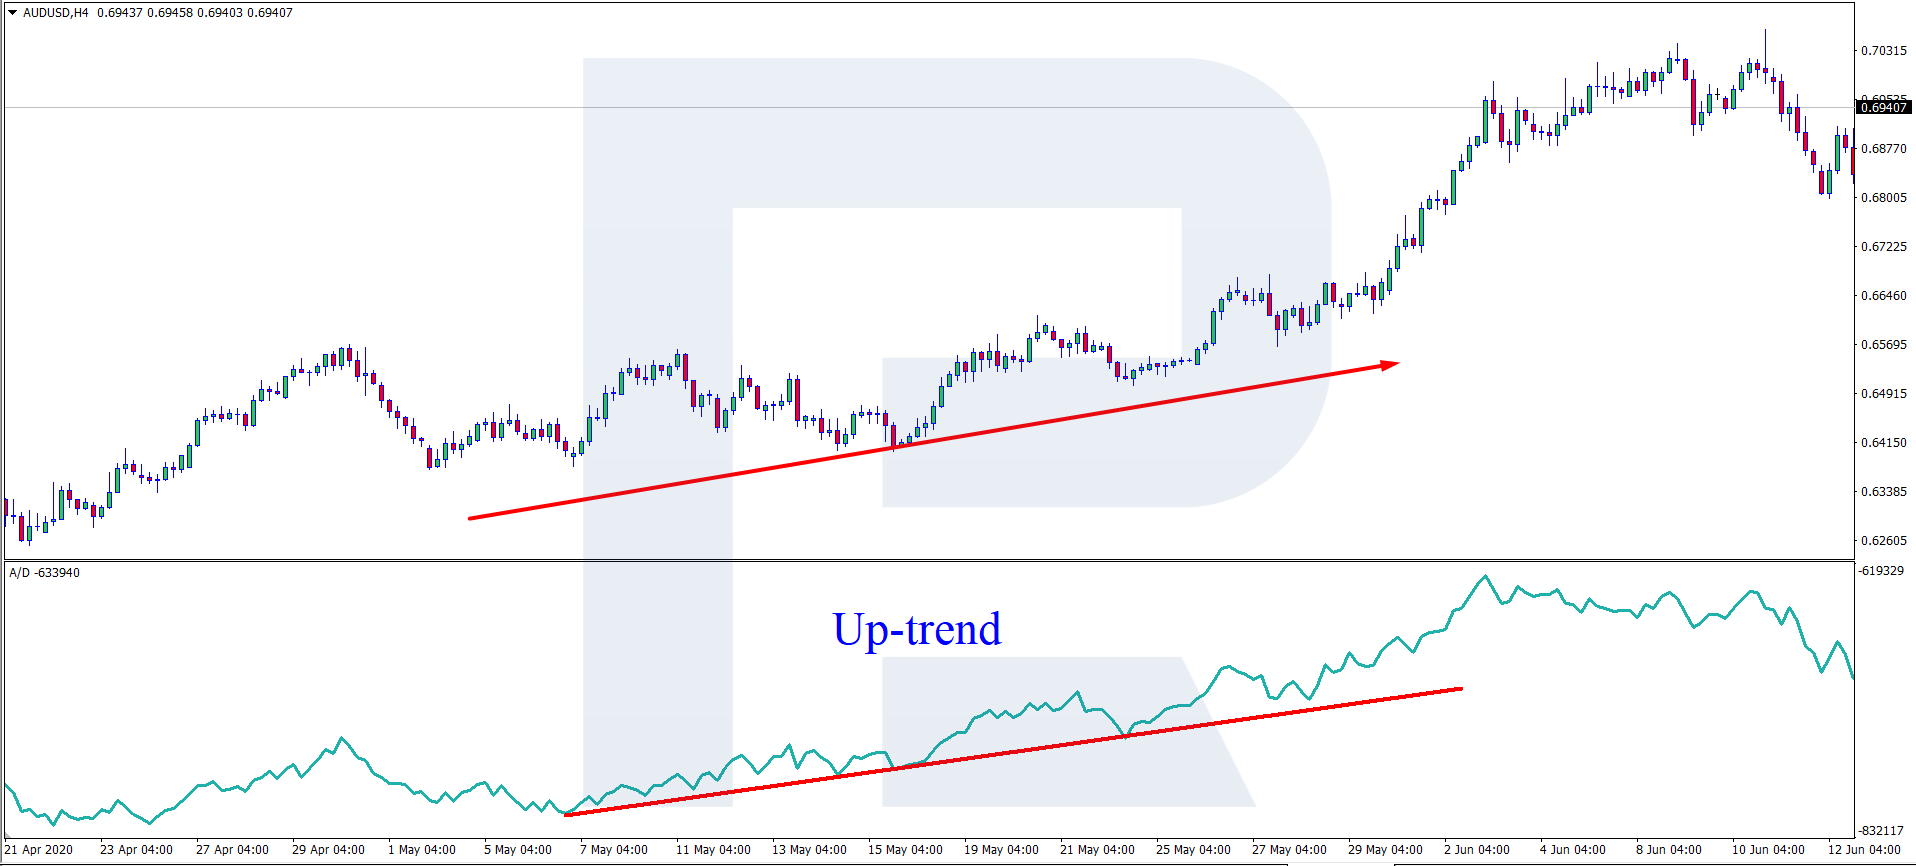
This signal is much easier to deal with compared to the previous ones. The market keeps moving, no matter in an uptrend, downtrend, or a flat. You can define trend direction by the indicator as follows:
If after a flat the indicator keeps renewing the highs, the trend is ascending:
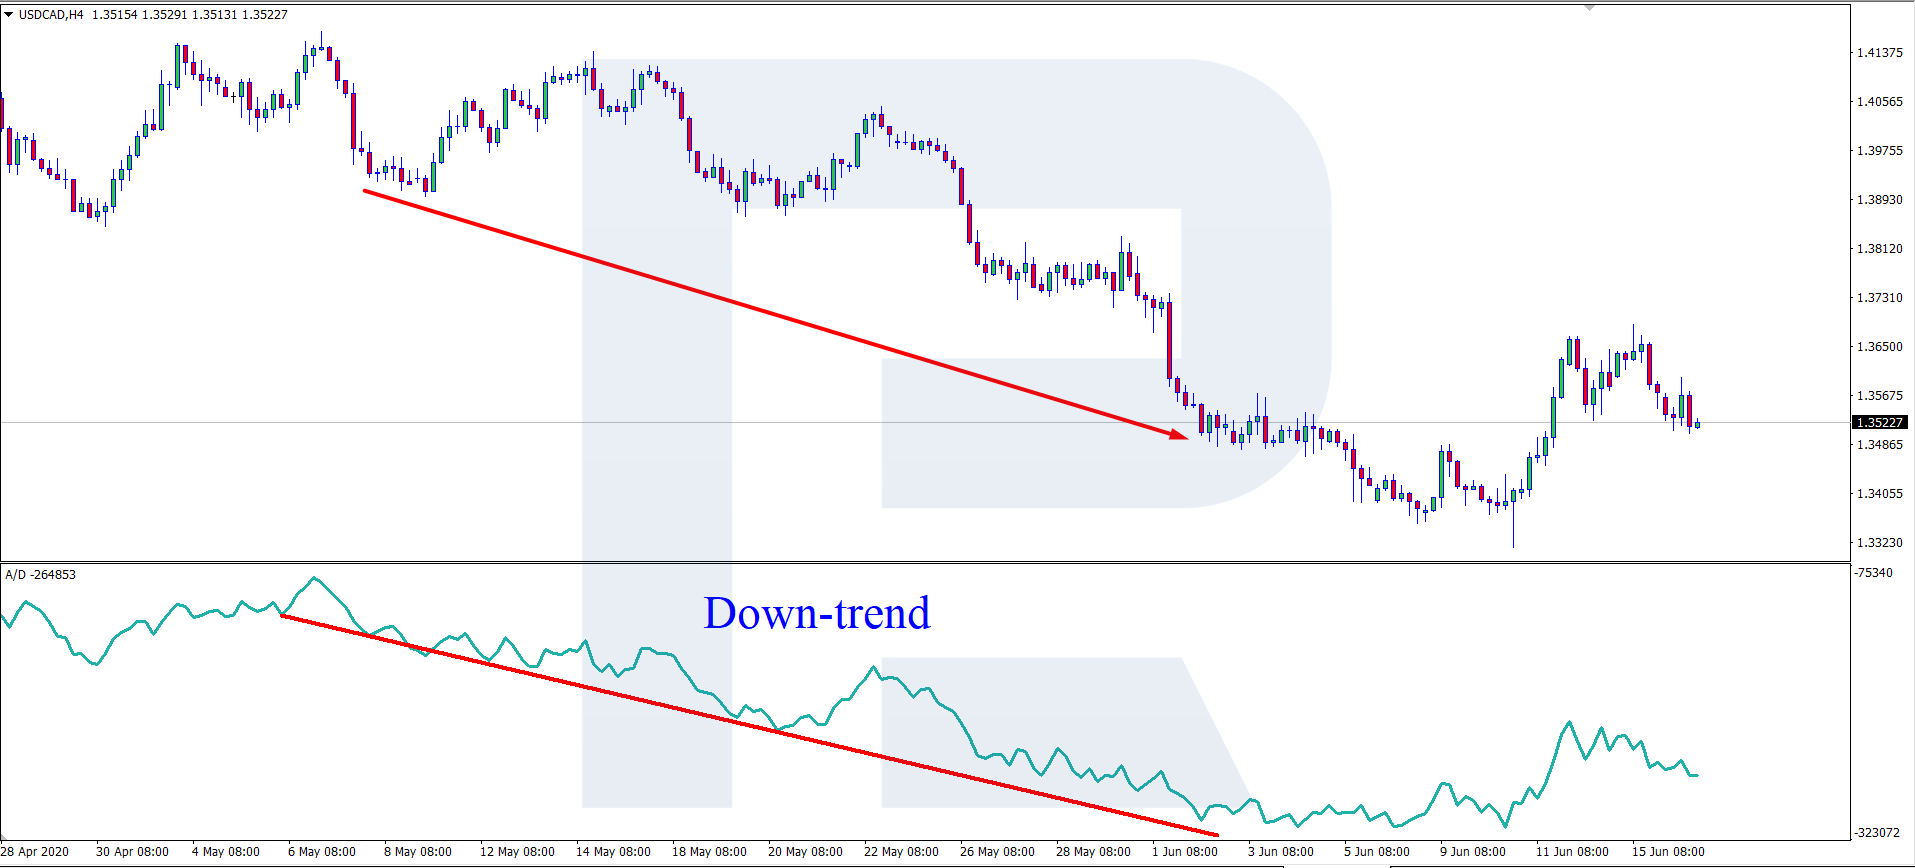
If after a flat the indicator keeps renewing the lows, the trend is descending:
Summary
Regardless of its simplicity, this indicator has its drawbacks. The main one, to my mind, is its ignorance of the price gap: after a gap, the indicator gives imprecise signals for a certain time.
Another drawback of Accumulation/Distribution is the similarity of the price and indicator lines. This hinders finding convergences/divergences. However, these minor drawbacks may be compensated for by using Accumulation/Distribution alongside other strategies and indicators.