Tech Analysis: How to Trade Diamond Pattern?

4 minutes for reading
In this review, we will get acquainted with trading the Diamond. This is a reversal tech analysis pattern promising a correction or a reversal of the current trend.
How does a Diamond pattern form?
The Diamond is a quite rare reversal pattern, which you do not often come across on charts – perhaps this is another reason why it is called like a precious stone. The pattern forms at the highs/lows after the preceding up- or downtrend.
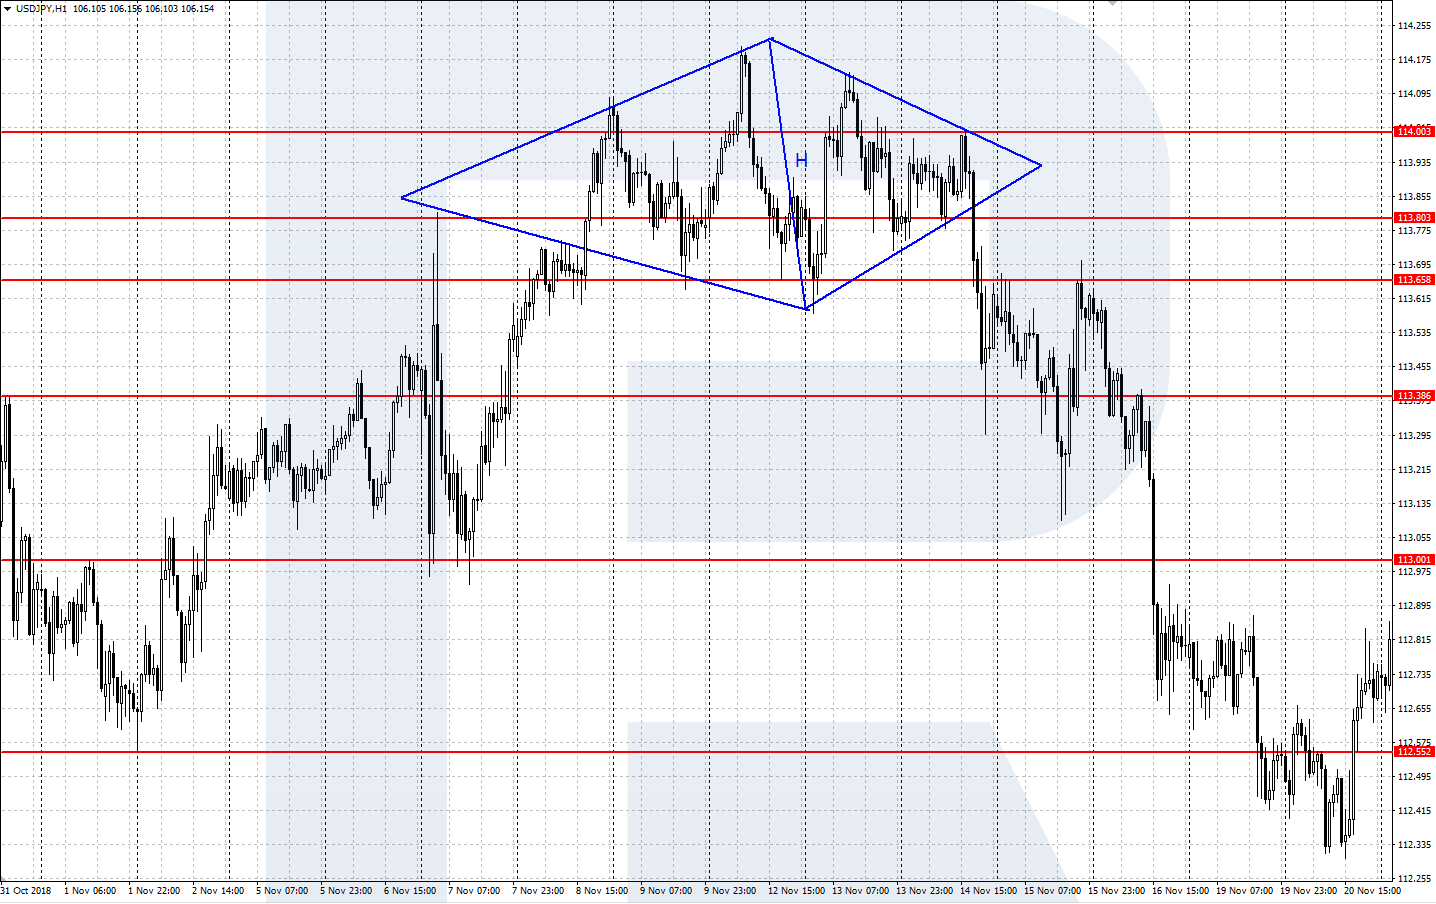
What does the pattern look like? We can say that on the chart after an impulse ends, the price consolidates, and two triangles sharing one base form. First, a diverging triangle appears, then a converging one follows suit (symmetrically). Together they form a pattern that looks like a rhombus, or diamond.
Ideally, the pattern looks like a clear symmetrical diamond shape. But let us remain realistic: even real diamonds have flaws, scratches, and cloudy spots. With the Diamond pattern, it is the same: in real market conditions, its borders may be quite asymmetrical, a bit shifted or extended.
The most important thing here is for the pattern to remain at the extremes and within the borders of two adjacent triangles, be they imperfect. If you have any doubts with a Diamond on a normal chart, try switching to the linear version: it will show the borders of the pattern more precisely.
Choosing a timeframe for trading
A Diamond may form on any timeframe, even the smallest one. For trading intraday, you may use M5, M15, or H1. However, keep in mind that they are considered less reliable than larger timeframes.
The larger the timeframe, the more probable it is that the pattern will be worked off. The main timeframes for trading this pattern are: H4, D1, and W. Naturally, on larger timeframes, the pattern takes rather long to form but promises more significant realization. As soon as the pattern is complete, you may start trading.
How to trade Diamond patterns?
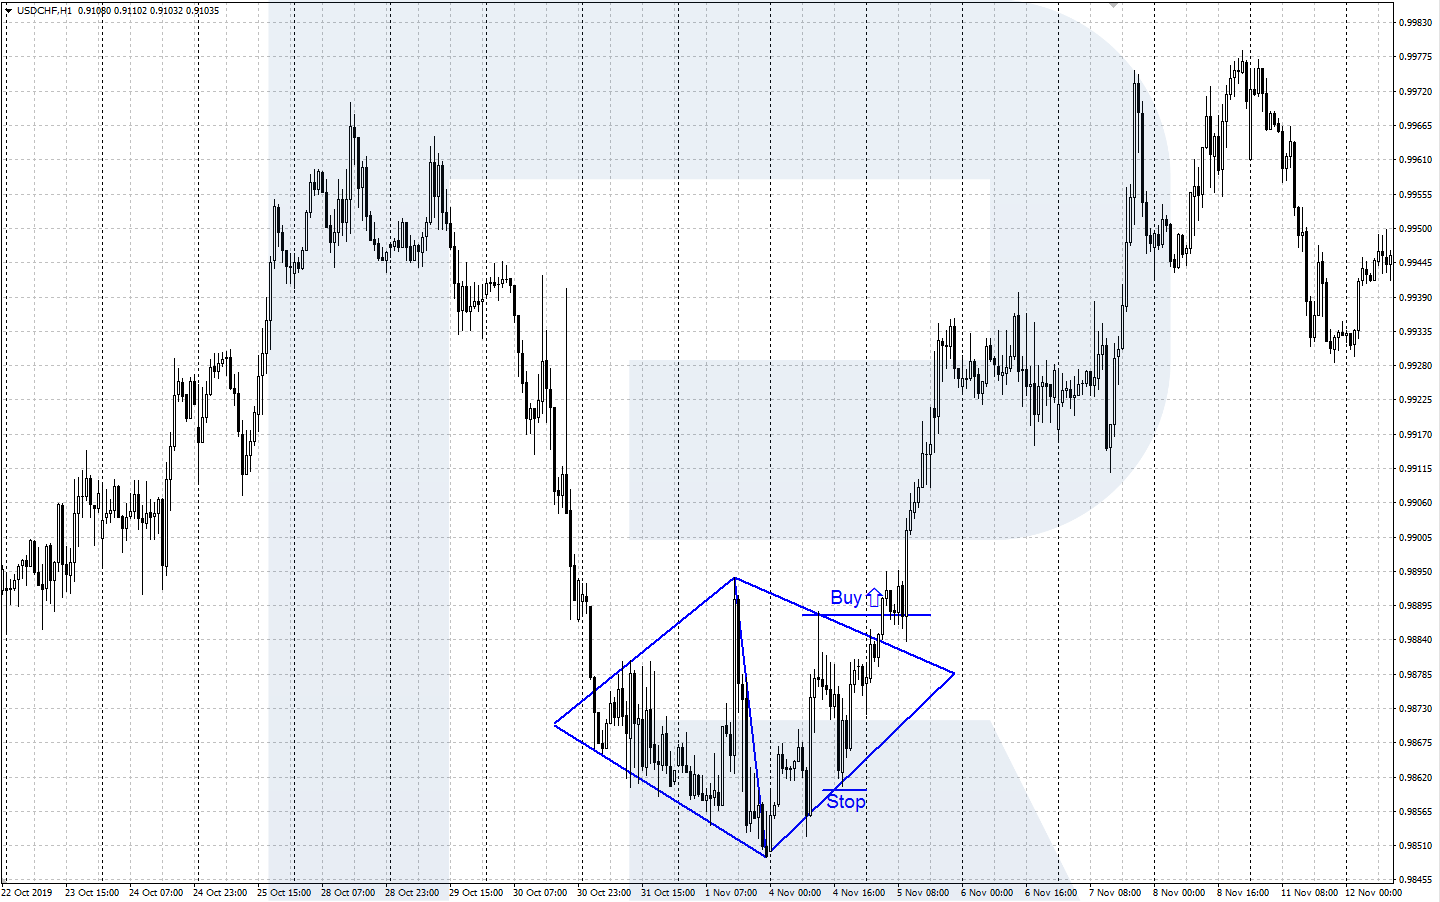
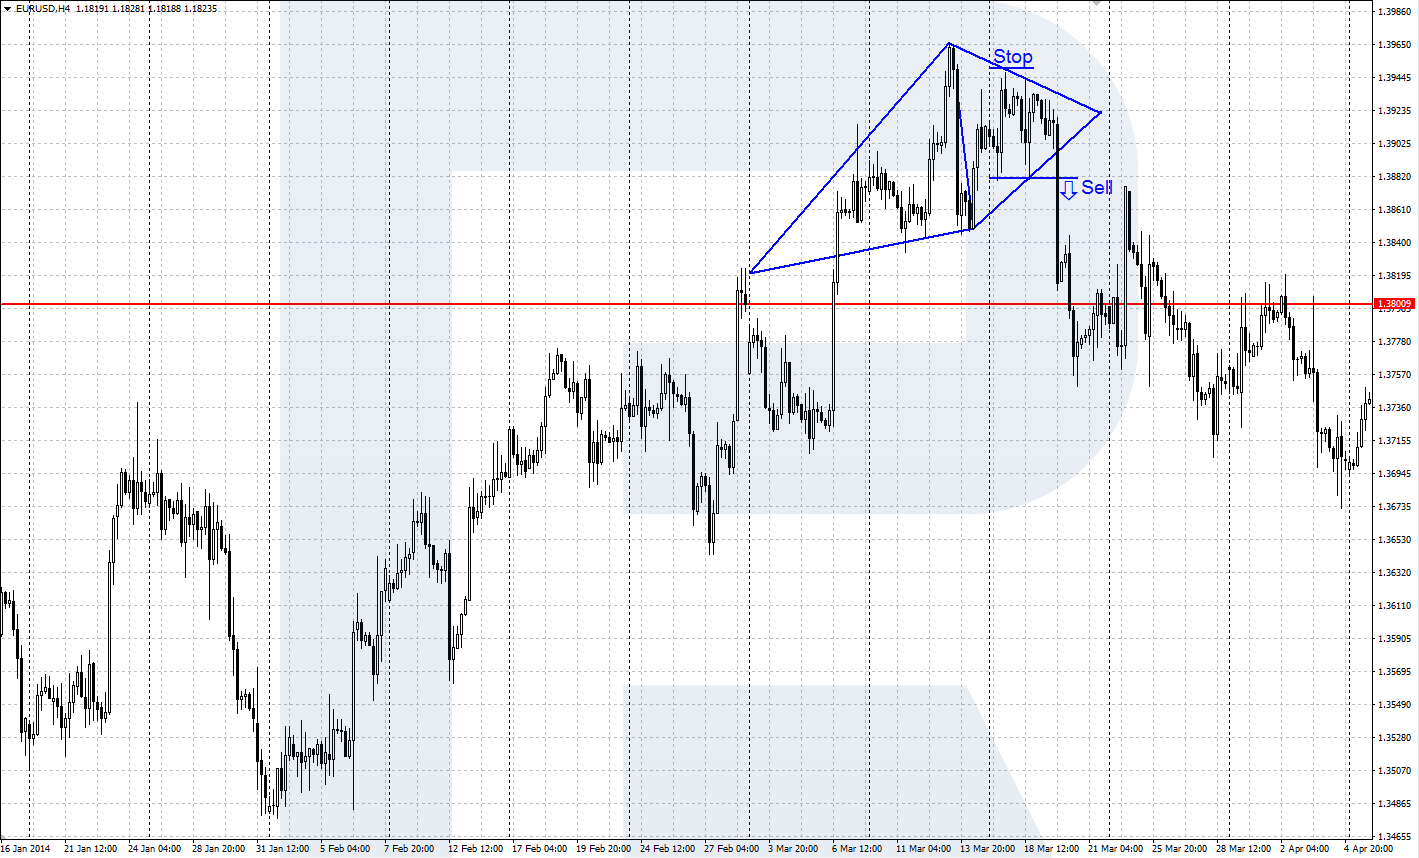
To trade the pattern, you need it to be complete; I advise you against trading inside a Diamond. If the Diamond formed on the highs, this means the uptrend is over, so you may sell. Conversely, if the pattern forms at the lows, after a downtrend, you may expect an upward reversal and get prepared for buys.
Entering a buy
- After a downtrend, a Diamond pattern forms at the lows of the chart.
- The price breaks through the upper border of the pattern; the candlestick fully or for the most part closes above it.
- Open a buying position at the growth of the local high nearest to the breakaway inside the Diamond.
- Place a Stop Loss behind the opposite local low.
- The main landmark for closing with a Profit is the height (H) of the pattern in points. Alternatively, close your position when the price reaches a strong resistance level or some signs of a reversal emerge.
Entering a sale
- After an uptrend, a Diamond pattern forms at the highs of the chart.
- The price breaks through the lower border of the pattern; the candlestick fully or for the most part closes below it.
- Open a selling position when the price goes below the local low, nearest to the breakaway inside the Diamond.
- Place a Stop Loss behind the opposite local high.
- The main landmark for closing with a Profit is the height (H) of the pattern in points. Alternatively, close your position when the price reaches a strong support level or some signs of a reversal upwards emerge.
Bottom line
The Diamond is a reversal tech analysis pattern, which can rarely be seen on the chart. Sometimes it emerges on smaller timeframes but is mainly used on H4, D1, and W. The correct use of the Diamond may bring the trader additional profit.


