How to Forecast Economic Crises?

8 minutes for reading
The history of market development and the world’s economy shows that when it comes to an economic crisis, it never comes alone: one crisis will definitely be followed by another one, quite different from its predecessor.
Analysts and politicians agree that this is a serious problem threatening all the countries of the world. Financial crises are so harmful because people rely on the work of financial institutions every day. Banks give loans and credit cards so that their clients could afford more and buy things with maximal comfort, while insurance companies protect homes and cars from accidents and stealth – but in crises, all these processes get paralyzed and fall apart like a house of cards, pulling along stock markets.
In this article, I will speculate on the bright economic crises of the past and try to formulate the signs of an economic crisis that might happen in the future.
The economic crisis of 2008
After another economic crisis is over, its aftermath remains on the surface for decades. Over history, economic expenses of any crisis reach 80% of the GDP; some equal this to 25,000 USD per citizen of a country.
If you look closely at the economic crisis of 2008, which is lawfully called one of the gravest ones in history, you will see that companies of the financial sector got shut down while others turned out so damaged that private business failed to get enough financing for survival in such hard circumstances. Economists call this the deepest economic slump since World War II.
In the end, such a decline of the economic system made the income and wages of the population fall significantly, the number of workplaces decrease, as well as made crediting inaccessible.
Why do economic crises happen?
In the market, you constantly see the dollar fall, or oil prices fall, and all this due to economic trouble in certain countries. There are plenty of reasons for another collapse to happen, and some of them seem absolutely absurd.
One frequently raised example is the “tulip-mania” that happened in the Netherlands in 1636. While the price of bulbs kept growing, people spent all their savings on those bulbs. At some point, the price stopped growing and began an aggressive decline, which led to unbelievable losses and a general slow-down of the development of the country’s economy.
The crisis of 2020, also called “the pandemic crisis”, was provoked by the emergence of the new coronavirus disease. Economic activity shrank all over the globe, unemployment sky-rocketed, while the earnings of people fell to record levels.
In the first case, you see an example of the so-called “crowd effect” when private investors become euphoric about something, invest massively in this, and inflate a bubble that later bursts and harms the economy of the whole country. This is a good illustration of the saying: “When a shoe shiner starts buying stocks, it is time to leave the market”.
In the second case, a very random reason made economies all over the world collapse, so that oil futures dropped below zero, which is a record decline in the history of the asset.
13 years after the collapse of Lehman Brothers, the global economic and financial system became stabler and safer. As you see, the growth of the stock market in March 2020 became the speediest in history. Traders enjoy buying in a deep correction, while the pandemic made unemployed people look for new sources of income. Banks and governments made decisions in the fight against the virus and crisis maximally fast.
However, there have already appeared new threats to financial stability, and they will keep emerging as long as the world’s economy keeps developing. Technologies have an unbelievable influence on financial services; banks and governments must track the influence of new types of assets and financial technologies on the world’s economy.
Today, more and more people get access to financial markets, and they are ready to risk to make maximal profits. These investors unite in groups and can manipulate prices aggressively; you remember the situation around GameStop when a group of private investors managed to oppose a whole hedge fund. Such actions can provoke another “tulip-mania”.
How to forecast an economic crisis?
There are several ways of making such forecasts, and some of them are already in our blog.
Time cycles
A collapse of the stock market and impressive growth of the USD happen every decade. After the Dow Jones index collapsed in 2008, a similar crash happened at the beginning of 2020.
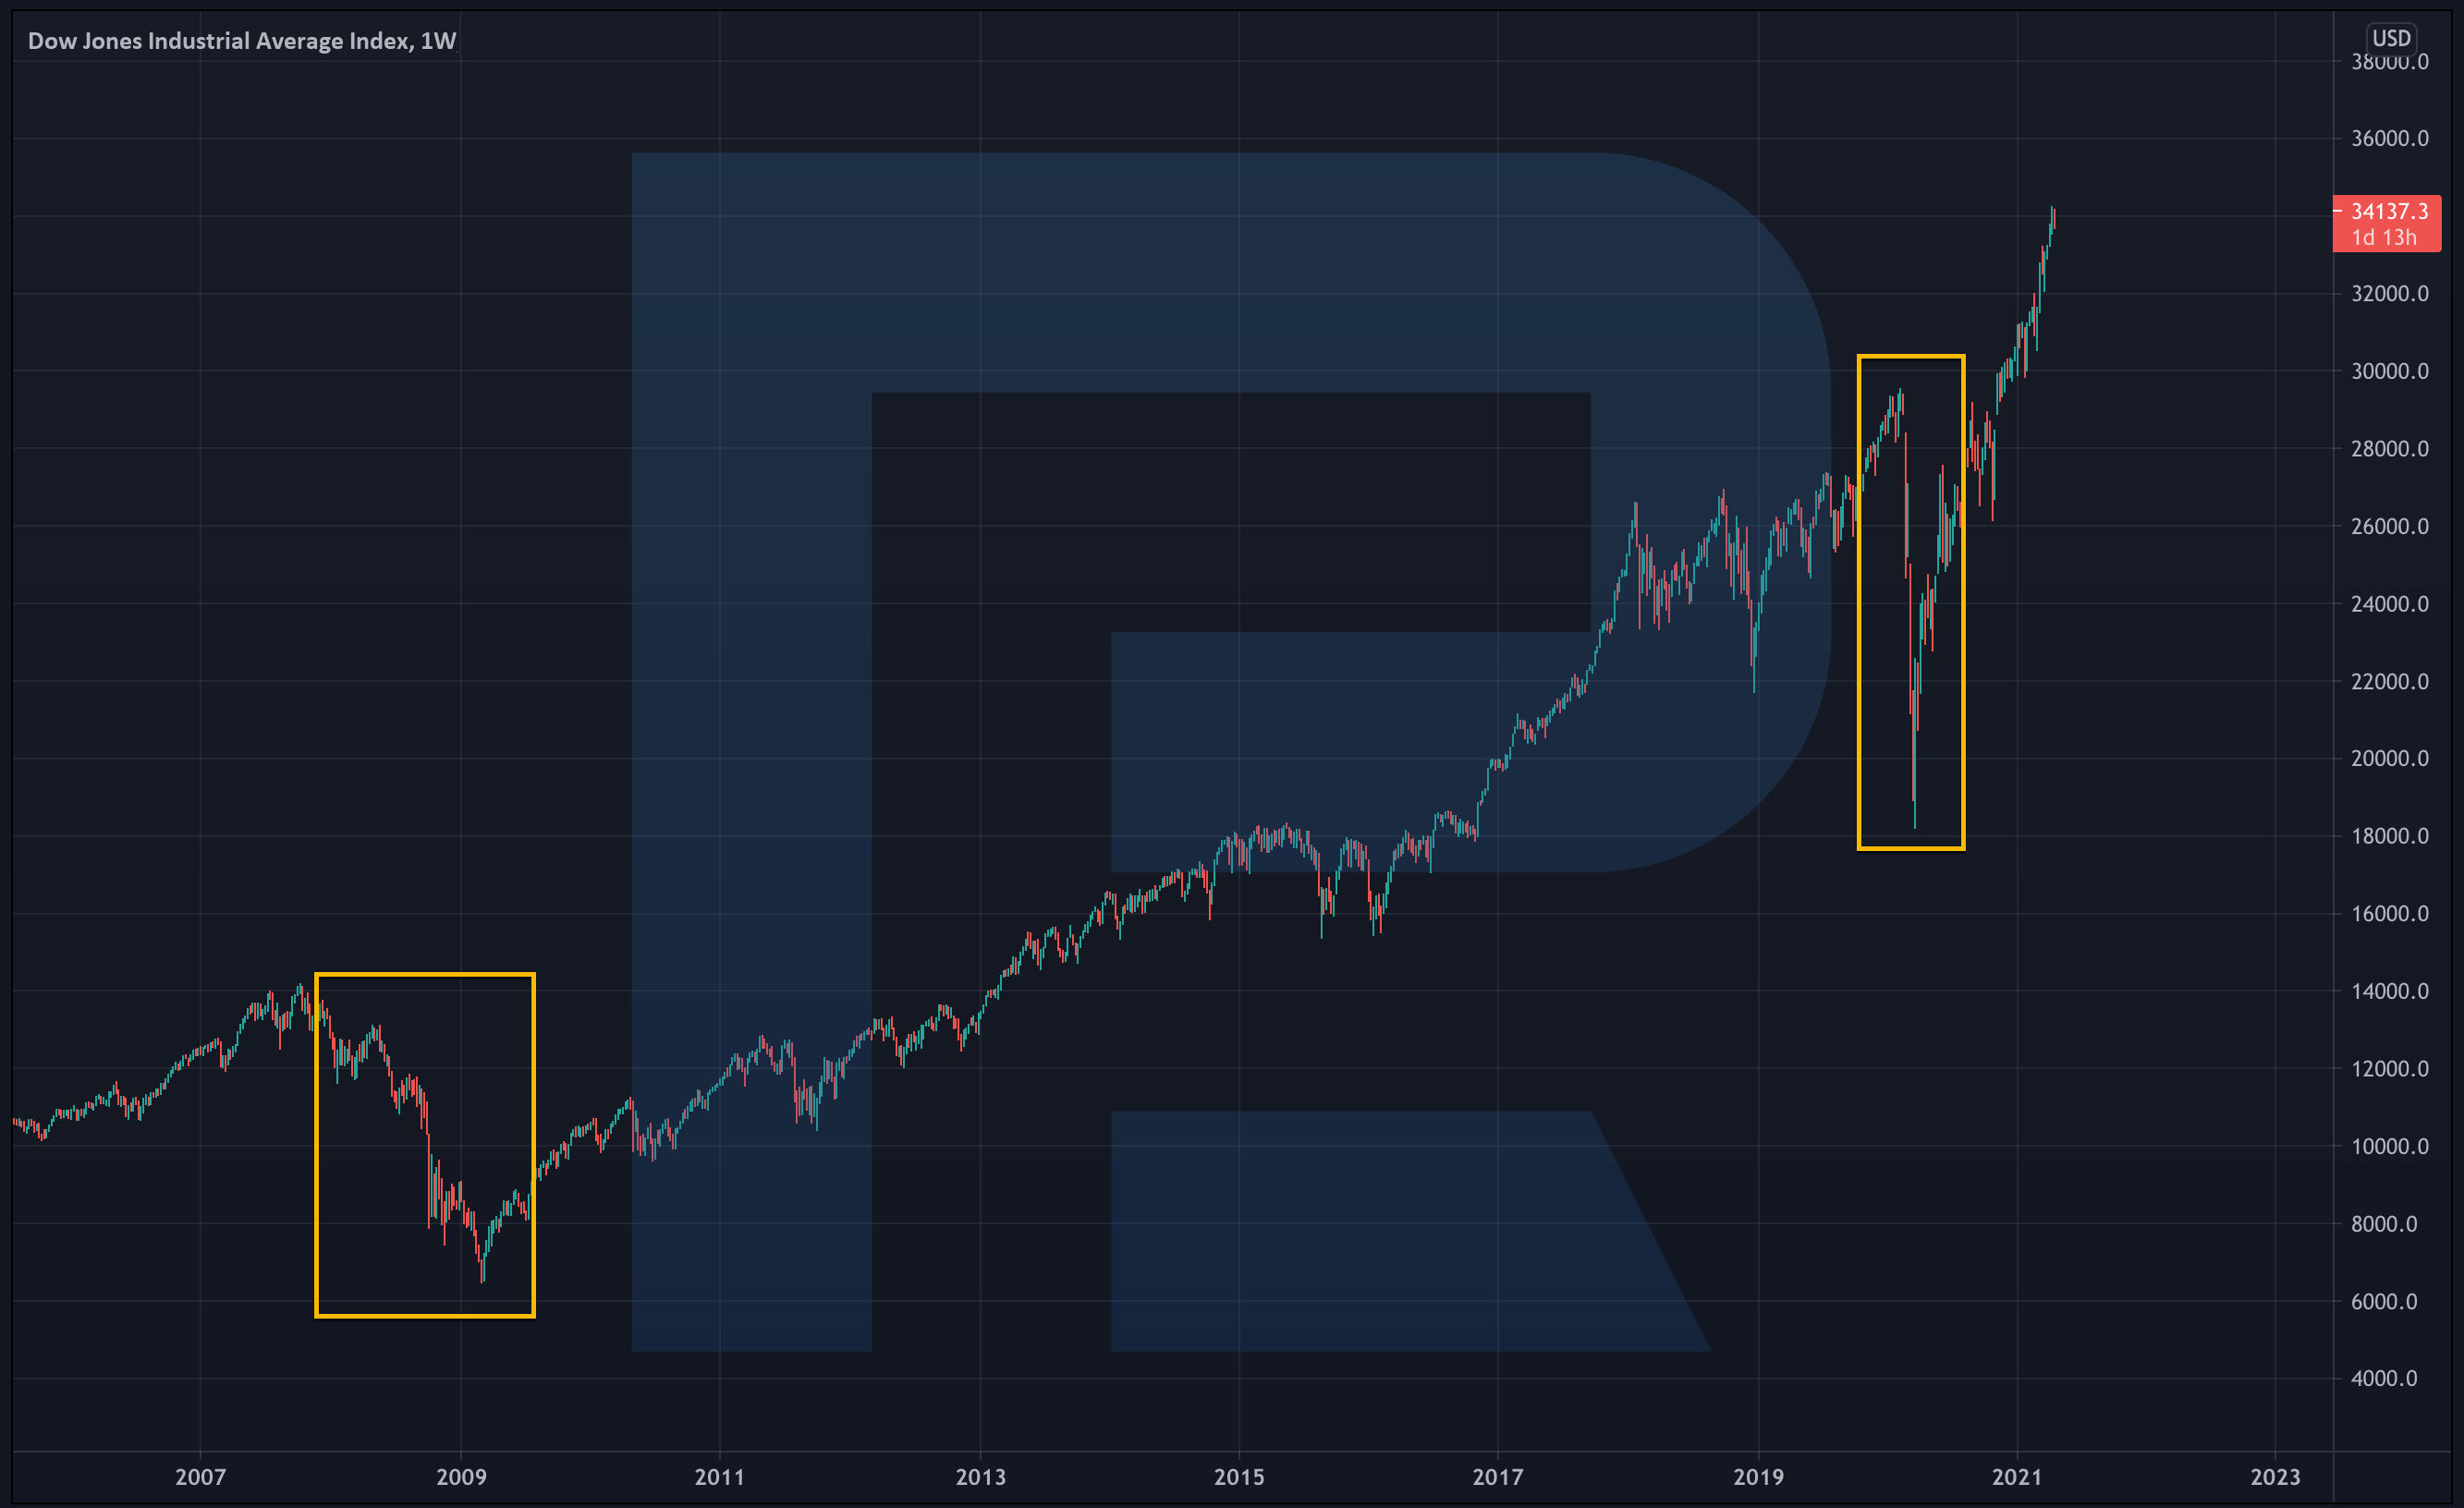
Hence, you can calculate the date of the next economic crisis with a minor time lag. Based on this version, we should expect the next major crisis somewhere between 2028 and 2030, while the present growth of the stock market must be just speeding up.
The Leading Economic Index (LEI)
Composite economic indices signal about peaks and bottoms of business cycles. They are made to generalize and detect major trends and reversals of economic processes and thus might help detect a forming crisis. This index includes such indicators as the average length of the working week, new producers’ orders; also, it evaluates the behavior of stocks, building permits, average consumer expectations from the business environment, the spread of the interest rate, and more.
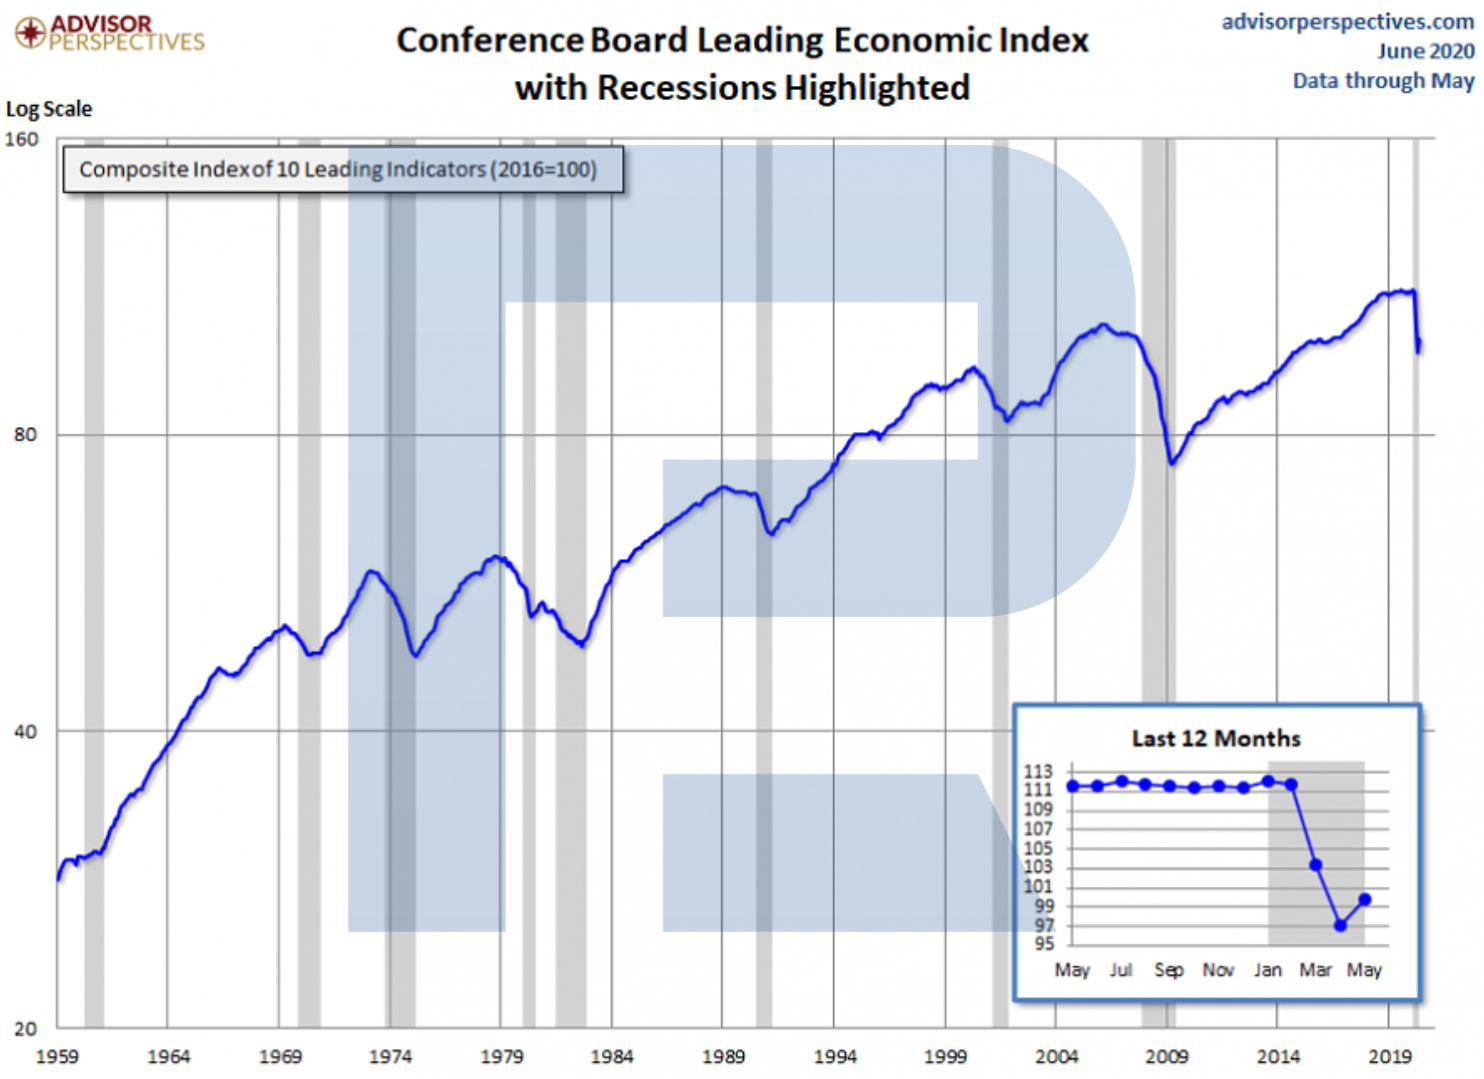
Some say that this indicator has been able to forecast almost all the recent economic crises in the USA. However, there have been false signals: the index can forecast a crisis in several months when growth changes for a decline.
The Fear&Greed Index (VIX)
This is what we call the real-time volatility index created by the CBOE. It is calculated based on the price of S&P 500 options and reflects volatility expectations. If the VIX is growing, the S&P 500 is very likely to fall, and if it is declining, the parent index will probably grow.
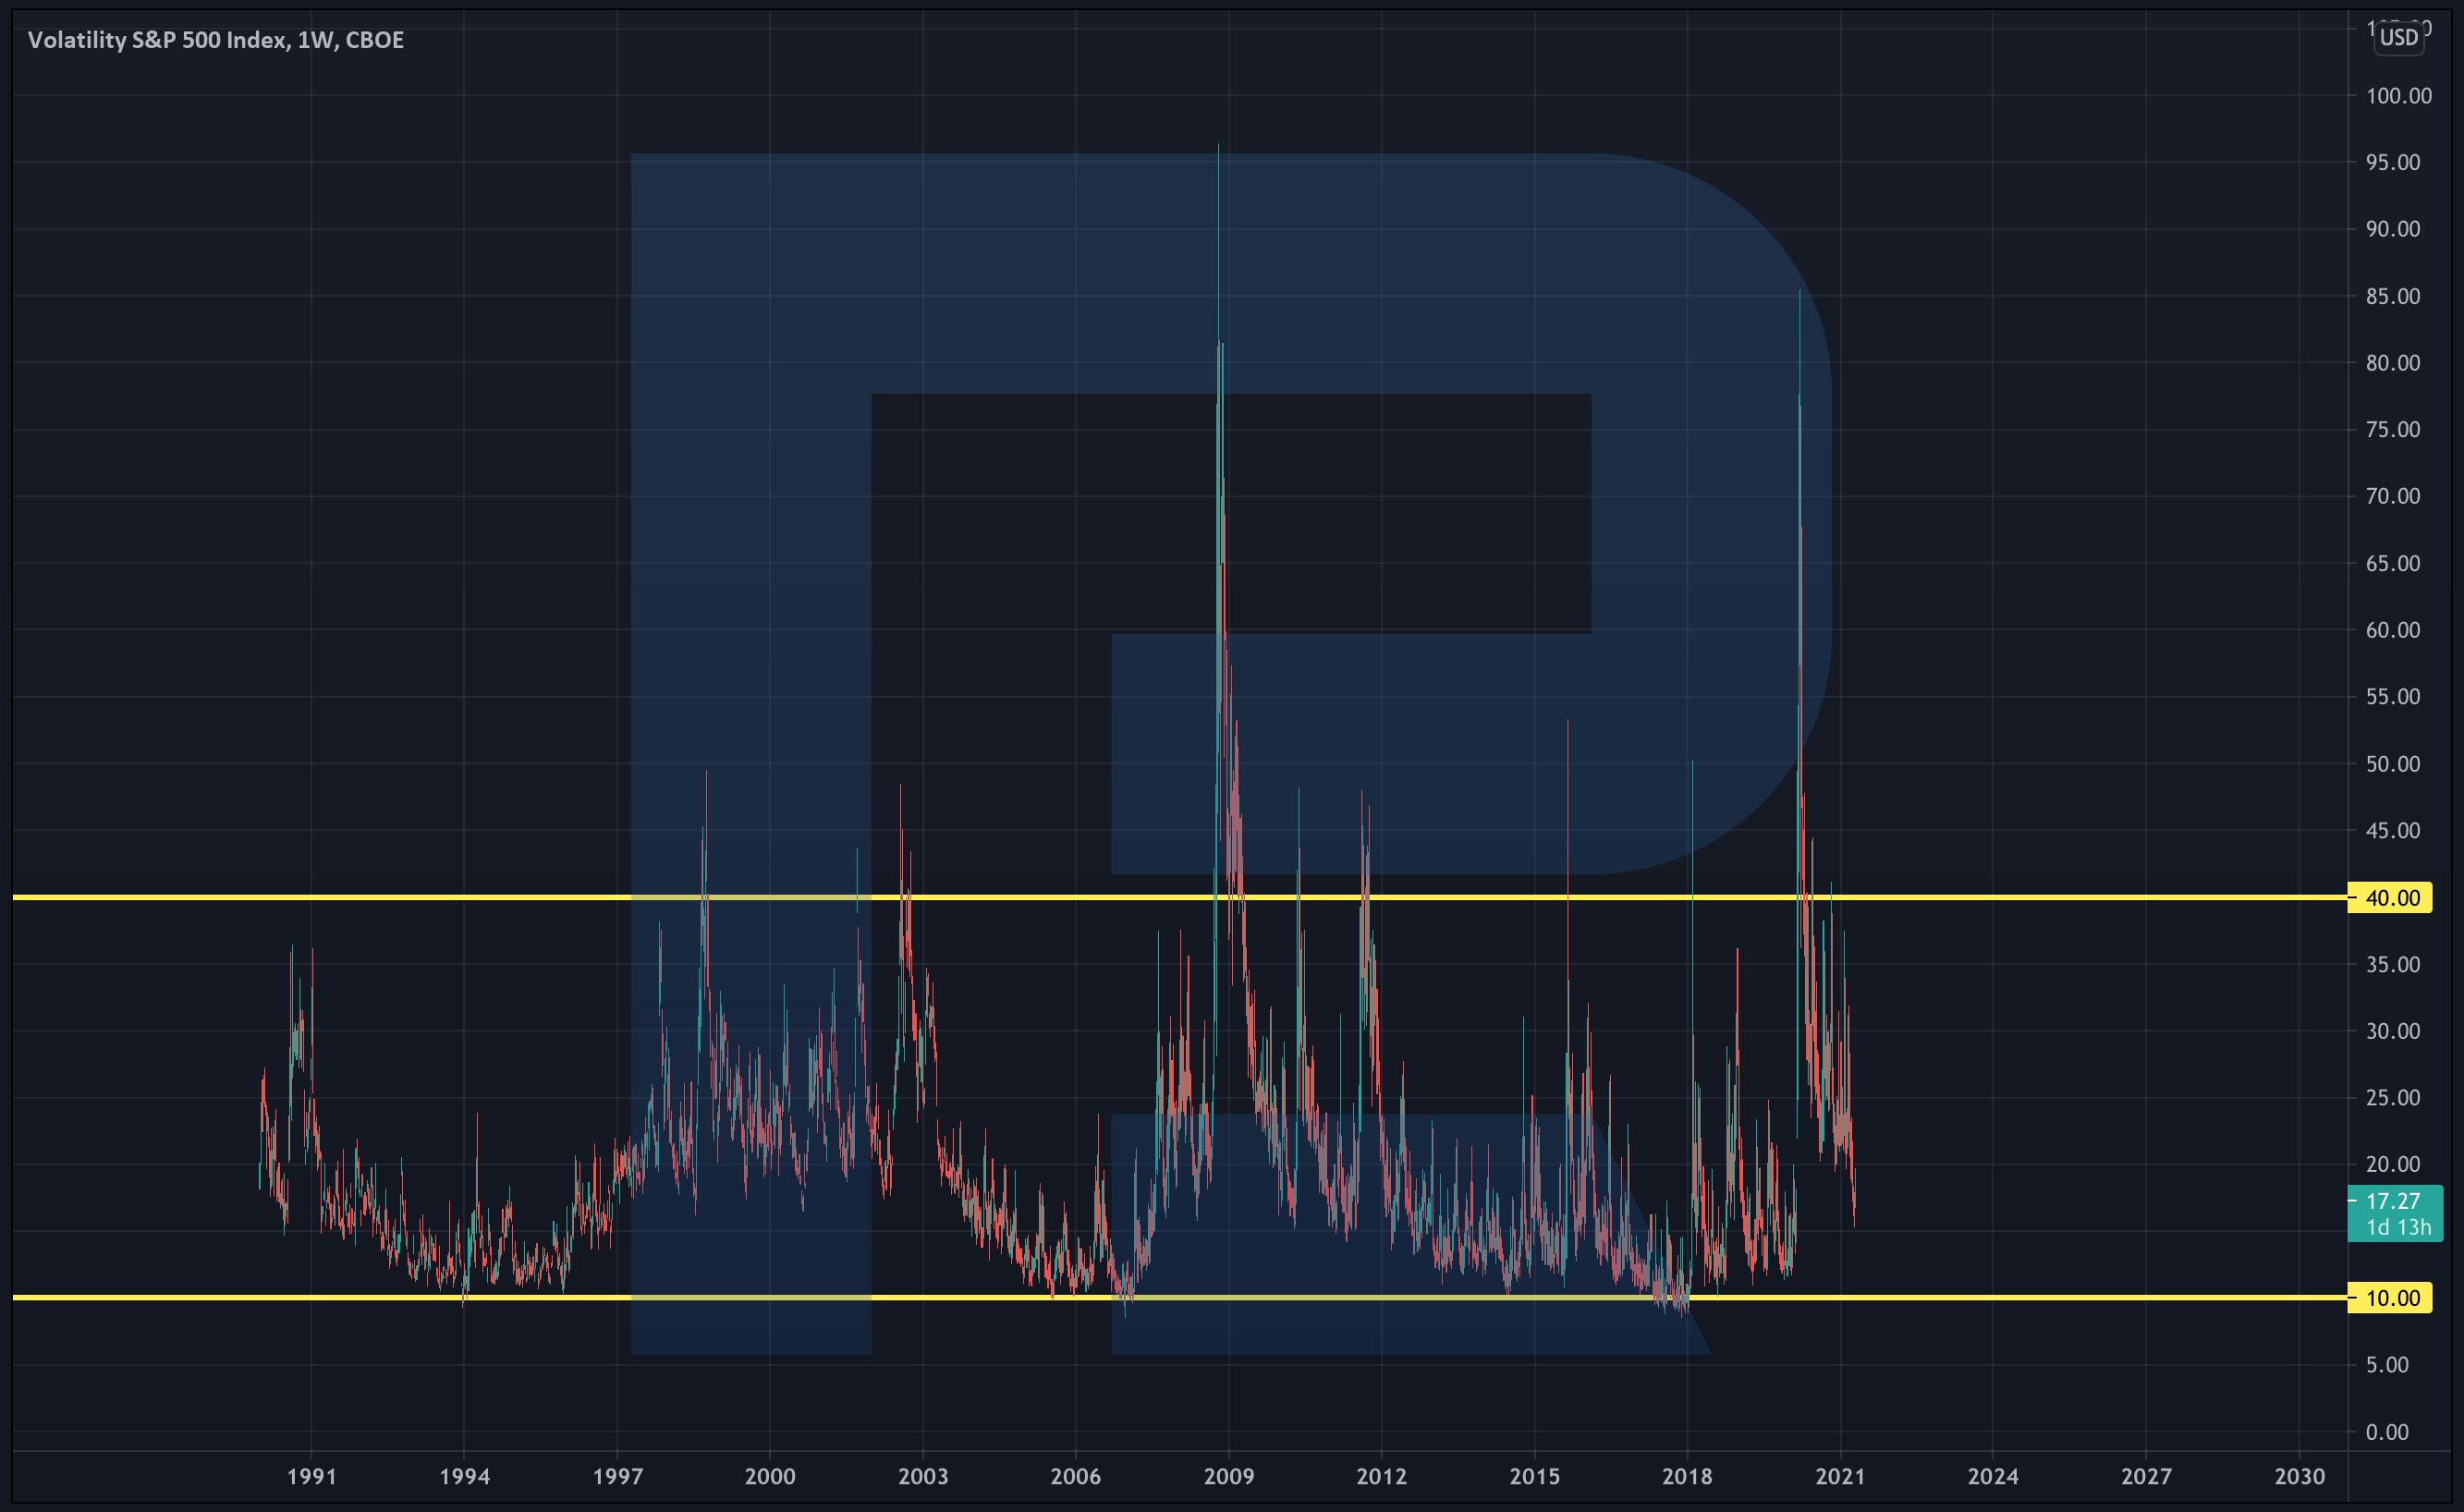
In essence, the VIX helps to determine the market sentiment and the moods of investors on the whole. If the index falls below 10, this indicates a high probability of an approaching crisis, and when it rises above 40, the end of the crisis must be near.
The difference in bond’s yield
Analyzing the 2-years and 10-years US treasury bonds, you can also forecast an economic crisis. Economists say that a crisis is near when the yield of 2-years bonds becomes higher than that of 10-years bonds. On the chart, this looks like falling below 0.
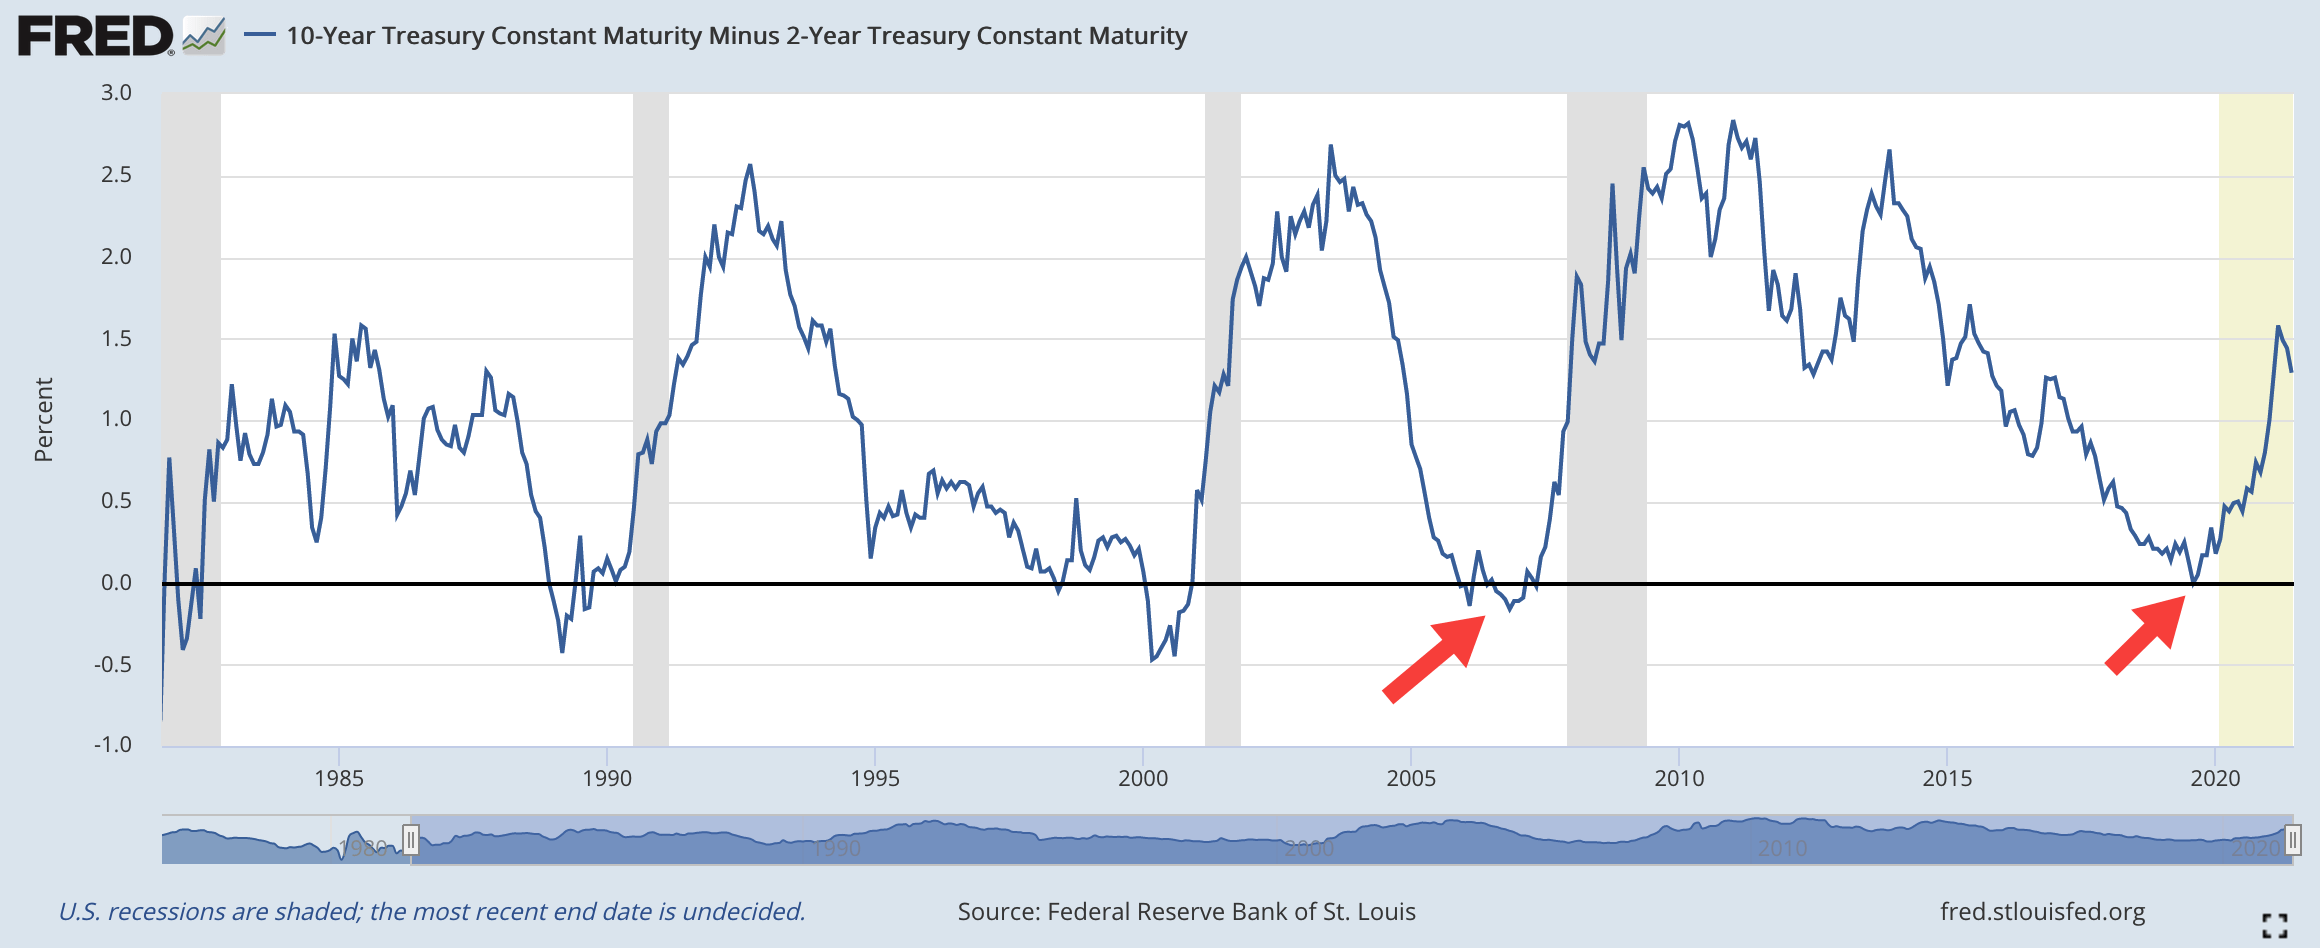
A new crisis starts a year or two after such an event. The chart dropped below 0 at the end of 2006, and in 2008, a crisis began. The next decline happened in the middle of 2019, and markets collapsed in 2020.
Hyman Minsky’s theory
Hyman Minsky, an American economist who became especially famous during the crisis of 2008, singled out 3 stages of crediting that result in an economic crisis. He called them:
- Hedge
- Speculation
- Ponzi
At the Hedge stage, banks and borrowers are especially careful. Banks give small loans, and borrowers can pay both the interest and the whole loaned sum. When trust increases, banks gradually increase the sums of credits so that borrowers only pay the interest.
As a rule, loans are guaranteed by an asset that is growing. Here comes the second stage called Speculation. Banks and borrowers try to make money on the growing asset.
And when the previous crisis turns into a vague memory, the third Ponzi stage comes. Banks will be giving such loans that the borrower will be unable to pay either the interest or the debt itself. As the asset grows massively, banks and borrowers calm down. All this is supported by the hope for the endless growth of the asset.
This is similar to the situation when borrowers do not pay mortgage interest for several years hoping for the dwelling price to grow so much that by selling the house they will cover up all the expenses. But as soon as the asset stops growing, banks and borrowers realize that there is a debt in the system never to be paid back. People start selling the asset in panic, which results in a deeper decline that provokes a crisis.
Bottom line
Unfortunately, economic crises have always been around and will happen in the future. Every next such event is likely to be different from the previous one. However, several types of signals warn you of an approaching crisis, so that an experienced investor can leave the stock market and start buying the USD and gold.
One of the easiest ways to predict a crisis in advance is to analyze the bond’s yield: this chart predicted the two latest collapses of the Dow Jones and the stock market. This is an easy but informative and efficient way.
Hyman Minsky’s theory is also noticeable: according to it, investors and borrowers lose vigilance and concentrate on the growth of an asset, which leads to another collapse of the world’s economy. However, to use this method, you do not only need to look at the chart but also to dive into economic processes and track the behavior of investors in markets not to end up as a Ponzi investor buying everything that grows for borrowed money.


