Margin Zones in Forex, or How to Predict Price Moves

5 minutes for reading
Many traders use support/resistance levels in trading and market analysis. Today, I will ponder on a sort of an analog to these – it is called margin zones, and they are known by rather few market players.
Margin zones in Forex function similarly to support/resistance levels. Quotations form bounces or break through levels, and this is what trading by margin zones is built on.
Where do we take margin zones from?
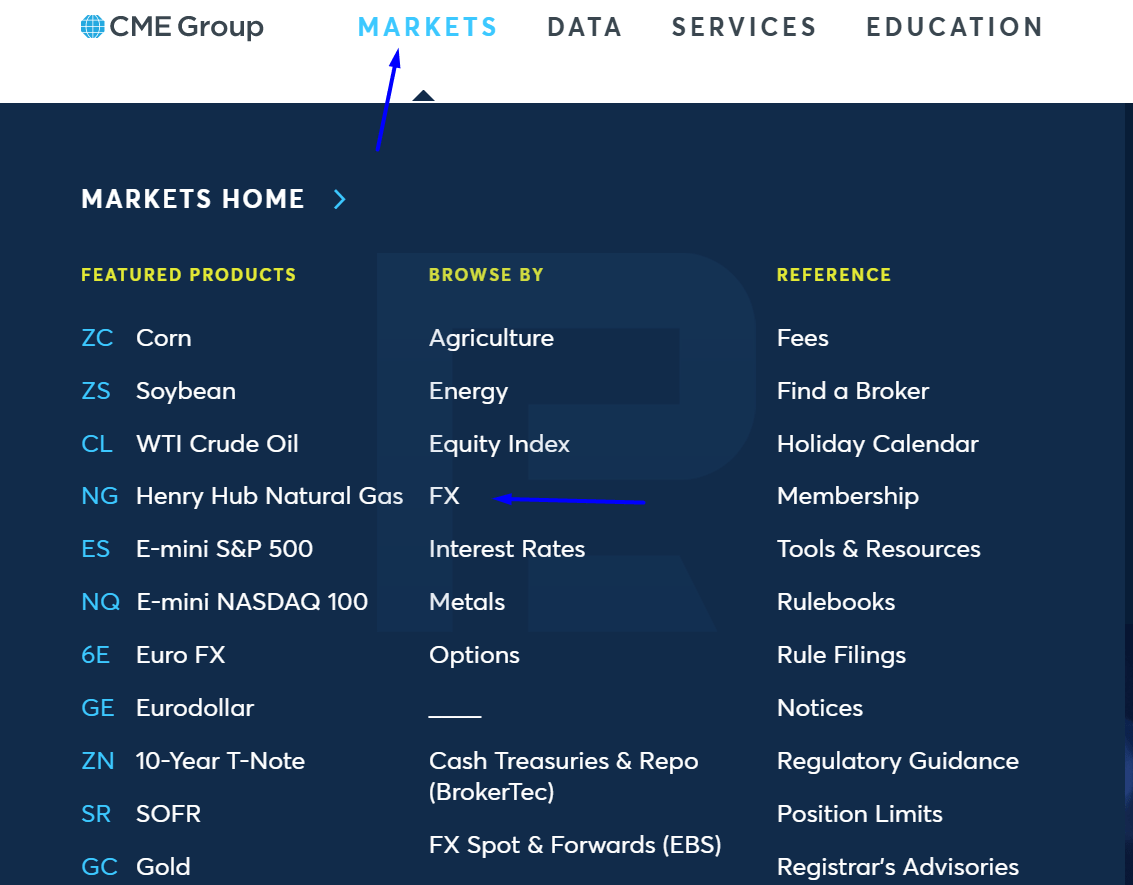
Margin zones are marked by the exchange itself. As an example, let us take the CME, where the largest volume of currency options and futures is traded.
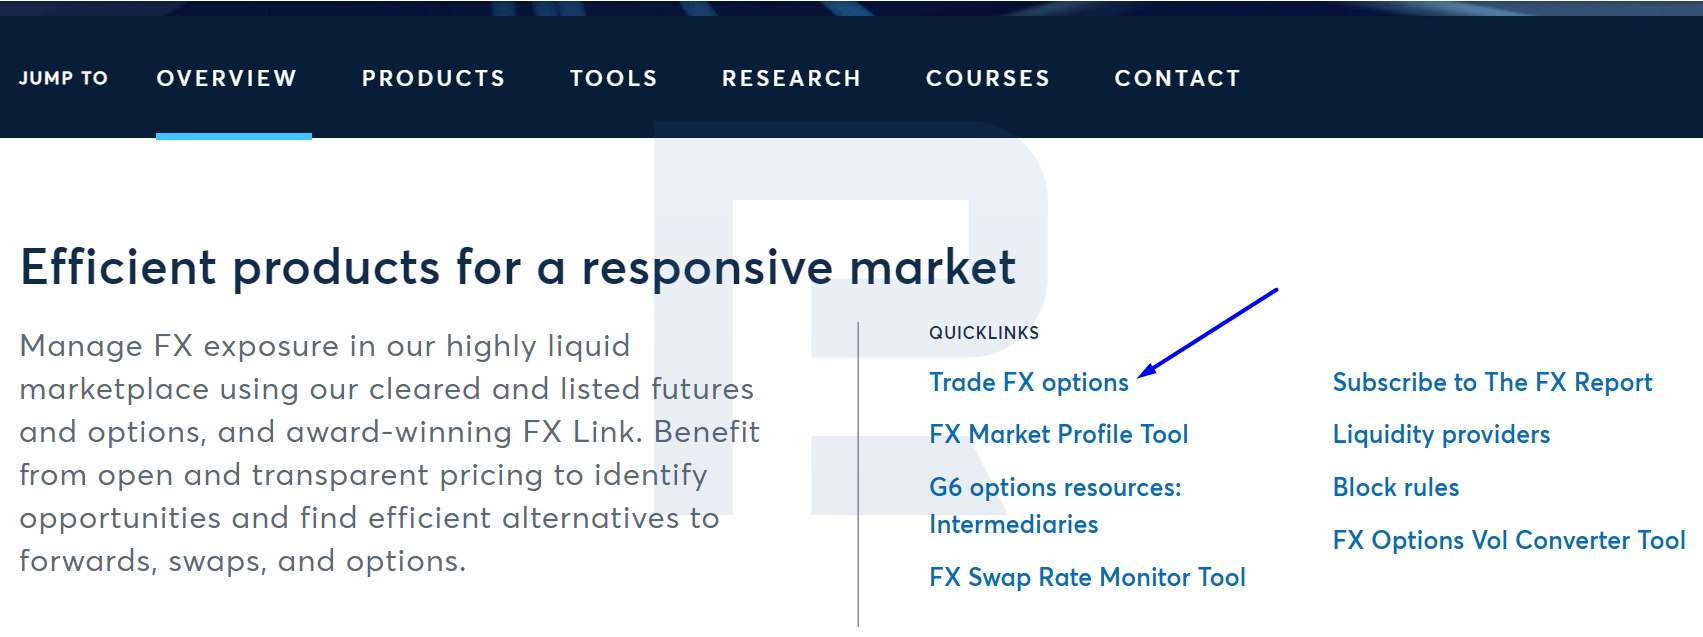
On the website of the exchange, go to the FX section, then – to Trade FX Options.
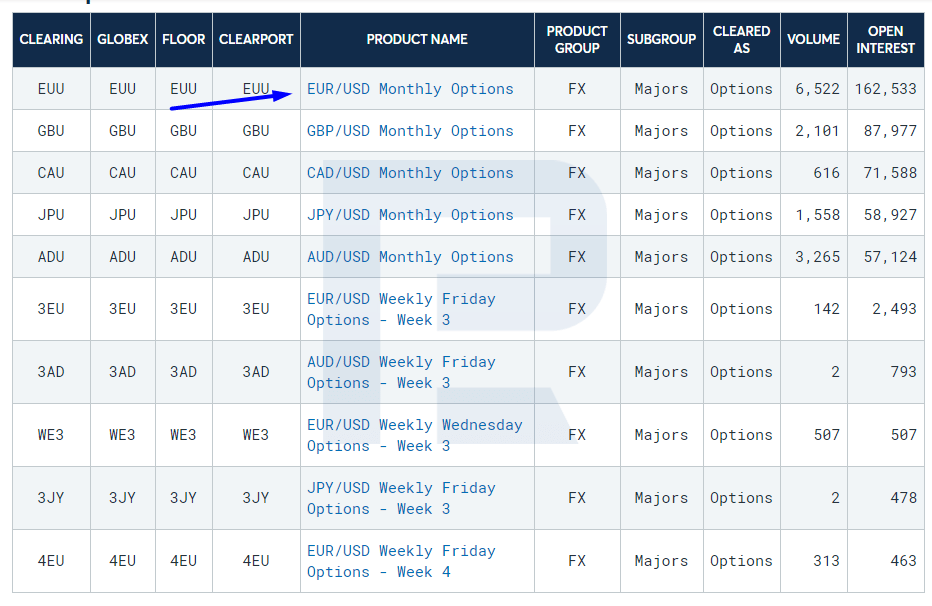
Choose your contract and check specifications in the Margin section; for EUR/USD, they are:
In the specifications, you can check the start period, the expiry period, and the maintenance sum of the contract. In our example, a EUR futures is in force from April 2021 to July 2021, and the maintenance sun is 2,200 USD. This means that to buy a EUR futures without leverage, you need to have 2,200 USD on your deposit.
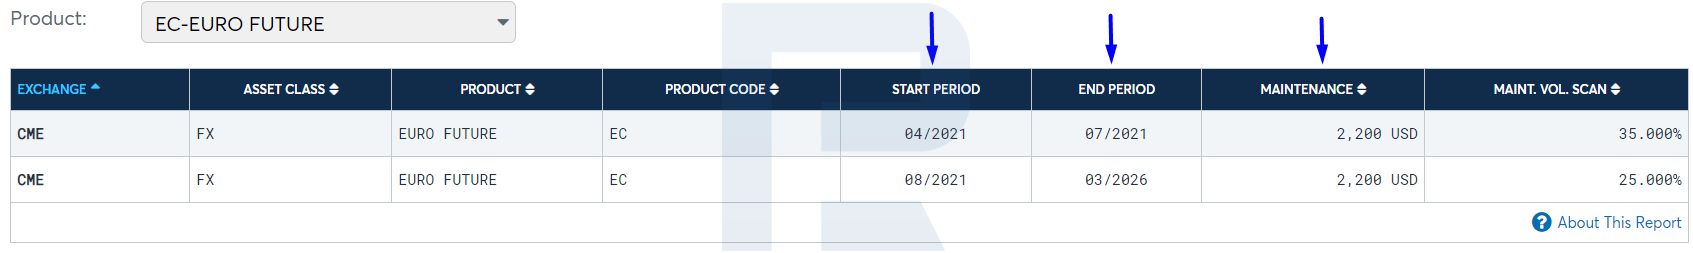
Calculate the size of the margin zone in points from the starting period of the futures. In the example above, the futures came into force on the third Monday of April. Draw a line at the opening of the candlestick (the opening on the CME).


How to calculate the position of the margin zone?
To set the level, divide the maintenance sum (2,200 USD) by the price of one point of the price move (12.5 USD); this makes 176 points. Add 10%, and here we get our margin levels. The addition is necessary for setting the range of levels.
Mind that in terminals where a four-digit way of writing down quotations is used, the level will be calculated as 176+17.6=196.6 points, while with a five-digit system, it will be written down as 1,966 points.
The next step is to mark +196.9 and -196.6 points on the chart away from the opening price in the CME on April 19th (that very third Monday). This way we get those medium-term margin levels.
They are not perfectly suitable for trading intraday because of low price volatility. For medium-term and long-term trading, they can serve as support/resistance levels. New medium-term levels are drawn after the current futures contract expires and a new one opens.
Intraday margin levels
For intraday trading, use the same calculation method only divide the result by 4. The levels are drawn based on the opening price of the first hourly candlestick in the CME trading session. As you can conclude from the name, intraday levels are drawn every day.
Using margin levels for trading
The following levels suit for trading with margin levels: USD/CHF, EUR/USD, USD/JPY, GBP/USD, AUD/USD, NZD/USD.
The timeframes are M30, Н1, H4, D1.
For intraday trading, the trading session is American. For medium-term trading, any session will do.
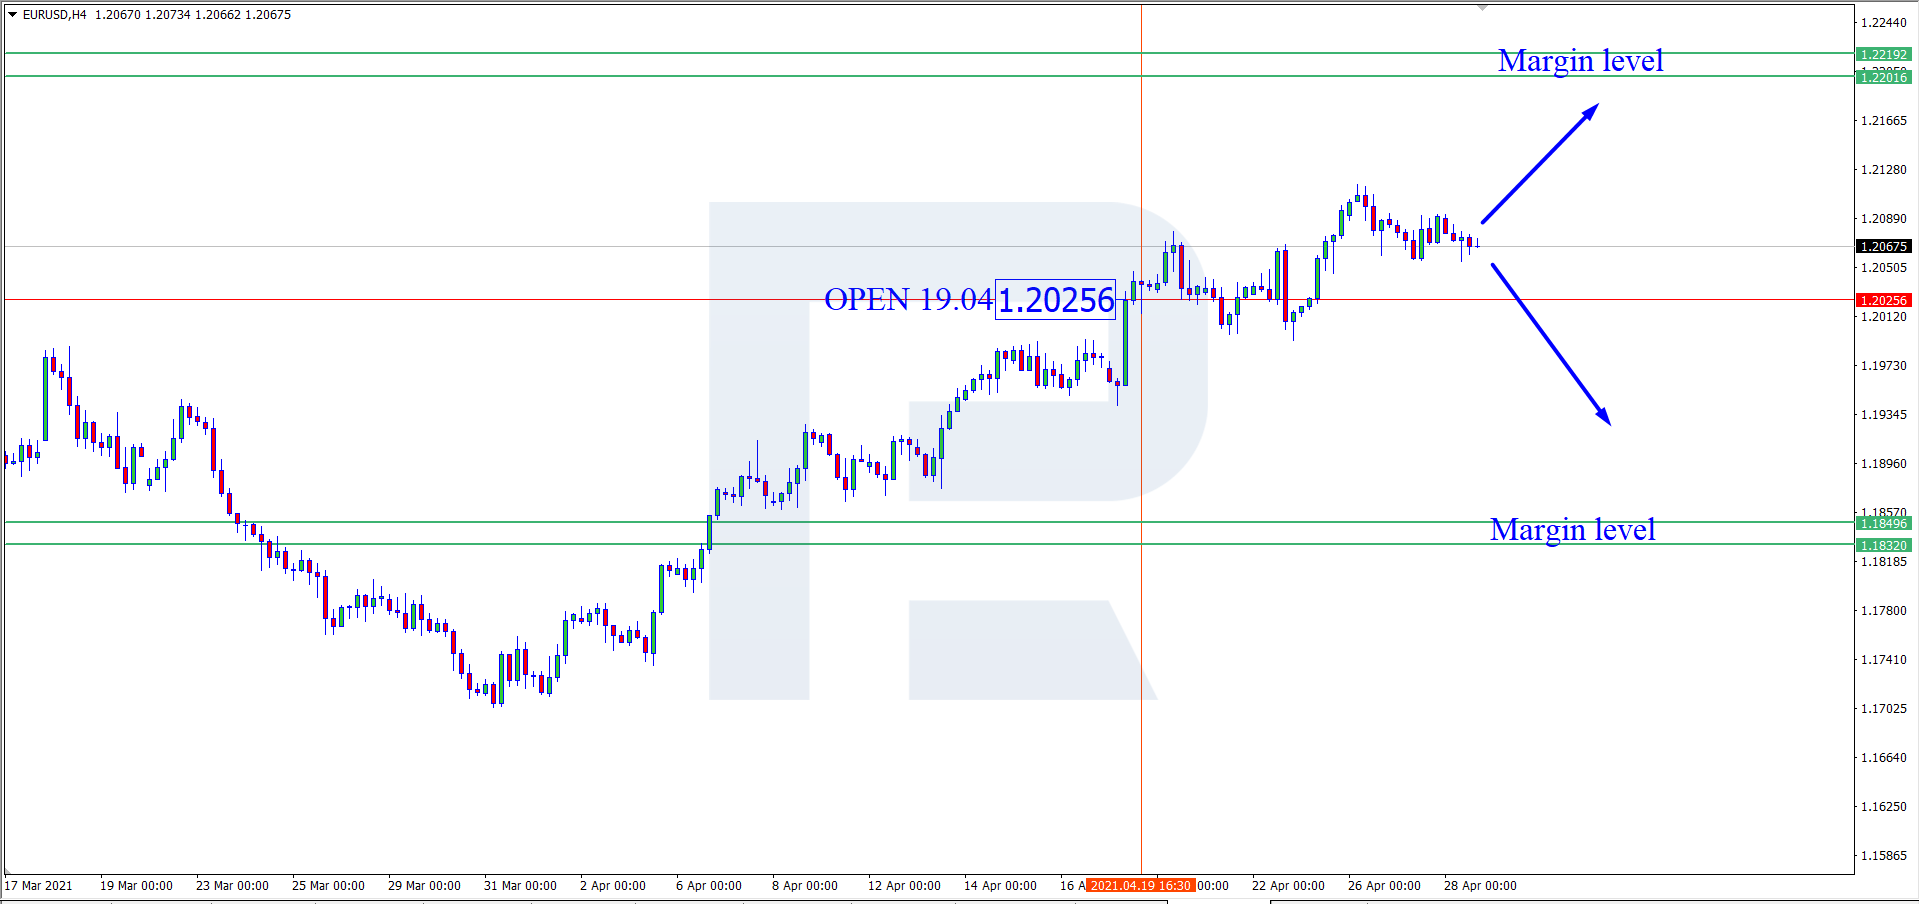
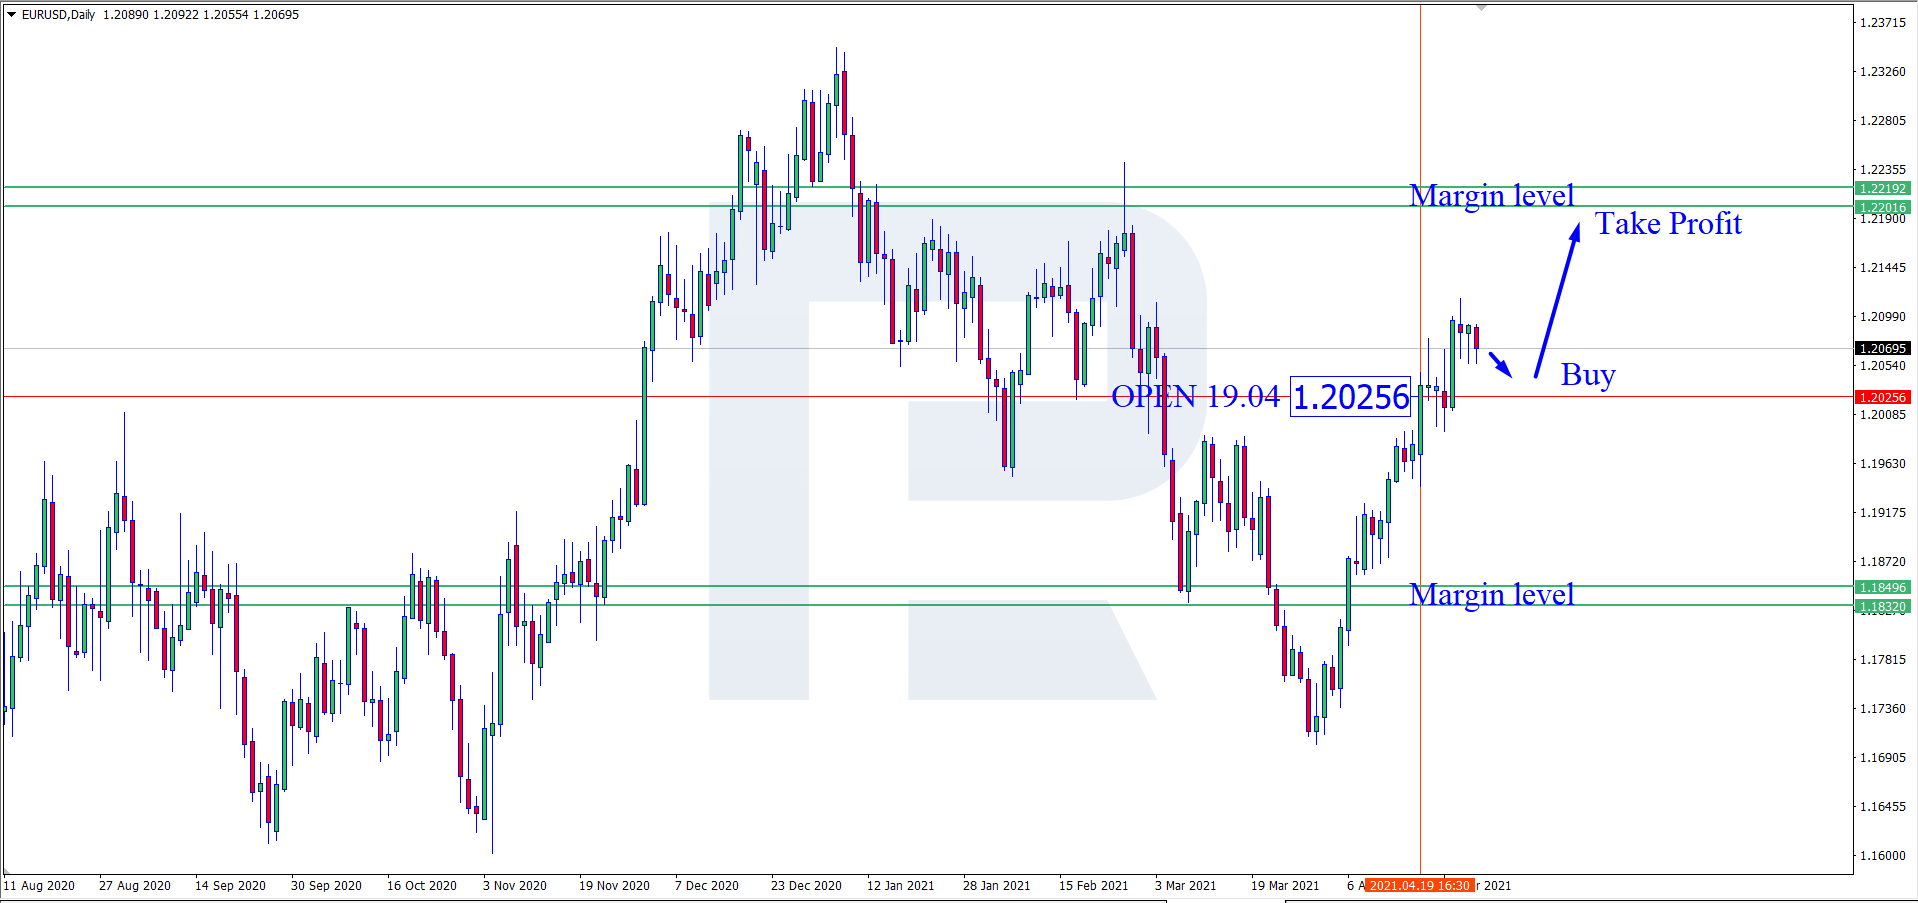
Based on the chart with margin levels on it, you can make several suppositions:
- There is an uptrend on it.
- The margin levels act as the support and resistance levels.
- Currently, there is a correction forming.
- If the chart pulls back to the contract expiry level, it will most probably bounce and resume growing.
- The aim of further growth is the upper margin level (the resistance level).
- To buy in a correction, place the Take Profit on the resistance level (the lower border of the upper margin level).
- Place the Stop Loss under the opening price of the futures contract.
- At the present stage, sales are only possible at a bounce off the upper level.
An example of trading with pending orders
With pending orders, margin levels are used as reversal ones, and you trade bounces off them.
At the lower border of the upper margin level, place a Sell Limit, with a Stop Loss 10 points above its upper border.
At the upper border of the lower margin level, place a Buy Limit, with a Stop Loss 10 points under its lower border.
In both cases, place a Take Profit at the opening level of the futures.


Intraday (short-term) trading strategy
Before a trading session opens in the CME, maintenance, and margin levels are calculated.
The calculated number of points is divided by four, then the levels are marked on the chart in relation to the opening price of the first hourly candlestick. In this case, trade breakaways with Sell Stop and Buy Stop orders are placed on the margin levels.
If one order gets triggered, the second one is deleted. Place an SL at the opening price of the first hourly candlestick. Close your positions at 9 p.m. Chicago time. For the next trading session, draw the margin levels again.
Summary
At first, drawing margin levels for futures contracts will seem quite uncomfortable and complicated. You will have to look for information about futures and their maintenance, make calculations, and draw the lines on the chart.
However, after you do it several times, things will get easier. There might even be some scripts for the terminal of indicators on the Internet that will help you with drawing the levels.
Quite often, traders are sure that the market moves chaotically and unpredictably. Quite often, they are right, but if you study market moves closely, you will see certain patterns that you will later be able to use. Like any other trading strategy, the one based on margin levels needs testing on a demo account before using it for real.


