How to Trade by Indicator-less Strategy From Pullback?

5 minutes for reading
The “From Pullback” indicator-less strategy is based on quite a fair supposition that a price move, especially an impulse, will quite fairly continue in the same direction than change it. H1 is a suitable timeframe here, but if some other period is comfortable for you, feel free to use the strategy on it. The strategy applies to Forex, futures, and stock markets.
A signal to buy by the strategy
For an opening signal to emerge, the following conditions must be fulfilled:
- A characteristic upward impulse move (for the chances for trade continuation to be maximal);
- At least one pullback during the growth, followed by another impulse (this will be confirming the ability of the impulse to overcome pullbacks easily);
- At the working timeframe, the candlesticks constructing the impulse in question must be more or less of the same size (because after one enormous candlestick an equally huge pullback might follow, and the end of such ones are hard to predict).
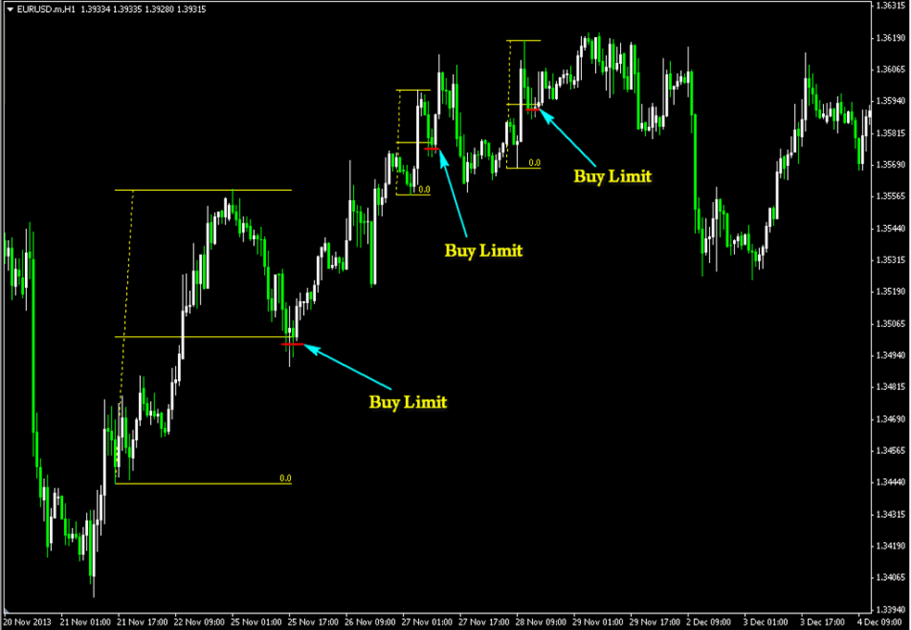
When all these requirements are met, you can place a Buy Limit order. To find an optimum place for it, measure the distance from the High of the last candlesticks to the local low of the last pullback. Divide this distance by two and add a couple of ticks. Mark this distance from the High of the last candlesticks, and this will be the level that the pullback, which will appear sooner or later, can reach.
If the price keeps growing but the pullback does not appear, repeat the calculations at the end of each period: if you are trading on H1, make calculations at the end of each new candlestick if its High is higher than that one you used previously. This is how you hunt pullbacks. Examples of signals to buy by the strategy:

As you can see, to find an entry point easier, I used Fibo levels with all values deleted except for 0.50% and 100%, dragging them between the necessary points; then I just placed the Buy Limit several ticks lower.
A signal to sell by the strategy
A signal for a short position requires the following conditions in your currency pair/futures/share:
- A characteristic impulse falling;
- At least one pullback must have happened, after which the price went further down;
- On the working timeframe, the candlesticks constructing the impulse must be of more or less the same size.
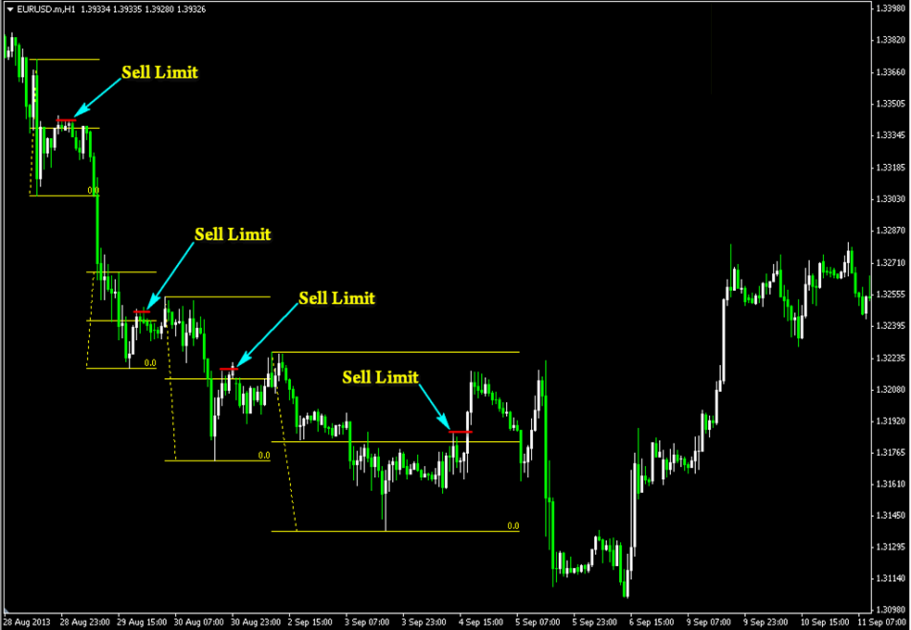
The next step should be finding the middle between the Low of the last candlesticks and the highest local high inside the last pullback. Our Sell Limit must get several ticks higher than this middle. Examples of signals to sell by the strategy:

Of course, quite frequently, you might catch a good trading situation during the pullback already. In this case, if the price has already reached the entry level, you may enter by the market. If the price has already got significantly higher, I would recommend you to place a Sell Stop at the target level of Sell Limit. The trading strategy will not be harmed; on the contrary, it might only win from this, because if the growth turned out to be unpredictably high, you will avoid losses.
Stop Loss and Take Profit by the strategy
In case of buying, place a Stop Loss below that very lowest low formed in the last pullback. In case of selling, place it behind the highest local high of the last pullback. The distance from the extremes is the same as you take from the middle you use for finding the entry point. If you are selling, do not forget to add the spread to the SL size.
Transfer the positions to the breakeven at your own risk and by your own experience. If your trader’s principles require protection of your current profit, use the extremes that appear after the pullback, while the price is approaching the profit.
As for the Take Profit in buying from pullbacks, take the High of the last impulse candlesticks you used for calculating your Buy Limit and mark a point as many ticks below it as you marked from that middle level when finding a place for the Buy Limit. In the case of sales, from the low of the last impulse candlesticks mark as many ticks upwards as you market from the estimated middle when finding a place for the Sell Limit.
As a result, in this method, you have a roughly 1 to 1 proportion of the SL to TP. This is not the most attractive proportion, but alas, this is the peculiarity of the strategy. Of course, if you are sure that after the pullback the market will go in the correct direction, place the TP at a better point, but remember that this might decrease your chances for closing the position by the TP.
Money management for Forex, futures, and stock markets
Thanks ot pending orders used in the strategy, you can always enter the market by a set proportionate risk of your deposit, for each trade to have equal chances for a loss and a profit.
As for the size of the risk, I agree with A.Elder who recommends never to risk more than 2% of the deposit. If you get three losses in a row, stop trading by the strategy and scrutinize your results. You will be able to continue after a thorough and frank analysis.
In this article, I got you acquainted with another indicator-less strategy that has its advantages and drawbacks. Anyways, the author uses it in the market successfully. This does not guarantee your personal success; however, some will definitely like it for being so formalized, which is a rare case among indicator-less strategies.


