How to Trade Master Candle Method Strategy

4 minutes for reading
If someone was looking for a simple and easy-to-understand trading strategy, consider your search is over. Master Candle Method is a trading system based on one indicator and one only. It signals an opportunity for trading and shows spots where to enter and leave the market. The strategy is applicable for trading only GBP/USD and GBP/JPY pairs, and only on the Н1 timeframe.
Desktop of Master Candle Method
1 – “MC_Indicator” indicator.
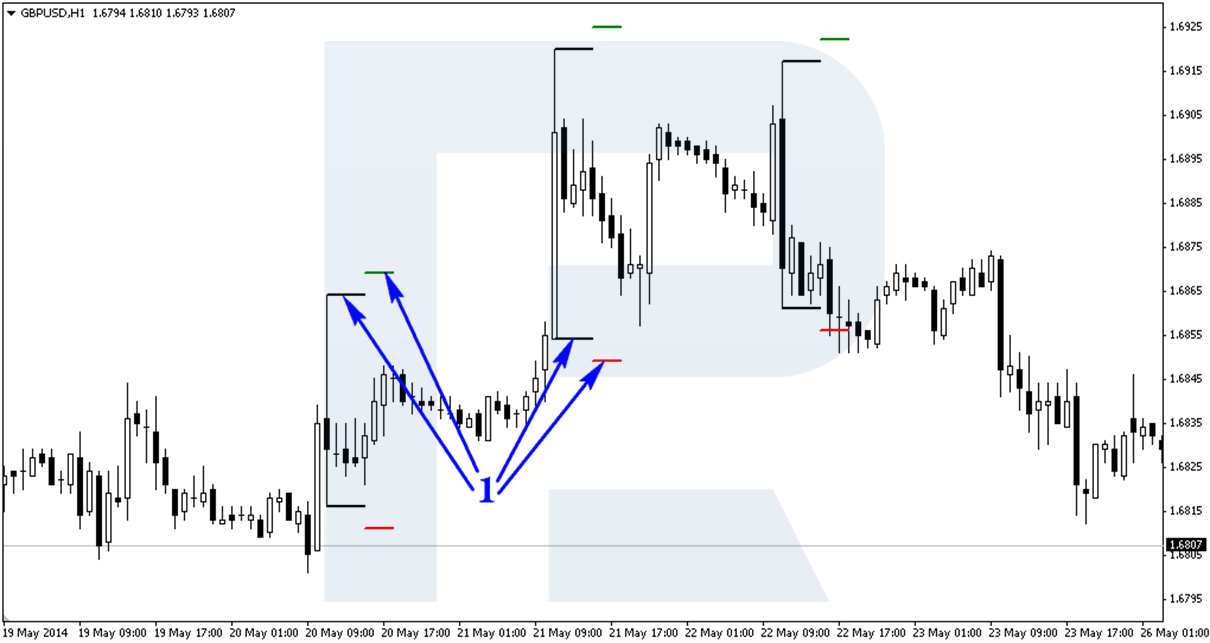
A signal to buy in the Master Candle Method strategy
A signal appears when there is a candlestick on the chart with 4 more candlesticks being formed inside it. As soon as this condition is met, two dashes appear – the first one is black, above these candlesticks, the second dash is green, a bit higher, 3-candlestick long. Above this green dash, a pending buy order is placed with a 3-hour spread value. If a signal appeared and three candlesticks were formed after that but a pending order wasn’t triggered, this order should be removed.
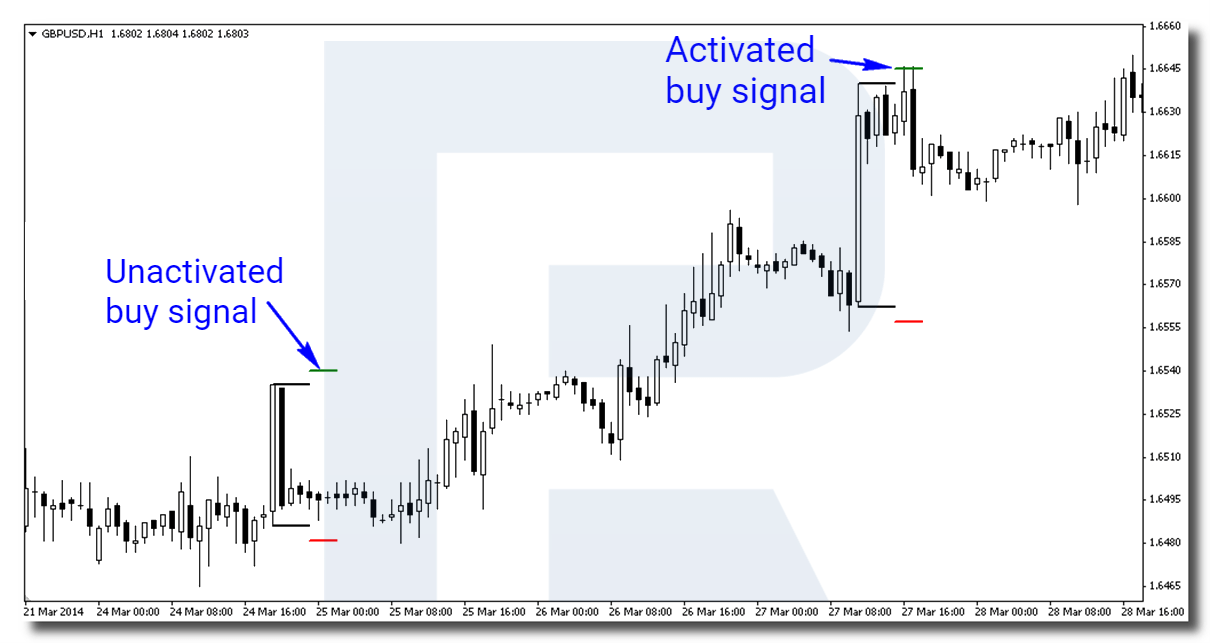
As you can see here, the first signal to buy wasn’t triggered because the Bid price didn’t touch the green dash over the course of three hours after the signal appeared. However, in the second example, it was triggered.


A signal to sell in the Master Candle Method strategy
A signal to sell appears under the same conditions as a signal to buy. It’s just that in the case of a signal to sell, one should place both buy and sell pending orders at once. A sell order should be placed at the level where a red dash appears after the signal. The dash is also 3-candlestick long, and if an order wasn’t triggered, it should be removed. The order also should be removed if a buy order was triggered first. And vice versa – if a sell order was triggered first, one should be removed a buy order.
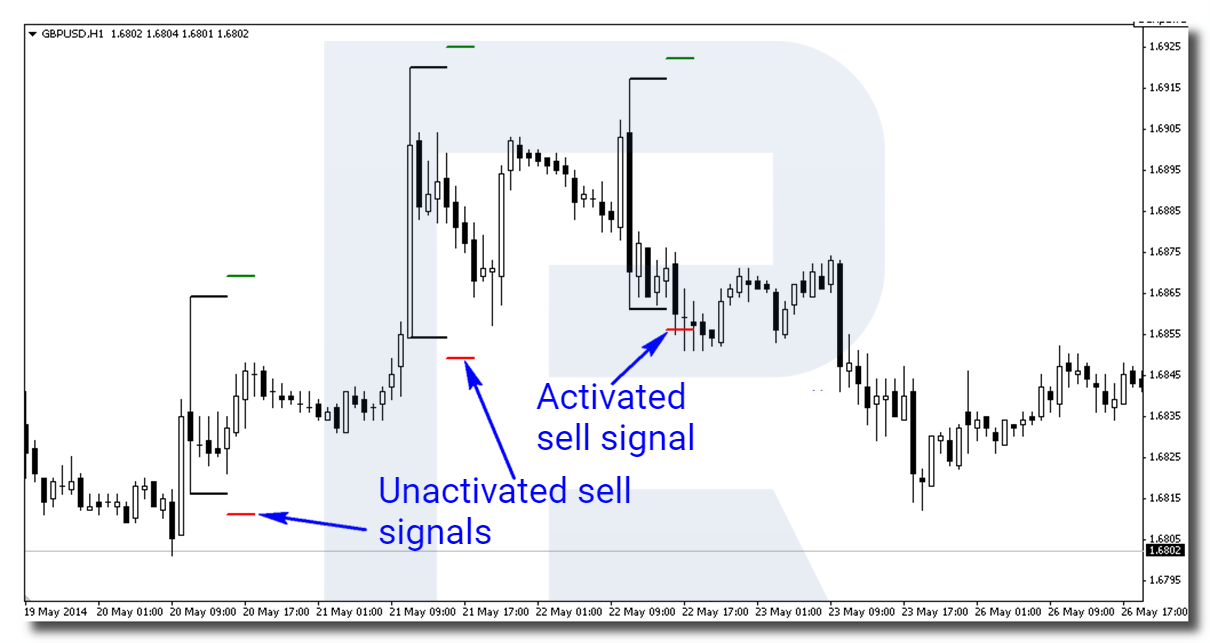
This example shows that two signals to sell weren’t triggered during the required period of three candlesticks, while the third signal was triggered during the first hour, after which a pending buy order should have been removed straight away.
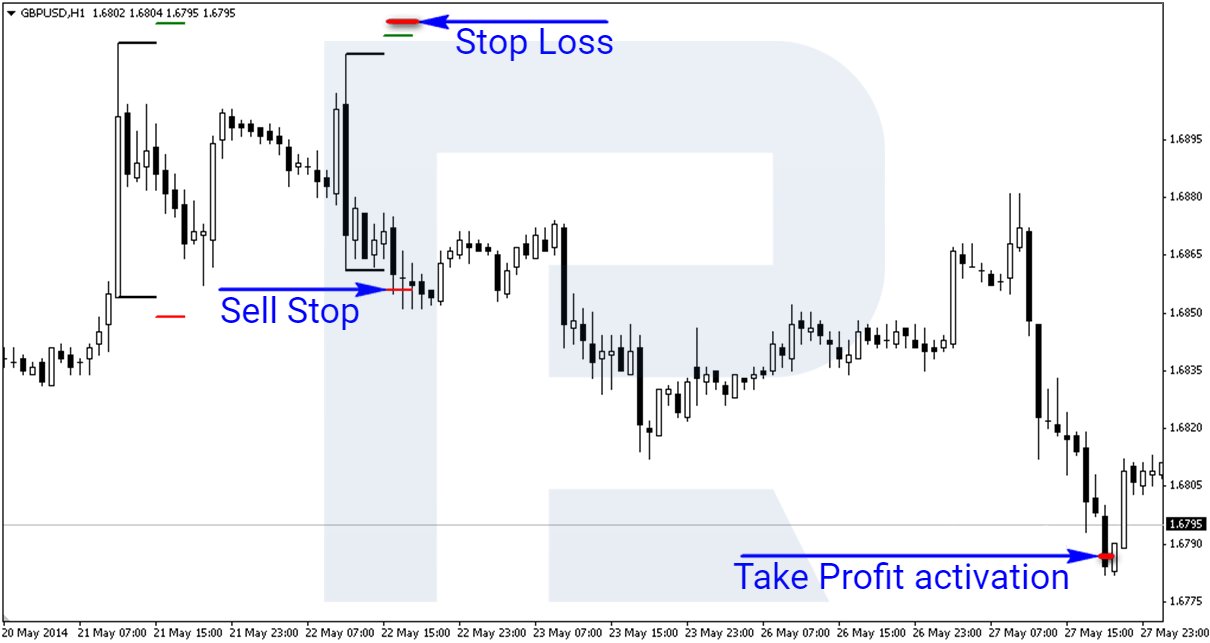
Stop Loss and Take Profit in the Master Candle Method strategy
In this system, a Stop Loss order is placed on the levels of opposite pending orders. It means that Stop Loss for a buy order will be on the same level as Sell Stop, and vice versa, Stop Loss for a sell order is placed on the same level as Buy Stop.
A Take Profit order in this strategy is usually specified equal to risk exposure. If the closest significant level is far away and the movement has a high potential, then Take Profit is usually high. However, one shouldn’t open a position if:
- The profit is either less than 40 or more than 105 points (400 and 1,050 pips in the case of 5 digits after comma or 3 digits for GBP/JPY).
- A signal appeared close to a support/resistance level.
- There is a support/resistance level on the way to Take Profit.


Capital management in this trading strategy
Due to capital management system for this strategy you should risk the same percentage of the latest fixed deposit amount, but not more than 1-2%. It is not recommended to re-enter the market until the previous order is closed with a Take Profit or Stop order.
Closing thoughts
As you can see, the strategy is pretty simple and could be easily used even by beginners. However, my experience says that if you open positions for every single signal that appears, the results will tend towards zero. That’s why one should learn to see the difference between promising options and potentially losing.


