What to Invest in When Interest Rate Is Growing?

8 minutes for reading
The Bank of Canada decided to serve as an example to other banks and became the first one to wind up the Quantitative Easing program. The interest rate was for now left at 0.25% but the regulator plans to increase it by the mid-2022.
The European Central Bank decided against hurrying too much and announced just a cut-down of the QE program. The regulator plans to increase the interest rate only if inflation secures above 2% for a long run.
The Fed, compared to these two, act in the riskiest possible way. It only considers cutting down on the QE, and will decide on increasing the interest rate only if it sees serious risks of growing inflation expectations.
Taking into account the behavior of other CBs, investors expect the Fed to wind up the QE. They think this will be announced at the nearest conference. Next thing, the interest rate is likely to be increased.
To such an event, the market often reacts negatively because an increase in the interest rate somewhat slows down economic development and makes loans more expensive. However, some people manage to make larger profits when interest rates increase.
Today I will demonstrate you some financial instruments worth paying attention to when an increase in the interest rate is expected.
Will the interest rate necessarily be increased in the USA?
Market players expect an increase in the interest rate in 2022. This conclusion can be made because this information is most often encountered in the media and because the profitability of 10-year treasury bonds grows. Over the last two months, it has increased from 1.25% to 1.7%.
Analyzing some data, I found out that an increase in the interest rate in 2022 is rather probable, so the market expectations are correct. I will try to explain my thinking below.
How QE is connected to the interest rate
To solve the problems of the mortgage crisis in 2008, the Fed decided to switch on the printing machine and drown the economy in money. In 2019, they did not reinvent the wheel and took the same road as in 2008. This is very well demonstrated on the diagram of the Fed balance.
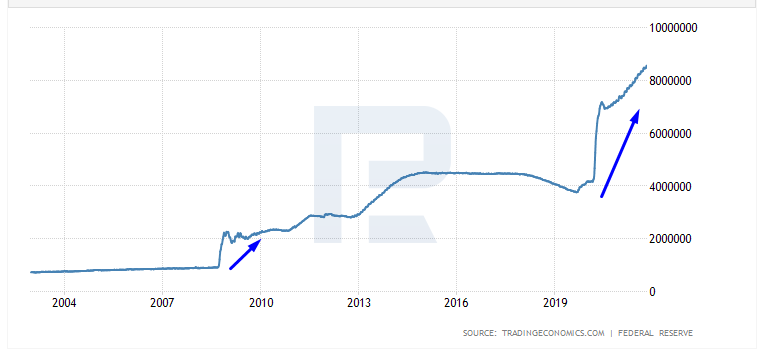
The difference between 2008 and 2019 is in the volumes of money only. Next thing, we can see some attempts to stop the QE but at a full scale it was finished in 2016.
Now take a look at the chart of the discount rate of the Fed. At the moments when the entity tried to cut down on the QE, the rate was never lifted. The regulator assessed the stability of the economy from the start, and if there were a risk of a serious slow-down, they restarted the QE program. Only 8 years after the crisis, the economy managed to recover and function without extra money.
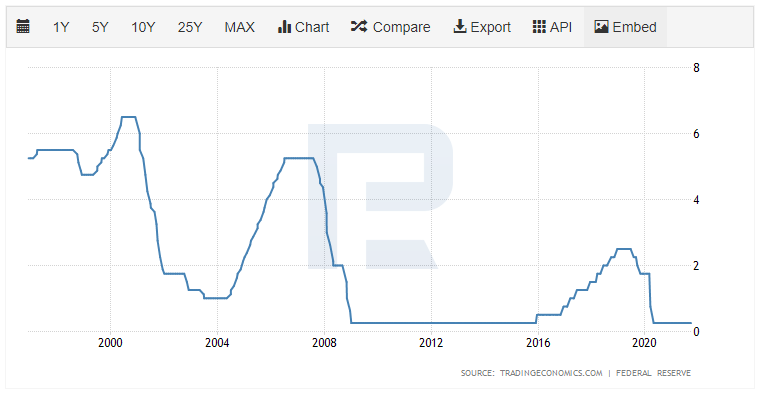
In 2015, the Fed started to wind up the QE, and in 2016, the rate started upwards gradually.
How the QE, inflation, and interest rate are connected
Now take a look at the inflation rate after the mortgage crisis.
Initially, it dropped to -2%, i.e. changed for deflation. Then it grew steeply to 2%, then to 4%. When surges were over, inflation stuck at the craved 2%.
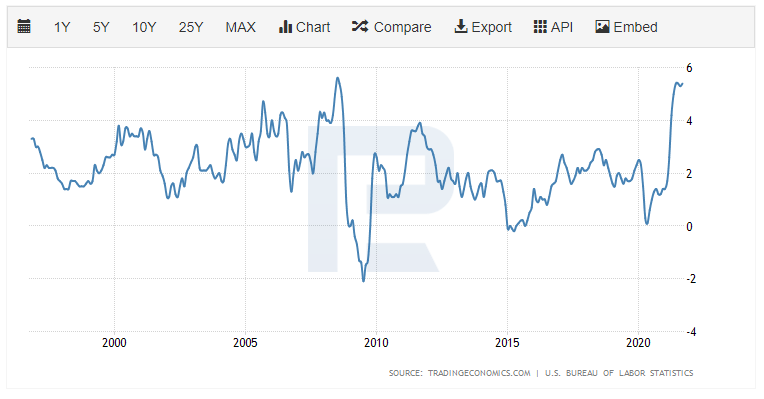
The discount rate never changed over this time. We can say that inflation was regulated by the QE program. When this influence stopped, the regulator used the discount rate and managed to hold inflation at 2% until 2019.
Now inflation is growing rapidly (like after the mortgage crisis), followed by record QE rates. Hence, the Fed will most probably regulate inflation by cutting down in the QE. And only if these measures prove inefficient, they will use the discount rate.
What happens to the stock market if they lift the discount rate and finish the QE?
During the transition period, when the Fed closed the QE program and started increasing the interest rate, the S&P 500 stock rate traded between 1,800 and 2,100 USD. This was until 2017.
An increase in the discount rate meant a complete recovery of the economy, and the regulator had to slow it down to avoid overheating. Hence, the next increase in the discount rate was followed by growth of the stock index but not as rapid as if the rate never grew at all.
Unemployment as indication of an increase in the interest rate
If you look at how things went after the mortgage crisis, the probability of an increase in the discount rate in 2022 is minimal because last time the economy needed 8 years to recover. However, now the situation is rather different. There is an indicator showing that the Fed might run to tough measures to counter inflation.
If the regulator decides that the economy has recovered and can function without support, it will use the discount rate to fight inflation. For Jerome Powell, it is the unemployment rate that demonstrates whether the economy has recovered. If this rate reaches the pre-crisis level, this will make the Fed lift the rate.
Let me give you one more comparison with the previous experience. After the mortgage crisis of 2008 the unemployment rate returned to the pre-crisis level only in 2016. This is when the Fed started increasing the rate.
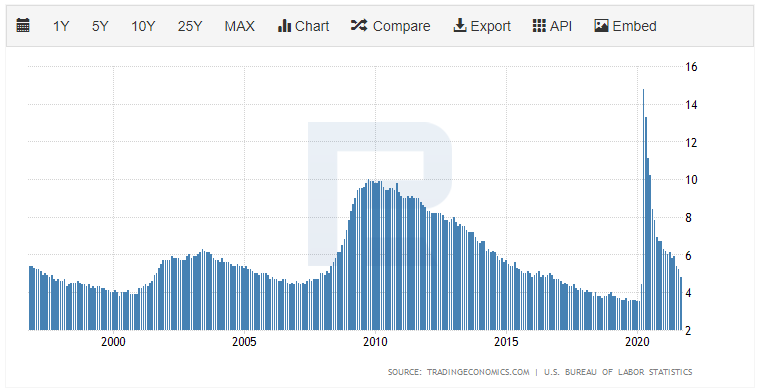
Before the COVID-19 crisis, the unemployment rate was 3.5%. Now it is 4.8%, falling rapidly. Hence, it is quite probable that in 2022 it will drop under 4%, and the regulator will start increasing the rate.
Another sign of the unemployment rate shrinking is high demand for workforce in the USA. There are workplaces but people are in no hurry to take them. The government is cancelling COVID payments already, trying to stimulate the labor market, but this has no influence on employment.
If the interest rate increases, you should take a look at the beneficiaries of this event.
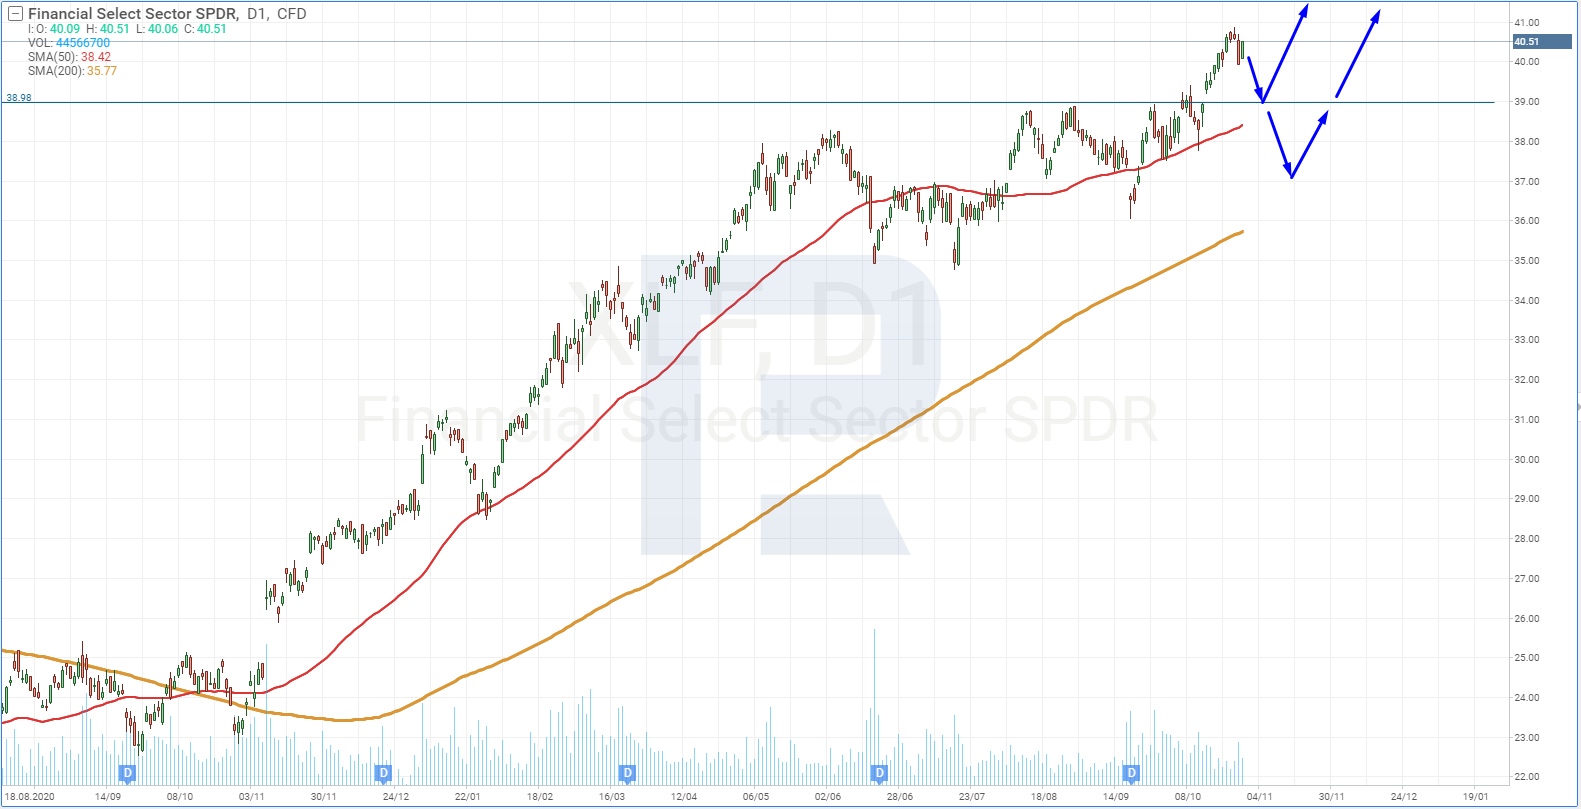
Financial Select Sector SPDR Fund
An increase in the discount rate increases the cost of loans, and money is worked with by financial entities. This means that they will have the best situation for building up profits. Looking for the shares of a bank is not the best option because the possibility of a mistake is high. However, you can invest in the whole financial sector via ETFs. In particular, take a look at Financial Select Sector SPDR Fund (NYSE: XLF).
This trust invests in the securities of companies that work in:
- Financial services
- Insurance
- Banks
- Investment trusts
- Loans and mortgage
The largest share of the trust portfolio is taken by Berkshire Hathaway Inc. (class B) — 12%; then goes JPMorgan Chase & Co — 11.33%, and the last but not the least — Bank of America Corp. — 7.9%.
The quotations of the trust are trading at their all-time high, so buying at such a price is rather risky. I would rather wait for the price to drop to the 50-days Moving Average and only then would open a position.
Simplify Interest Rate Hedge ETF
There is one more peculiar investment option for the growing interest rate. On May 17th, an ETF called Simplify Interest Rate Hedge ETF (NYSE: PFIX) was founded. It is meant for hedging from the growth of the interest rate. Apart from hedging, it can be used for normal trading.
When the interest rate is at its lowest, the acute part of the crisis is over, and the rate is likely to grow, choosing this ETF looks logical.
It works with instruments available to institutional investors who hegde their portfolios. In particular, the ETF buys swap contracts for 20-years treasury bonds at 4.25%. One can only make a profit on those contracts when they are executed and the rate rises above 4.25% (currently, it is under 2%).
Final price of a swap contract fluctuates depending on market expectations. If investors count on a steep increase in the interest rate in the future, the price of the swap contract grows, which also makes the share price of Simplify Interest Rate Hedge ETF grow. This might be a bit complicated for a beginner, yet this instrument is used by institutional investors at which experts work, and they are comfortable with such trades.
If you take a look at the chart of Simplify Interest Rate Hedge ETF, you will see them trade at their local lows, which makes the purchase less risky. Moreover, the quotations have risen above the 200-days Moving Average, indicating a possible uptrend. A breakaway of the resistance level of 42 USD will be yet another signal for further growth of the price.

The shares of this trust suit speculative trading only but not long-term investments because after the interest is increased and inflation taken under control, investors will be waiting for a decrease in the rate, which will make the share price drop.
Closing thoughts
This article offers two investment options while the market is waiting for the US Fed to increase the interest rate.
The first and simplest option is investments in the sector of finance, but the quotations of the ETF I offer are at their all-time highs, which is not too good for opening a position because a correction might start at any moment.
The second option is speculative and, I think, more predictable in terms of the result because the Fed is really unlike to drop the rate below 0.25 (they do not even mention this), while it is really likely to increase the rate. However, it is always up to you to choose.


