How to Use On Balance Volume Indicator

6 minutes for reading
This article is devoted to using the On Balance Volume indicator. It connects changes of the price of a financial instrument with the trade volume.
What does OBV show?
The On Balance Volume (OBV) indicator demonstrates price fluctuations in accordance with changes in the trade volume over a certain time. The indicator was devised in the 1960s by an investor and financial analyst Joseph Granville and remains up-to-date still.
OBV is quite a simple yet efficient indicator. It does not use averaging, hence it has no lag. The indicator is based on the theory that any serious change in the trade volume can provoke a price surge. The author of the indicator compared volume to the steam that pushed forward a steam train.
Calculation method and appearance of OBV
- If the closing price of the current candlestick is higher than the closing price of the previous one, then the trade volume over this period is added to the indicator value.
- If the closing price of the current candlestick is below the closing price of the previous one, the volume is detracted from the indicator volume.
- If both closing prices coincide, OBV does not change.
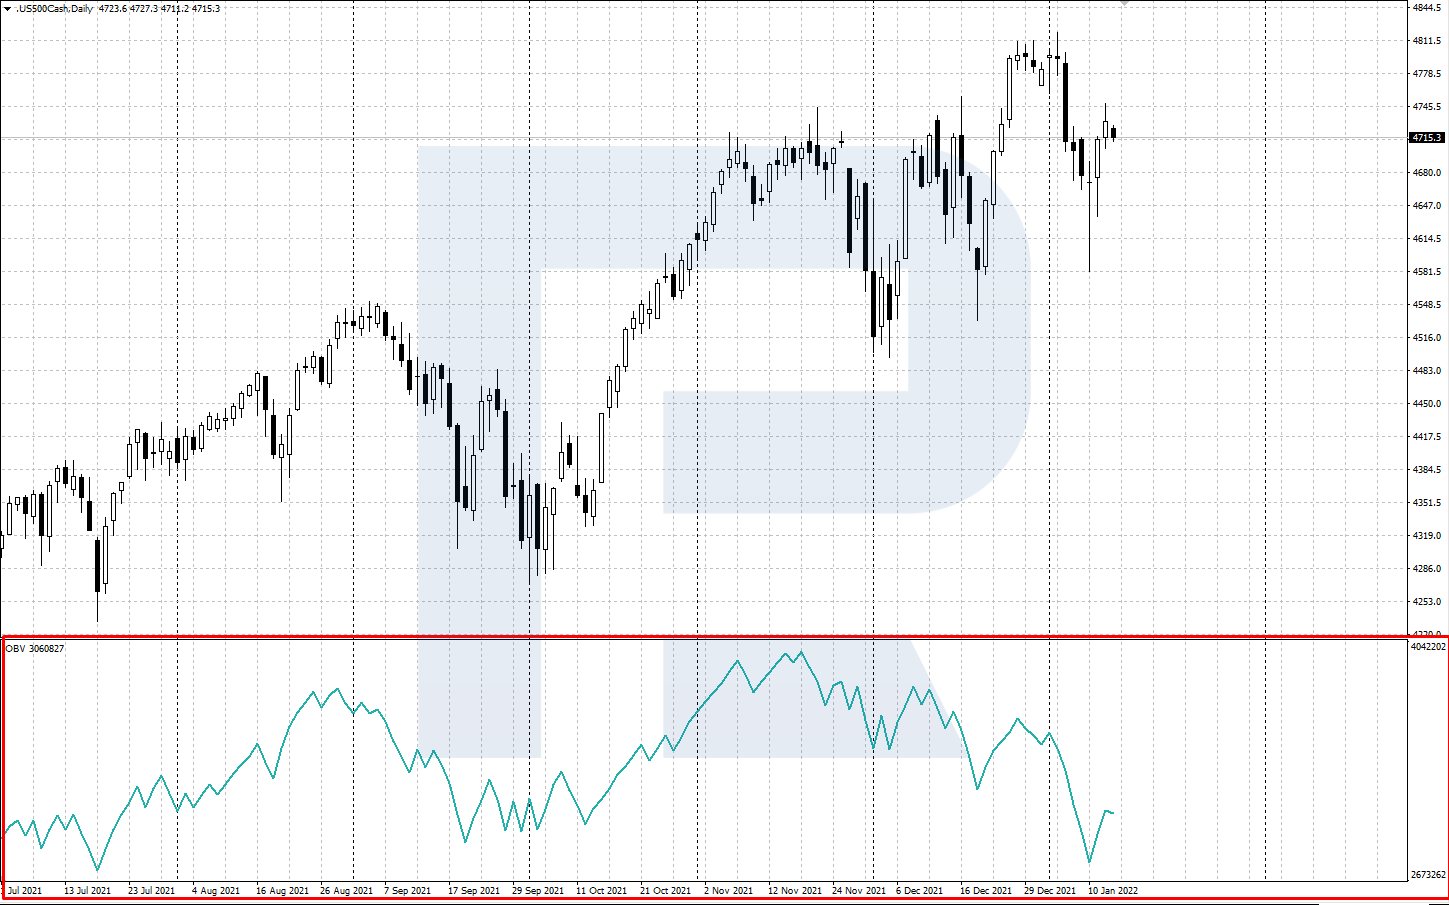
OBV is represented in a separate window under the price chart as the main calculation line. The dynamics of the line shows whether trade volumes confirm the current market trend. OBV is pre-installed on most trading platforms, including MetaTrader 4 and MetaTrader 5.
OBV characteristics and settings
To install OBV on the chart of your instrument on MetaTrader 4 or MetaTrader 5, click Main Menu/Insert/Indicators/Volumes/On Balance Volume.
Calculation formulas are as follows:
- If the closing price of the current period is above the closing price of the previous one:
OBV = OBV (n-1) + Volume
- If the closing price of the current period is below that of the previous one:
OBV = OBV (n-1) - Volume
- If the closing price of the current period is the same as in the previous one, the value does not change:
OBV = OBV (n-1)
In the formulas:
- OBV is the current value.
- OBV (n-1) is the value of the previous period.
- Volume is the current trade volume.
Note that most useful is the real trade volume in the stock and commodity markets. In Forex, we use the so-called "tick volume", which is quite relative but still can be used for trading.
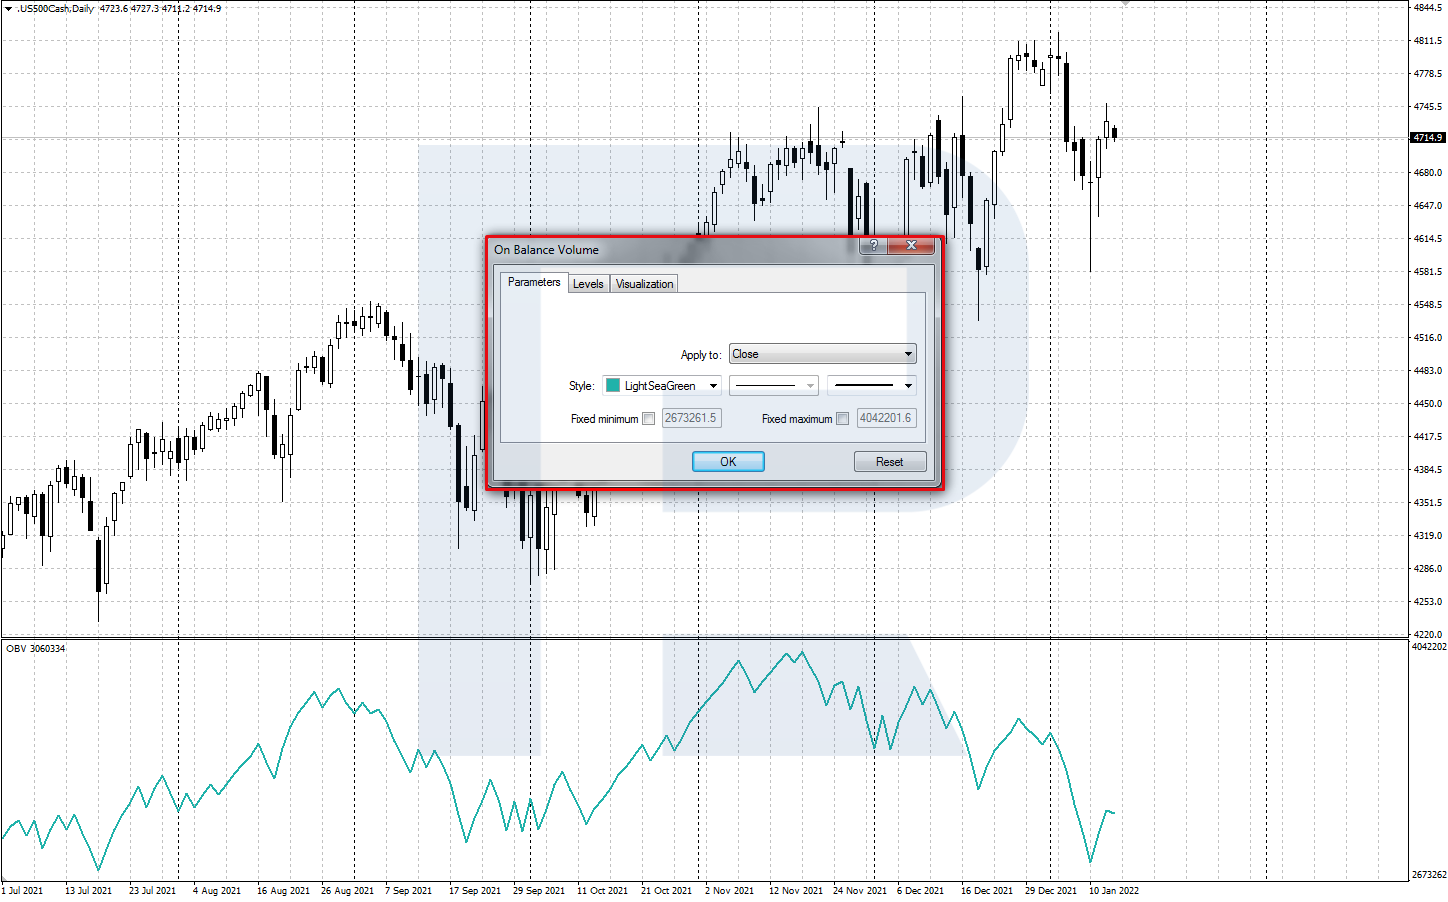
When installing OBV, you can alter the following parameters in the settings window:
- "Apply to" — choose the price that the indicator calculations will be based on. By default, this is the Close price.
- "Style" — you can choose the color, width, and type of the indicator line.
Using OBV for trading
Trading with OBV requires larger timeframes (H1 and higher) and two main signals — trend confirmation and a divergence of the indicator line and the price chart.


Current trend confirmation
When forming highs on the chart get confirmed by equally growing highs of the indicator, this means there is a stable uptrend. And vice versa: when new price lows on the chart get confirmed by the renewing lows of the indicator line, the current downtrend is strong.
For trading, you can use important support/resistance levels:
- If the price breaks upwards a strong resistance level, and the indicator line simultaneously renews its local high, you can open a buying trade.
- When the price breaks downwards an important support level, and the indicator line confirms the breakaway by renewing its local low, use the signal for selling.
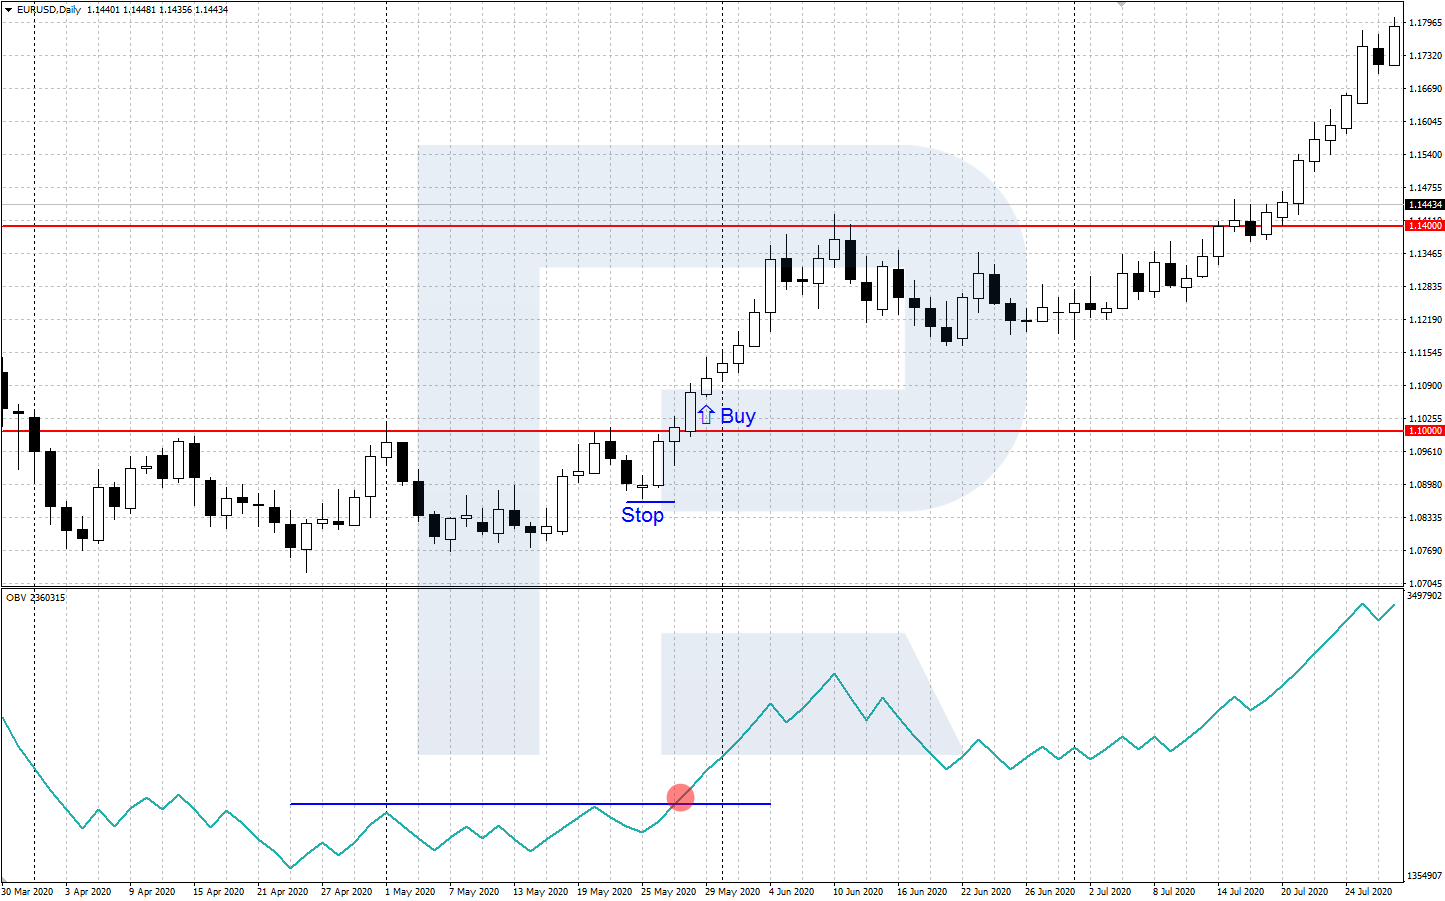
Example:
- On D1 of EUR/USD in an uptrend a strong resistance level of 1.1000 gets broken away.
- The OBV line confirms the breakaway, rising above its previous highs. Hence, you can open a buying position.
- Place a Stop Loss behind the broken level and take your Profit after a strong resistance level is reached.


Divergence
A divergence appears when the extremes of the indicator and the price chart do not coincide.
- A bullish divergence (a signal to buy) appears when the price chart forms a new low under the preceding one while the OBV low turns out to be above the previous one. Trade volume does not confirm the strength of the bears. After a divergence forms and the price reverses upwards, buying is recommended.
- A bearish divergence (a signal to sell) appears after a new high on the price chart turns out to be higher that the previous one, while the high on the OBV line fails to rise above the previous one. Trade volumes shrink, demonstrating the weakness of bulls. After a divergence and price reversal downwards, selling is recommended.
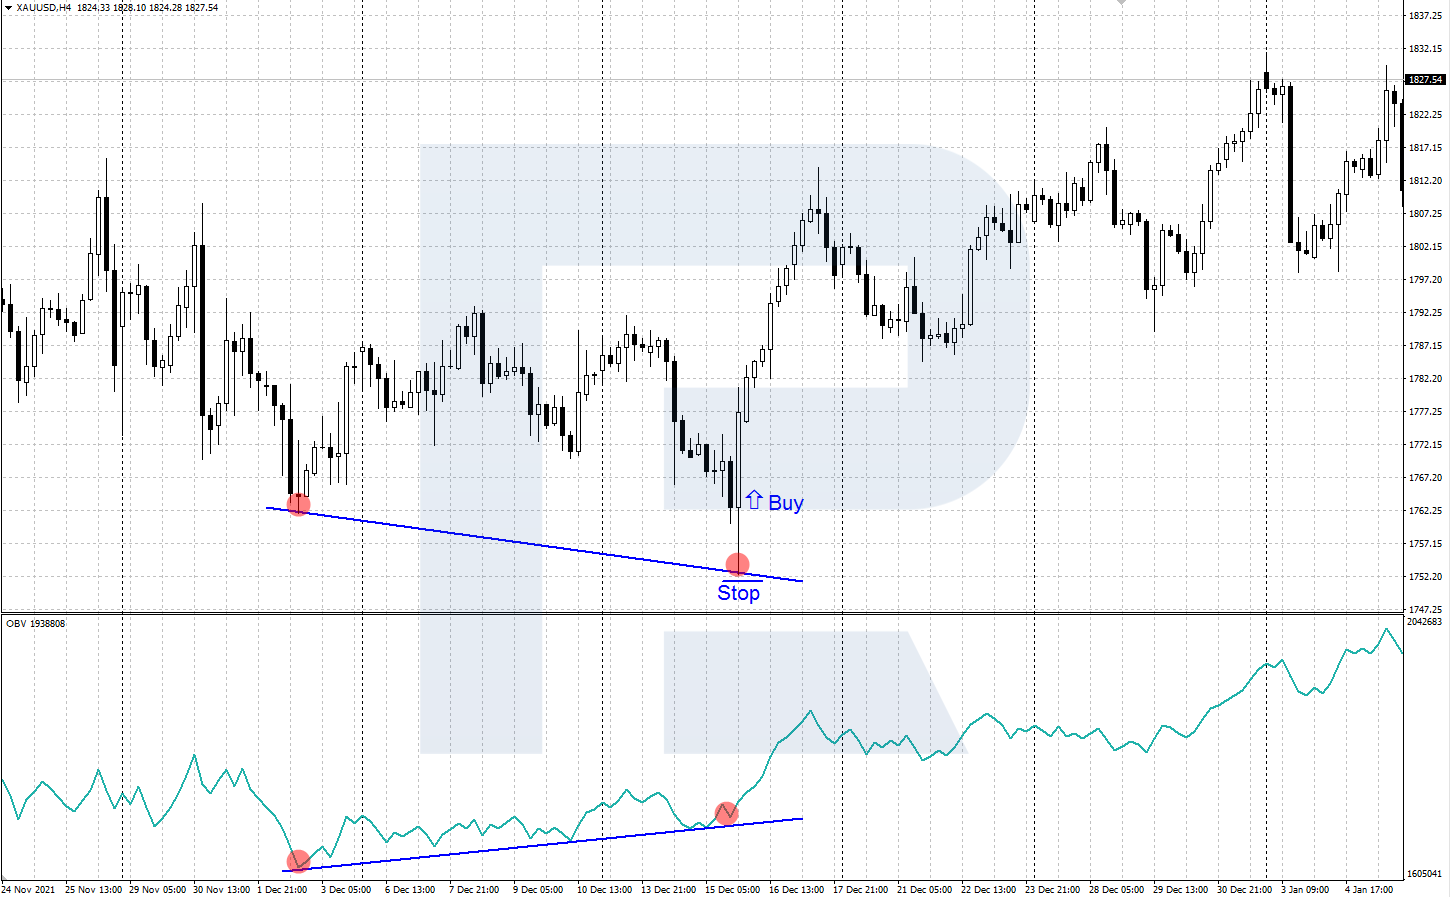
Example:
- On H4 of XAU/USD in a downtrend a bullish divergence has formed: gold chart renewed its lows while OBV did not.
- After the price reverses upwards, open a buying position.
- Place your Stop Loss behind the local low and take your Profit as soon as the price approaches an important resistance level.
Closing thoughts
The On Balance Volume indicator bounds the price dynamics of the asset to trade volumes. Large volumes normally precede strong market movements. Apart from a general assessment of the market, OBV confirms trading signals by the trend and shows where the price might start reversing if there is a divergence. Before using the indicator for real, practice on a demo account.


