How to Set Up Charts on MetaTrader 4
4 minutes for reading
This article is devoted to working with charts on a popular platform MetaTrader 4. Charts help to track and analyze quotes movements of financial instruments, as well as to forecast their future behaviour.
How to open chart window
A new chart on MetaTrader 4 can be created several ways:
- Click File – New Chart, and then choose a financial instrument.
- In the Market Watch window, choose a financial instrument, left-click and drag it to the work area of the terminal.
- Right-click a ticker in Market Watch, and then click Chart Window.
- Click Window – New Window – an instrument from the list.
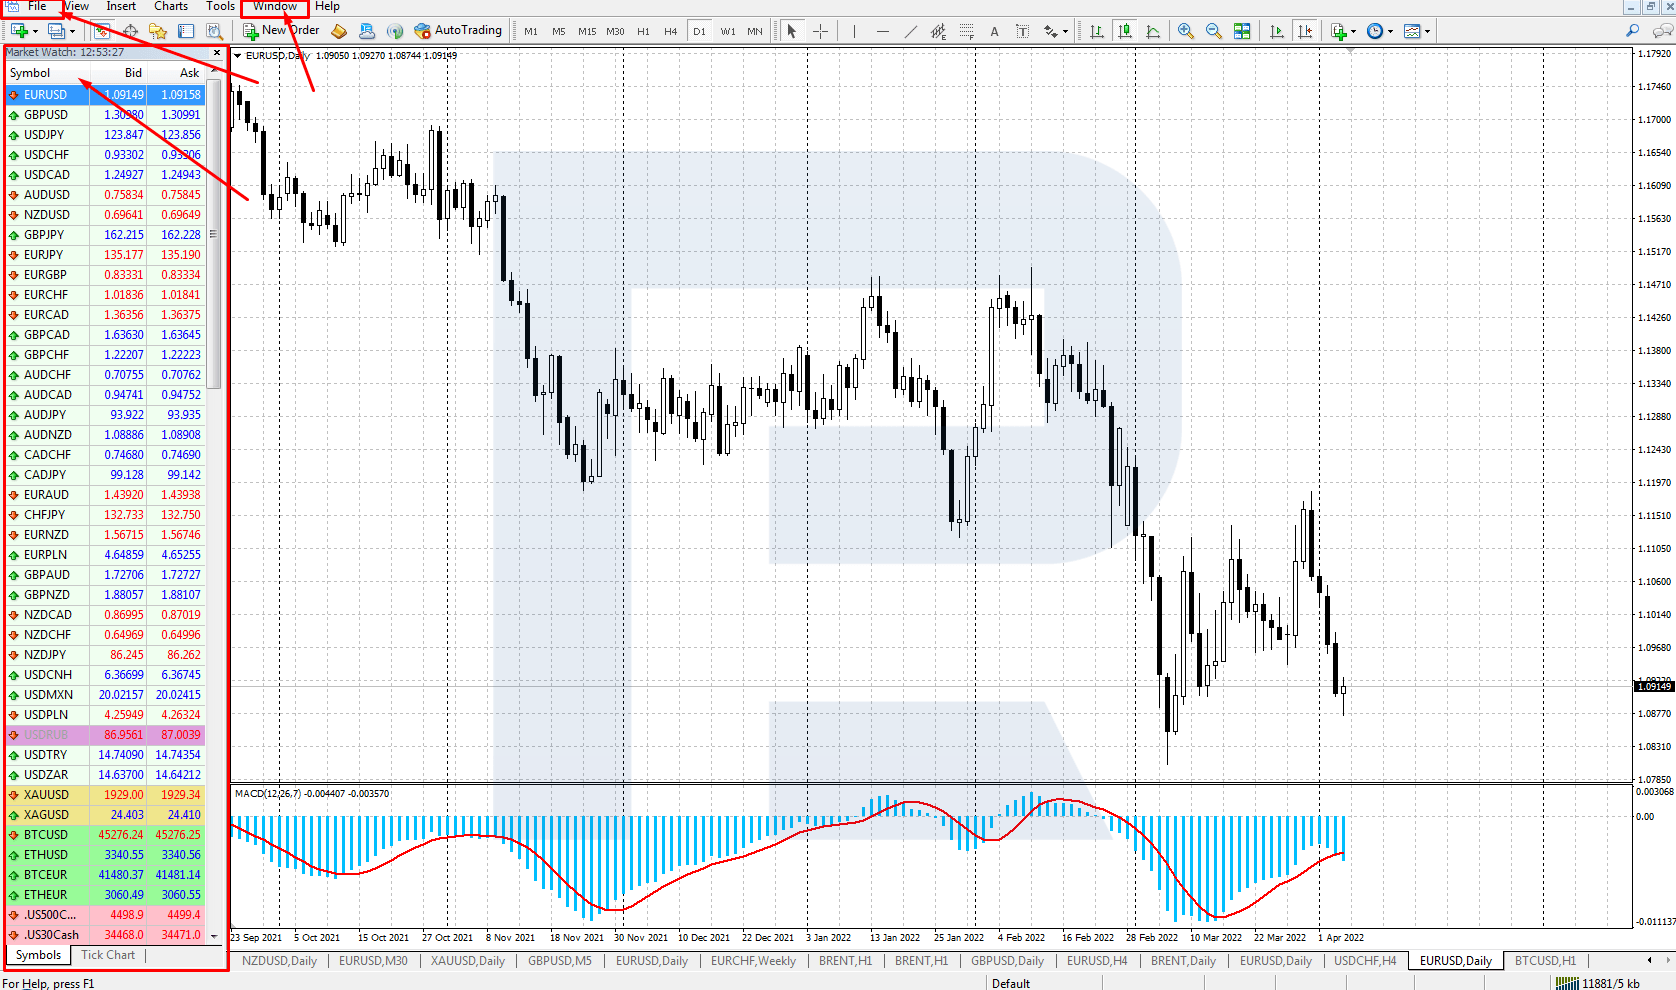
MT4 allows for opening up to 100 charts of various assets. They can be sorted out in the Window menu.
There are several arrangement patterns:
- Tile Windows
- Cascade
- Tile Horizontally
- Tile Vertically
- Arrange Icons.

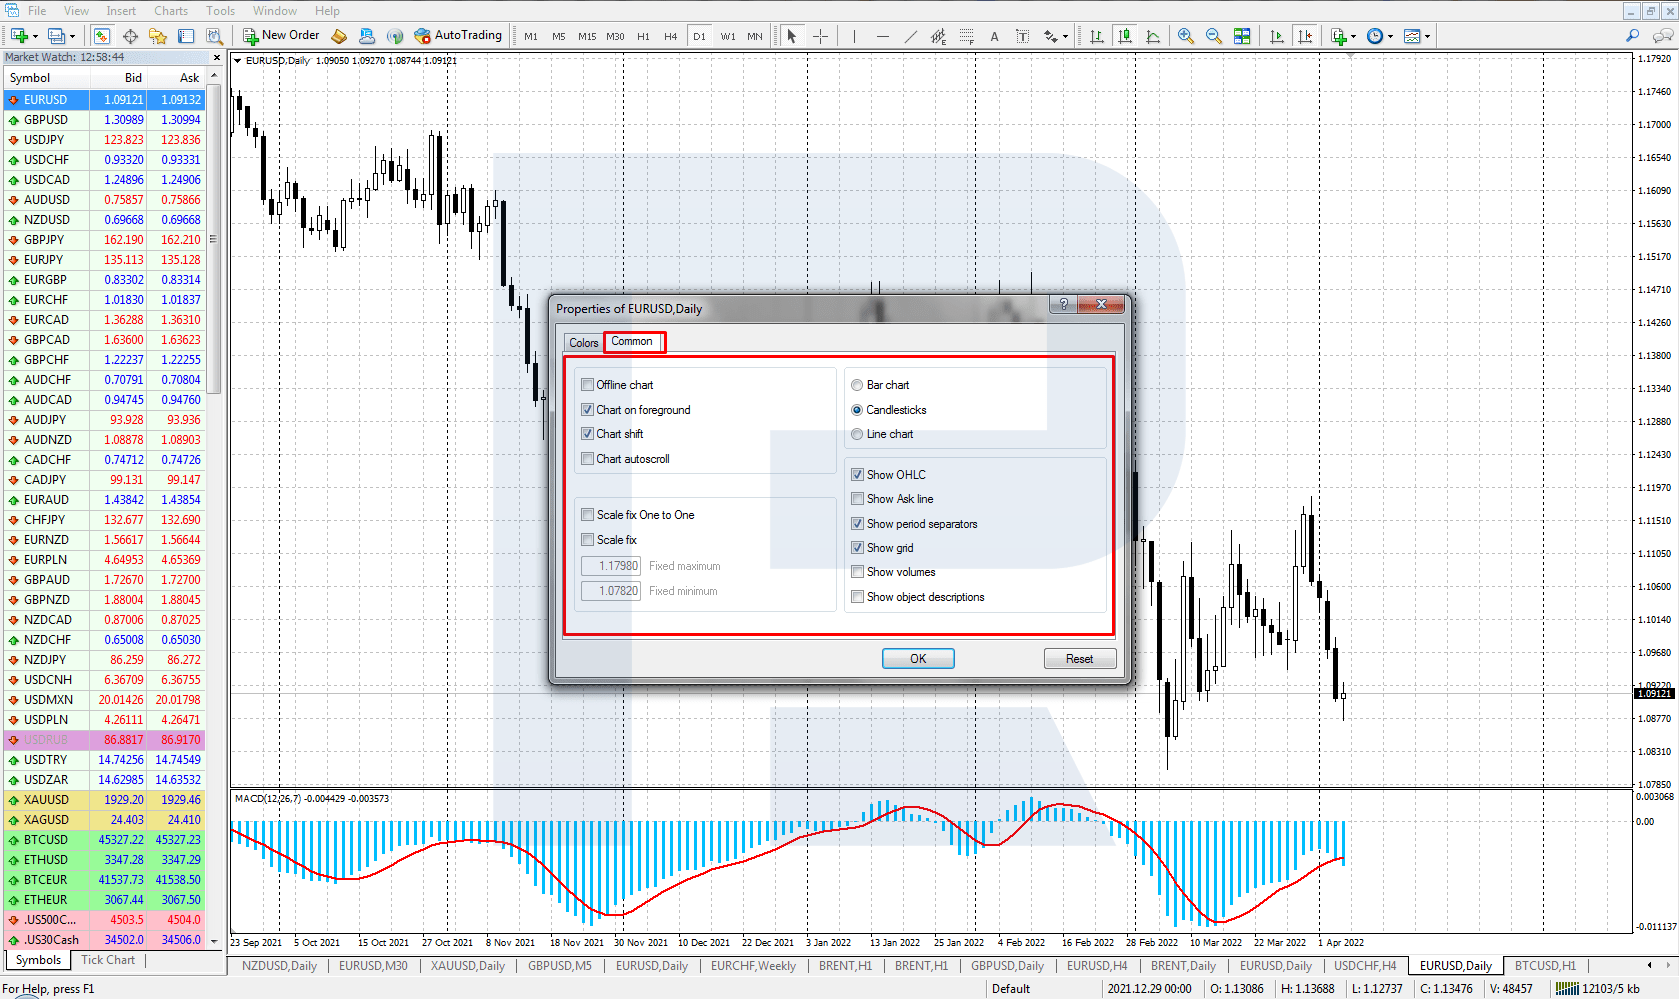
How to set up chart properties
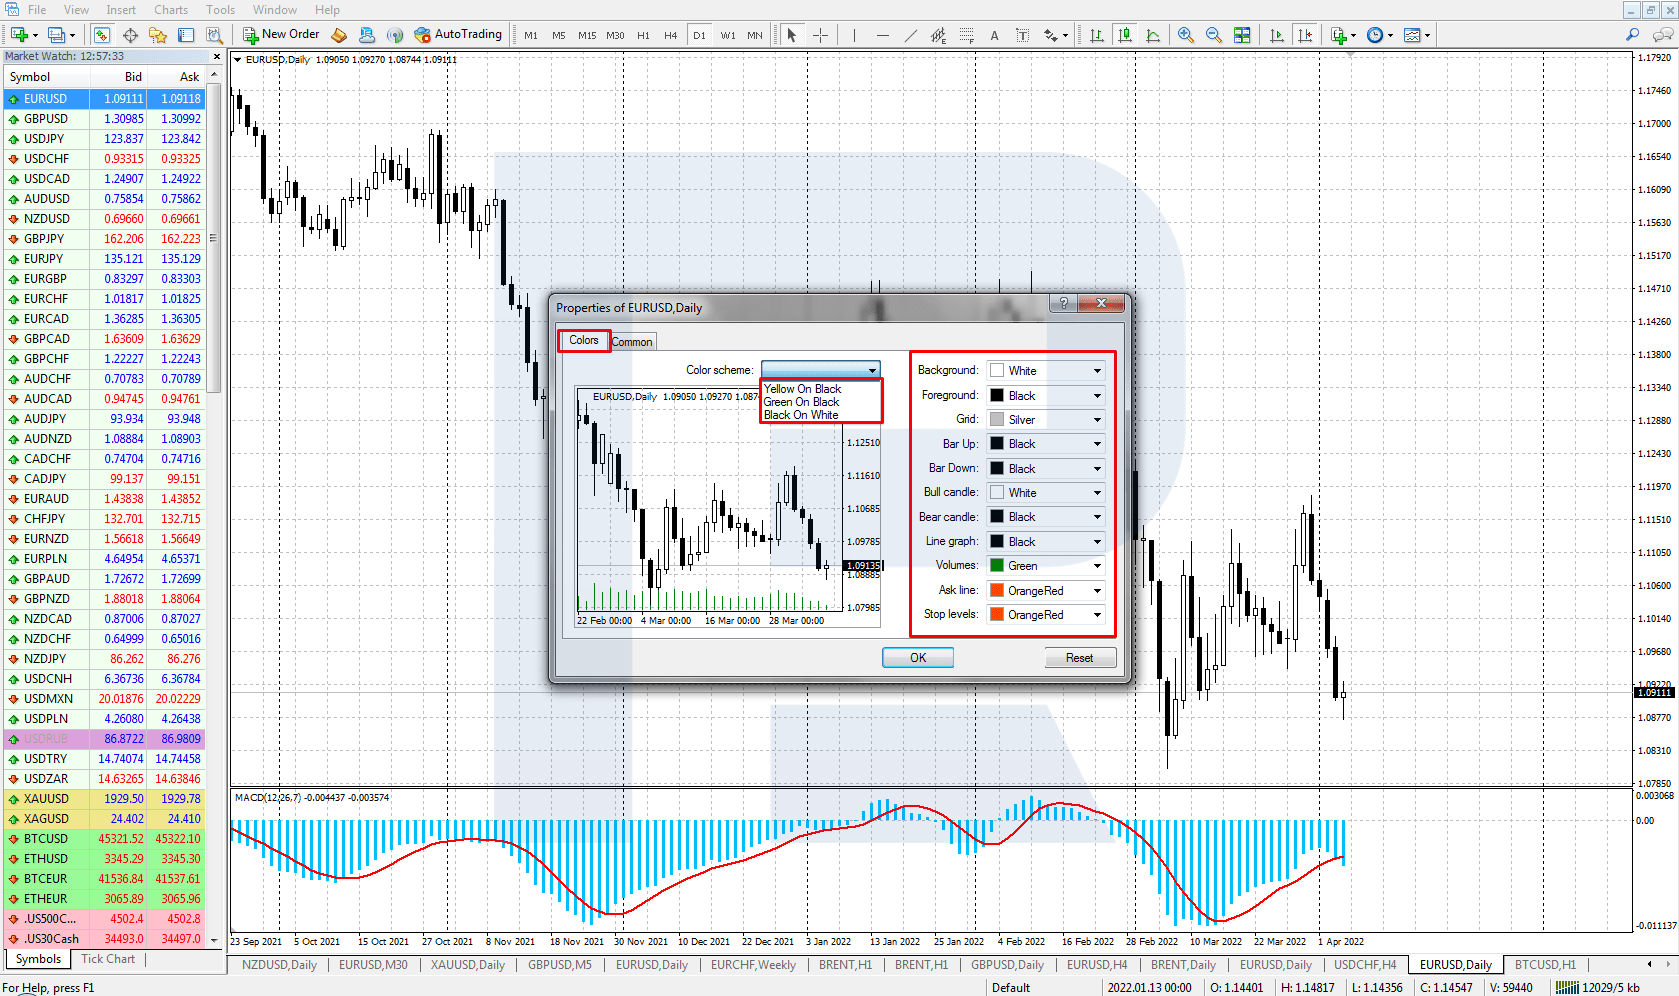
To set up chart properties, click Chart – Properties (F8). Alternatively, right-click the chart and choose Properties in the unfolding menu. A setting window will open with two tabs – Colors and Common.


Colors tab
In the unfolding window Color Scheme, choose on of the three schemes available:
- Yellow on Black
- Green on Black
- Black on White.
Also, you can design your own colour scheme, setting up colours of each element:
- Background
- Foreground
- Grid
- Bar Up
- Bar Down
- Bull Candle
- Bear Candle
- Line Graph
- Volumes
- Ask Line
- Stop Levels
Common tab
In this tab, 4 main chart parameters can be set up.
1. Chart type:
- Japanese candlesticks
- Bars
- Line graph
2. Chart properties:
- Autonomous chart: it does not update quotes, keeping them fixed;
- Graph forward: the price is at the foreground, other objects are at the back.
- Shift: the graph shifts to the left from the price scale.
- Autoscroll: the chart constantly demonstrates the last candlestick.
3. Scale:
- Autoscale (default)
- Fixed scale
4. Instrument representation:
- OHLC: in the upper left corner, fresh price information (Open, High, Low, Close) is showed;
- Ask line: charts are drawn by Bid prices; if Ask price is necessary, choose this option;
- Timeframe delimiter: vertical lines separate timeframes on the chart;
- Grid: the chart is marked by grid cells;
- Volumes: tick volumes are indicated at the bottom of the chart;
- Object description: all objects on the chart get a description.
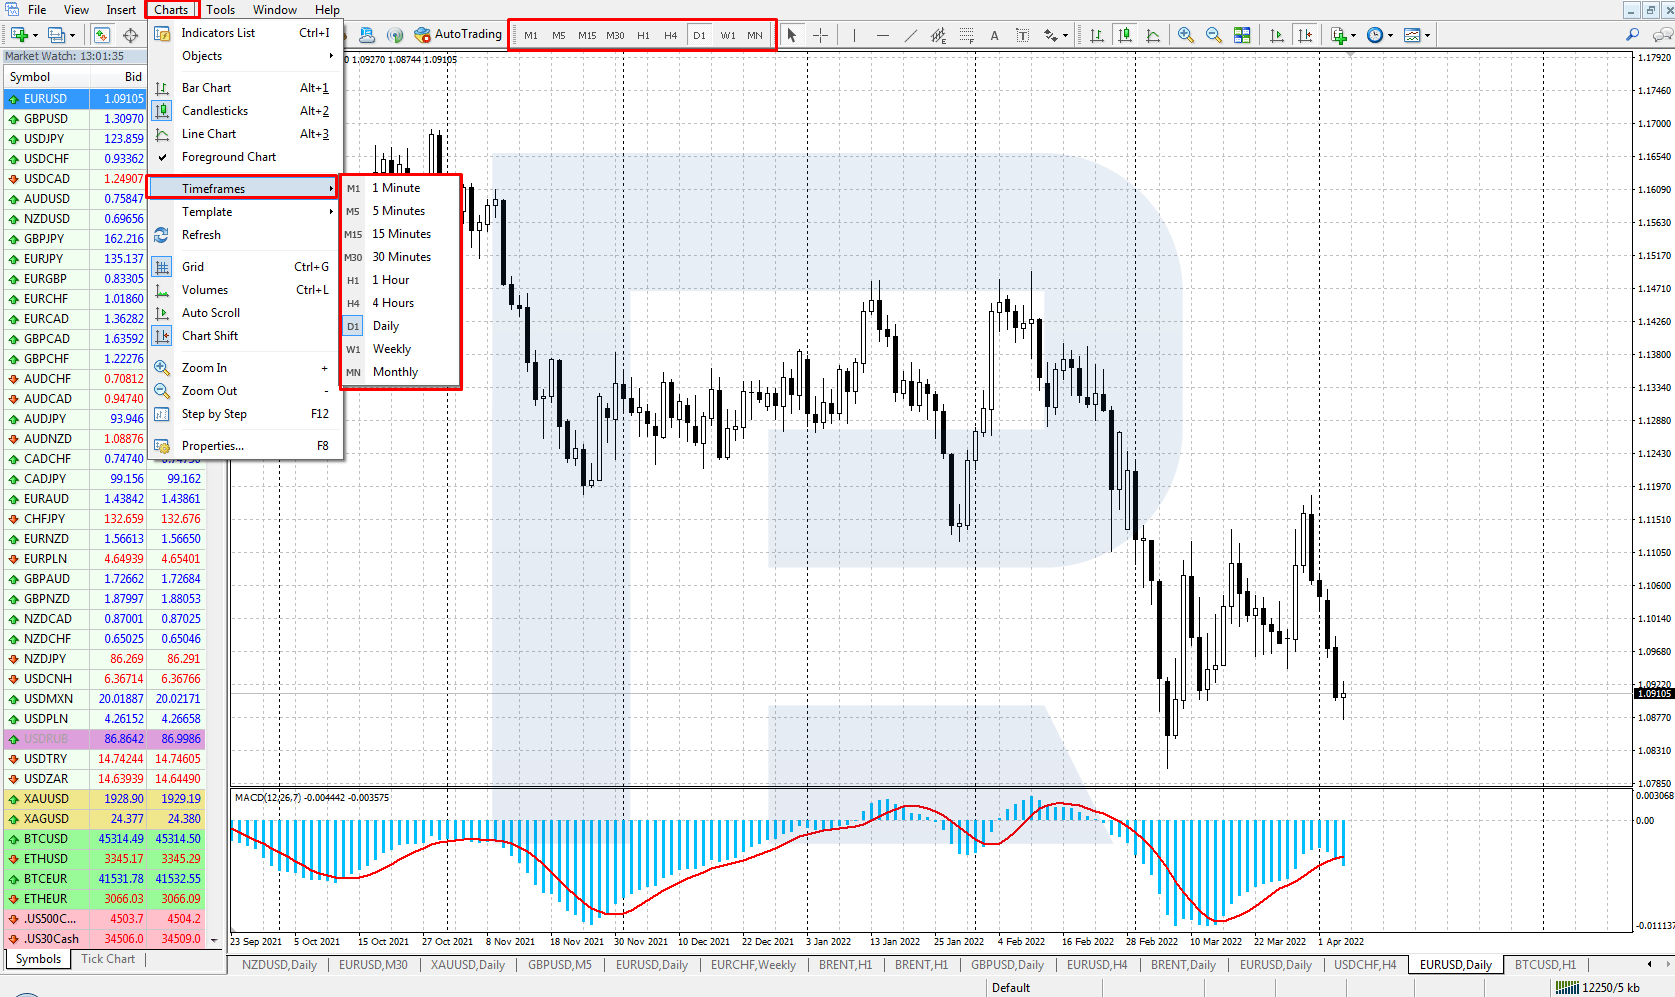
How to change timeframes
To change the TF, click Charts – Timeframes – and choose the one you need. Moreover, use active buttons in the upper terminal menu.
Available timeframes:
- M1 – 1 minute
- M5 – 5 minutes
- M15 – 15 minutes
- M30 – 30 minutes
- H1 – 1 hour
- H4 – 4 hours
- W – 1 week
- MN – 1 month.
Adding indicators to the chart
To add indicators to the chart click Insert – Indicators and choose the one you need. Alternatively, click an active button with a green cross in the upper menu.
MT 4 features many popular indicators of the following groups:
- Trend
- Oscillators
- Volumes
- Bill Williams
- Custom (indicators added by the user).

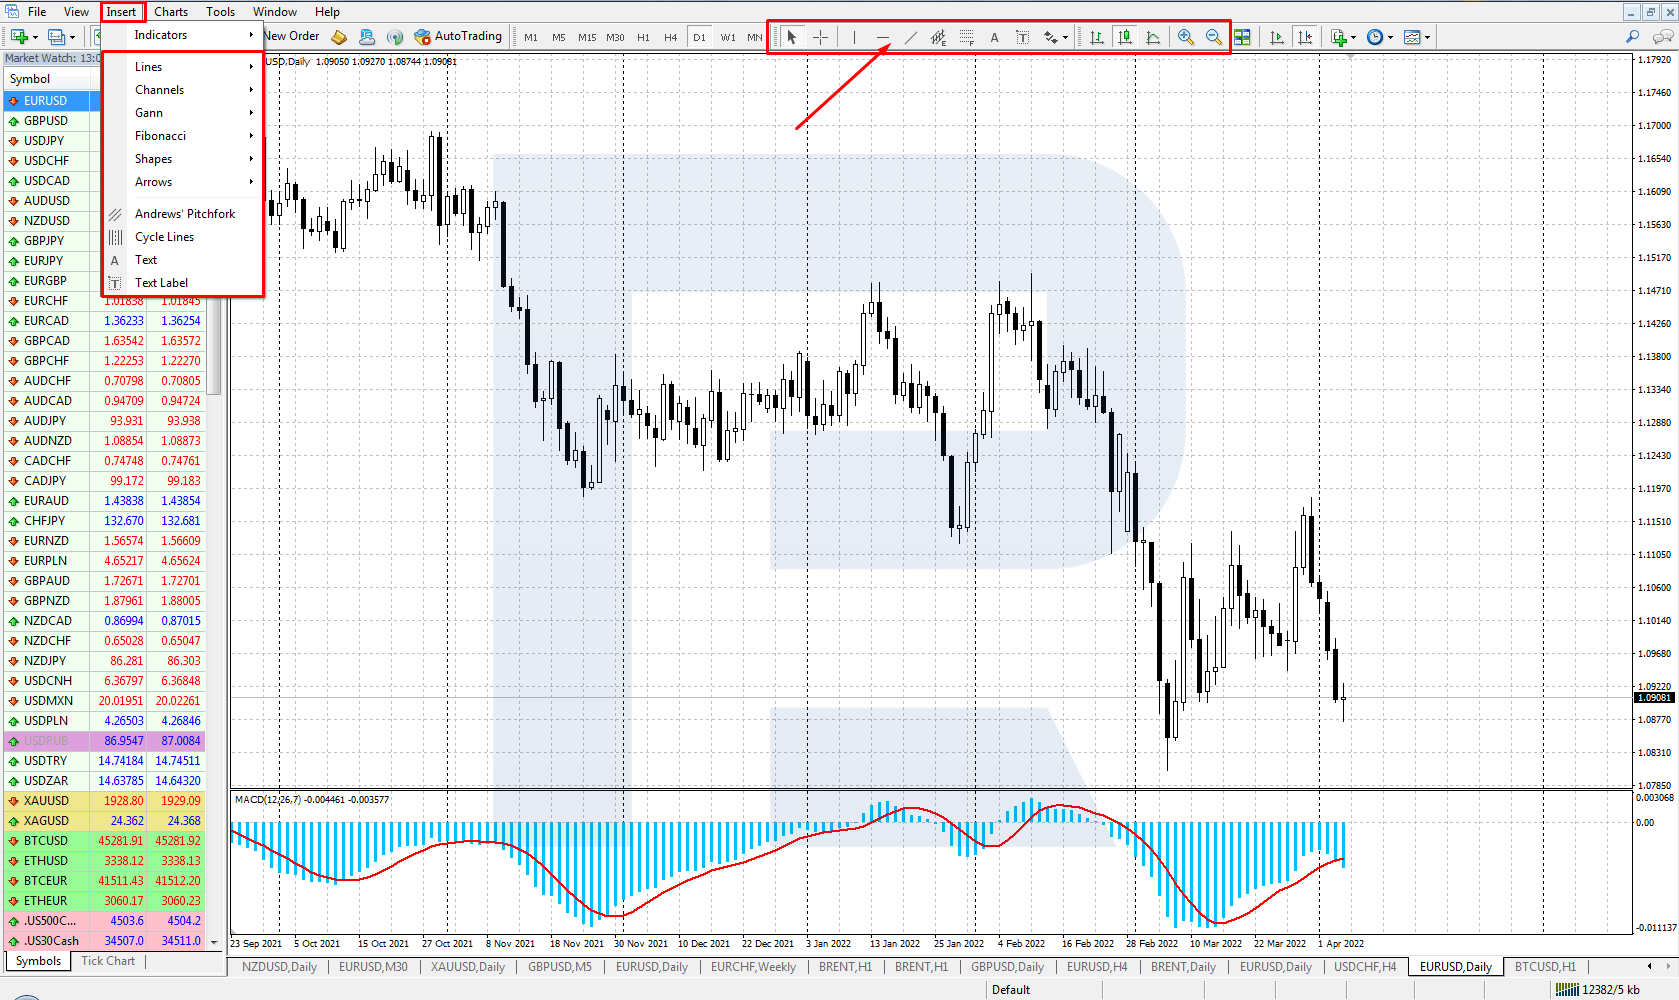
How to add graphic instruments
To add various instruments to the chart, click Insert or corresponding active buttons of the upper menu.
There are several groups of instruments:
- Lines (inclined, vertical, horizontal)
- Channels
- Gann
- Fibonacci
- Shapes
- Arrows (and icons)
- Andrews Pitchfork
- Cycle Lines
- Text
- Text Label.


How to save chart template and profile
After editing is complete, you can save your settings as a template. Saved settings will then be applied to newly opened charts.
To save your settings, right-click the chart and choose Template – Save Template – enter name. The template can than be uploaded to the chart the same way: right-click – Template – Load Template – choose the one you need.
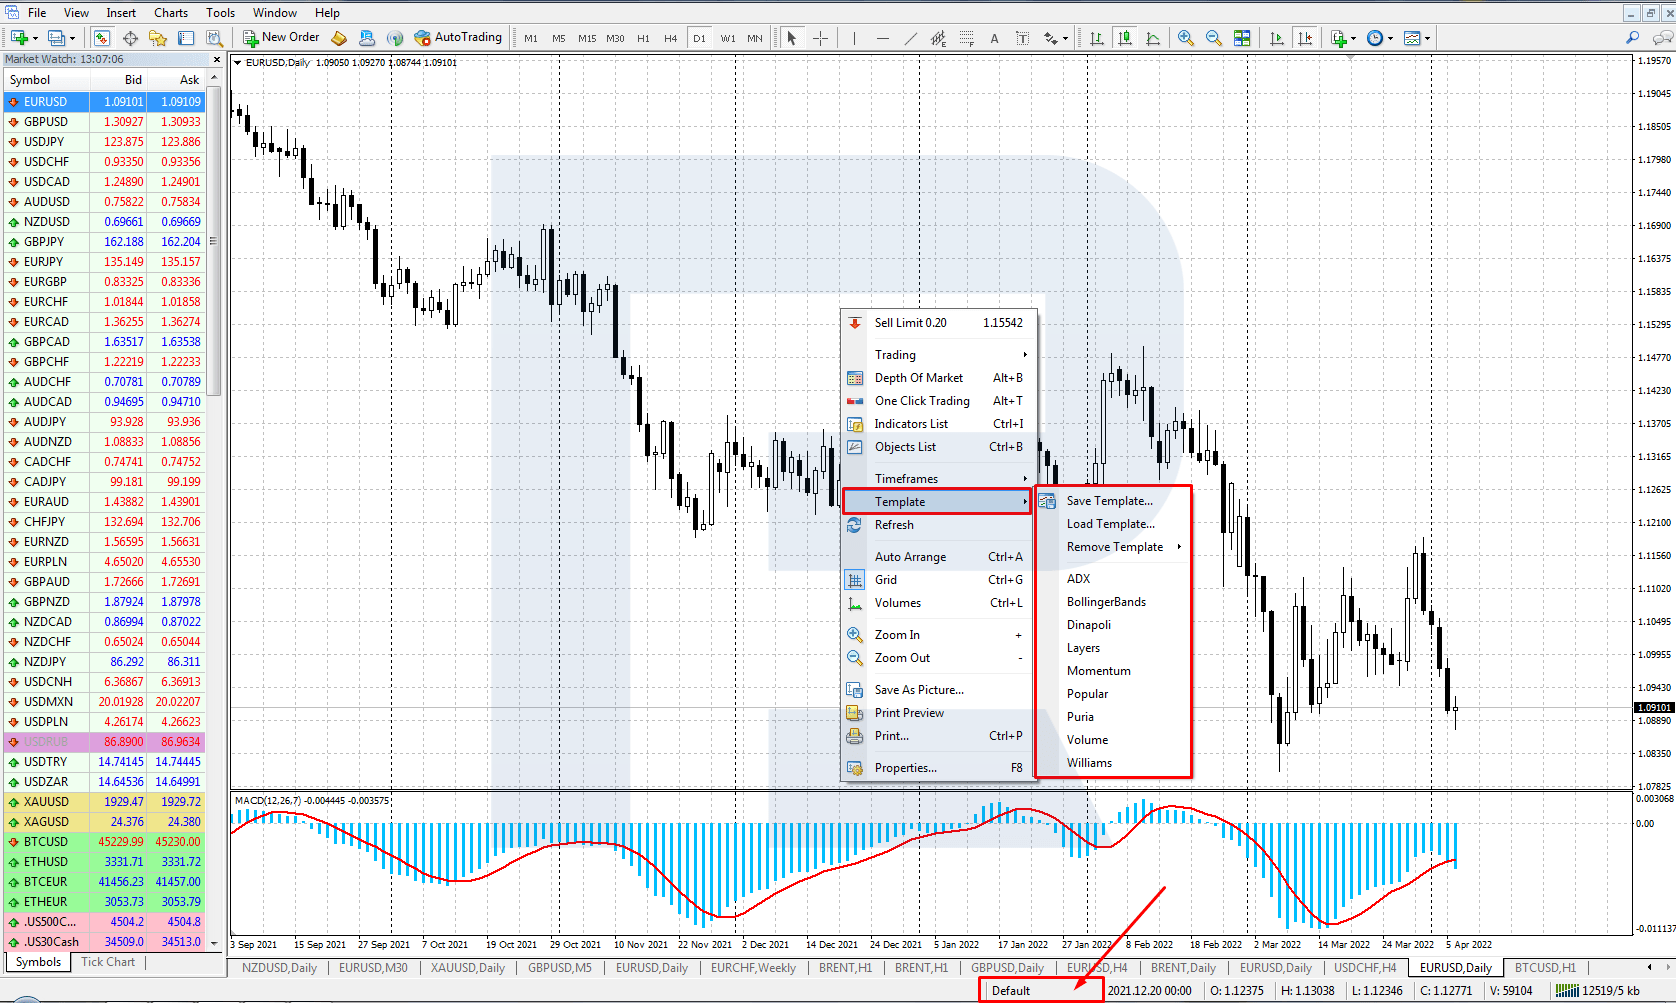
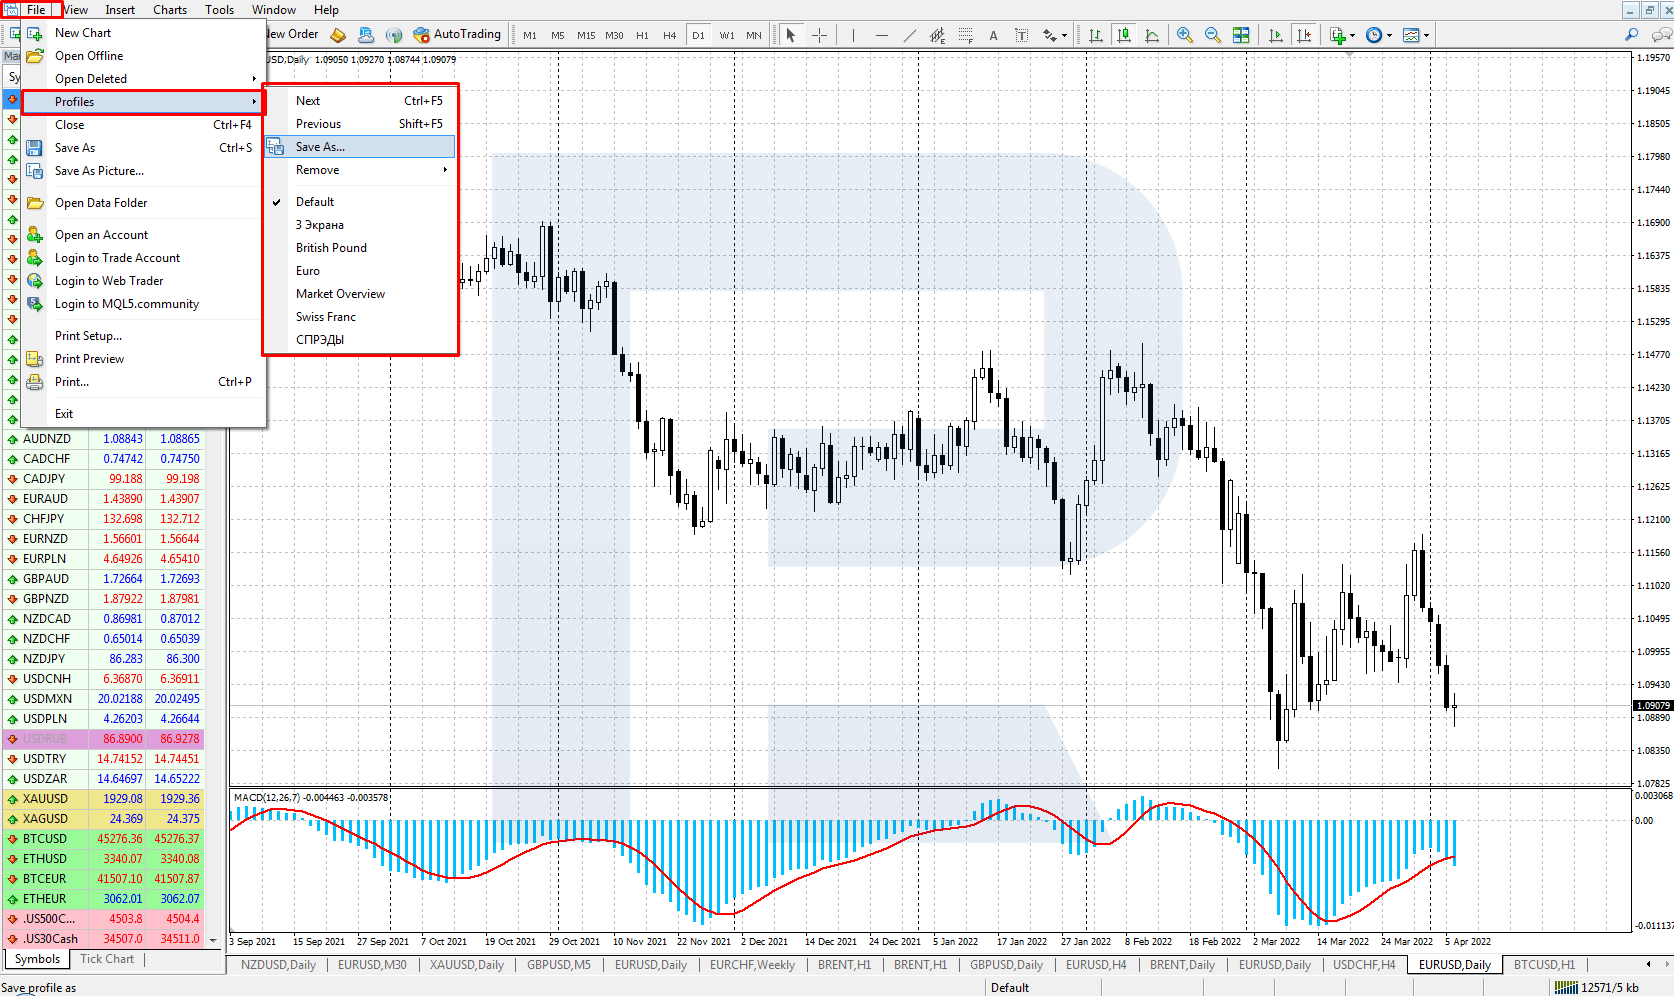
You can create different templates with various settings: chart design, indicators, and instruments. The whole set of open charts with their properties and templates is saved to a different profile.
To save the profile, click File – Profiles – Save As – enter name. Alternatively, click a button with the name of the active profile at the bottom of the terminal and choose the one you need from the unfolding list.
Closing thoughts
Regardless of its quite old age – as you remember, the platform was created in 2005 – MetaTrader 4 remains one of the most popular trading programmes. There are many secrets to such success, including understandable and user-friendly ways of setting up charts of various analysis and trading instruments.
See more about MetaTrader 4 functions in the following articles: