Today, we will discuss the interaction and correlation of oil prices and the CAD.
All posts
In this article, we will discuss the main price structures only. The author has plenty of patterns in store but you do not need to know all of them to trade successfully: you can choose a couple and learn how to use them properly in compliance with your capital management rules.
In this review, we will get acquainted with trading the Diamond. This is a reversal tech analysis pattern promising a correction or a reversal of the current trend.
In this overview, we will discuss trading the Rectangle pattern. This is a universal tech analysis pattern that may be traded both individually and as a part of other patterns.
Today, we will get acquainted with the Spike pattern. It is rather rare on charts but provides decent trading opportunities.
Today, we will discuss popular and rather widespread patterns of graphic analysis Double Top, Triple Top and its opposite – Double Bottom, Triple Bottom.
In this review, we will discuss trading overbought and oversold areas. A trader may use special indicators that analyze the dynamics of price changes and show the overbought and oversold areas.
Today, we will get acquainted with a tech analysis pattern called Diamond. Compared to other tech analysis patterns, the Diamond pattern appears rather rarely on the chart.
In this review, we will discuss a well-known trading pattern - the Gartley Butterfly. You may learn to find this pattern on the chart by yourself or use the ZUP indicator, specially created for finding and drawing the pattern on the price chart.
Today, we will discuss yet another trend strategy called Three-Drive or Three Indians. It may have other names but the idea of the strategy and its signals remains the same.
In this review, we will discuss a well-known trading strategy called the Golden Cross. This simple and efficient strategy uses two Moving Averages with different periods.
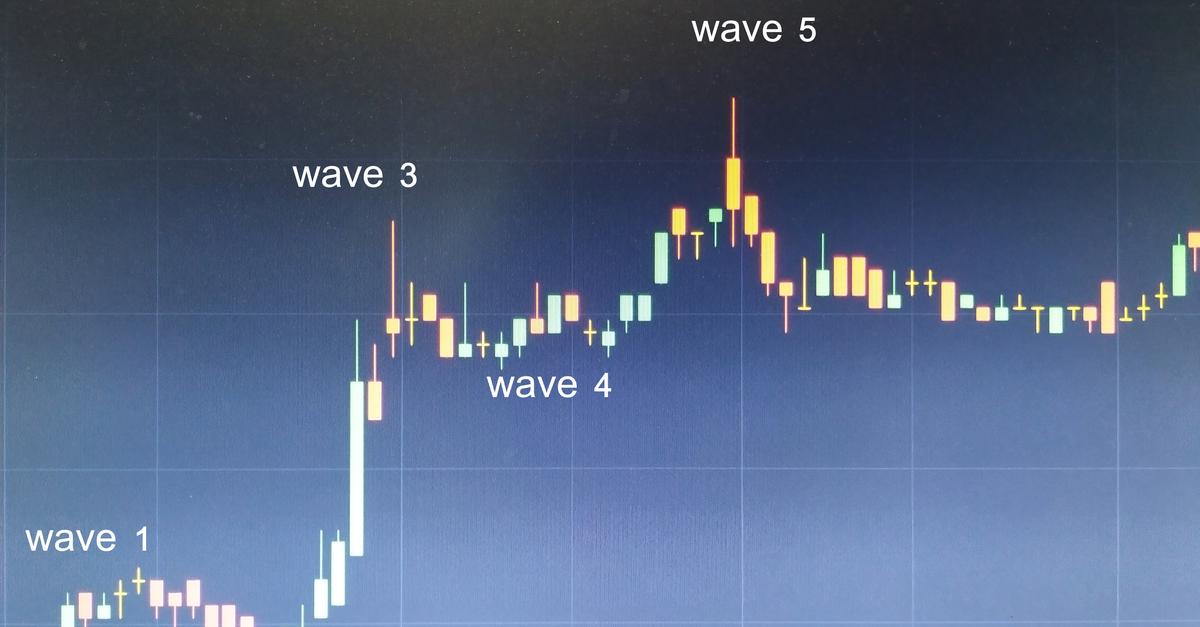
lliott Wave Theory is a unique and independent analytical instrument that, with certain experience, yields impressive results. However, the Theory has not been formalized yet, does not have a shape of a trading system, hence, the result depends on the subjective interpretation of the analyst-trader.
In this article, we will speak about the inner structure and the peculiarities of market waves. We will discuss the multilevel model of the market cycle and its consistent parts – subwaves of various complexity and levels.
Trendlines can show where to enter in the direction of the trend and where the current trend might end.
In the article, we will discuss horizontal support and resistance levels: how to draw them and how to use alongside simple indicators of tech analysis.


