Gartley Butterfly Pattern: Indicator and Trading Strategy

5 minutes for reading
In this review, we will discuss a well-known trading pattern - the Gartley Butterfly. You may learn to find this pattern on the chart by yourself or use the ZUP indicator, specially created for finding and drawing the pattern on the price chart.
Pattern history
The Gartley Butterfly pattern appeared as long ago as 1935 thanks to a famous analyst and tech analysis expert Harold M. Gartley. He specialized in stock market analysis, delivered lectures on tech analysis, and consulted Wall Street traders. In the end, Gartley's tech analysis study course turned into a book called "Profits In the Stock Market", where he first described a pattern that was later named Butterfly.
The Gartley Butterfly became popular a bit later, at the end of the 20th century. Gartley's works were improved by his followers Scott M. Carney and Larry Pesavento. The latter added the Fibonacci levels to the Butterfly to define and classify patterns more precisely. A Gartley Butterfly with perfect Fibo proportions is called the Pesavento Butterfly.
Gartley Butterfly pattern description and trading method
The Gartley Butterfly belongs to harmonic trading patterns - the ones which form by a certain scheme including Fibo levels. The pattern consists of four price movement sections (waves), the second, third, and fourth ones being, in essence, a three-wave correction of the first movement. The pattern got its name because its lines and Fibo levels on the chart look like a butterfly's wings.
The Gartley Butterfly forms on different timeframes; quite often, it acts as a trend continuation pattern for the actual trend on a larger timeframe. The pattern works well with other tech analysis instruments: trendlines, support, and resistance levels. If the pattern forms according to the Fibo relations singled out by Pesavento, it will work off more probably, however, even without them, the pattern is trustworthy.
Bullish Gartley Butterfly
A bullish (buying) pattern looks like an ascending price impulse XA followed by a three-wave correction AB-BC-CD. The pattern roughly looks as follows:
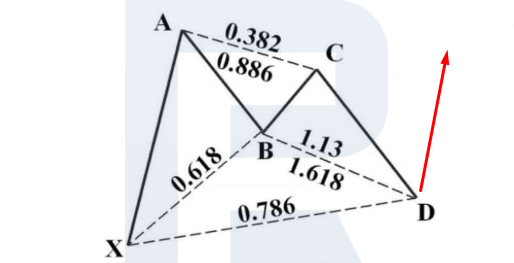
The stages of pattern formation:
- XA - the first ascending impulse of the price movement on the chart
- AB - a correction of the first ascending movement, about 61.8%
- BC - 38,2%, 50%, 61,8%, 78,6%, or 88,6% of AB length
- CD - 127,2%, 146%, 150%, or 161,8% of BC length; ends at 78.6% of XA
- After point D forms and the price reverses upwards, open a buying position. Place a Stop Loss (SL) behind the low in point D; the first goal for a Take Profit (TP) will be in point C (TP1) and the second goal - in point A (TP2).
Bearish Gartley Butterfly
A bearish (selling) pattern starts with a descending price impulse XA followed by a three-wave correction AB-BC-CD. It looks as follows:
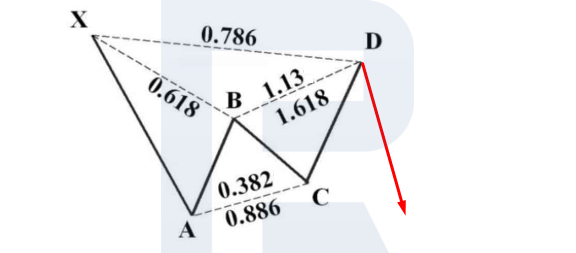
The stages of pattern formation:
- XA - the first descending impulse of the price movement on the chart
- AB - a correction of the first descending movement, about 61.8%
- BC - 38,2%, 50%, 61,8%, 78,6%, or 88,6% of AB length
- CD - 127,2%, 146%, 150%, or 161,8% of BC length; ends at 78.6% of XA
- After point D forms and the price reverses downwards, open a selling position. Place a Stop Loss behind the high in point D; the first goal for a Take Profit will be in point C (TP1) and the second goal - in point A (TP2).
Finding the pattern and trading with the ZUP indicator
There are various computer indicators meant for finding the Gartley Butterfly pattern on the chart. The most famous and popular indicator is ZUP that finds and draws the Gartley Butterfly on the chart automatically. There are several versions of this indicator that feature different settings.
Any version of ZUP is rather complicated, with lots of settings. We will not discuss them in detail today because the indicator works very well with default settings. You may find setting description in the indicator file, opening it via MetaEditor.
To install ZUP in MetaTrader 4 open the file via the Main Menu of the terminal (you can download file with the ZUP indicator in the botton of this post). Open FIle - Open data catalogue - MQL4 - Indicators. Copy the files of the indicator to this folder and relaunch the terminal. ZUP will be then added to User indicators, so you will be able to open it via Insert - Indicators - User - ZUP.
Alternatively, you may just drag the indicator to the chart of your instrument, left-clicking it in the Navigate window. After installed on the chart, the indicator will automatically find and mark blue different variants of the Gartley Butterfly:
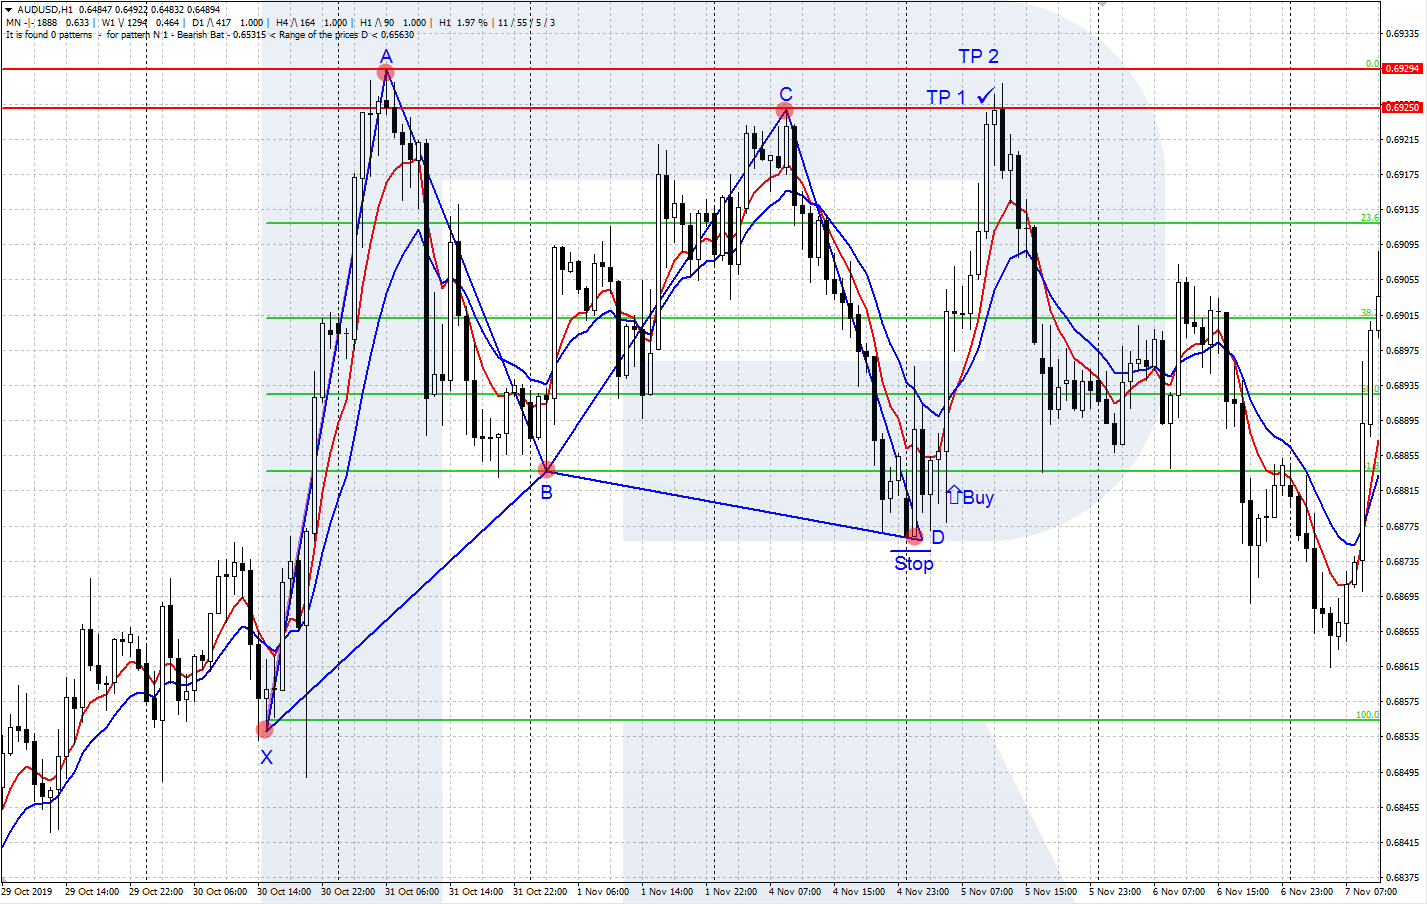
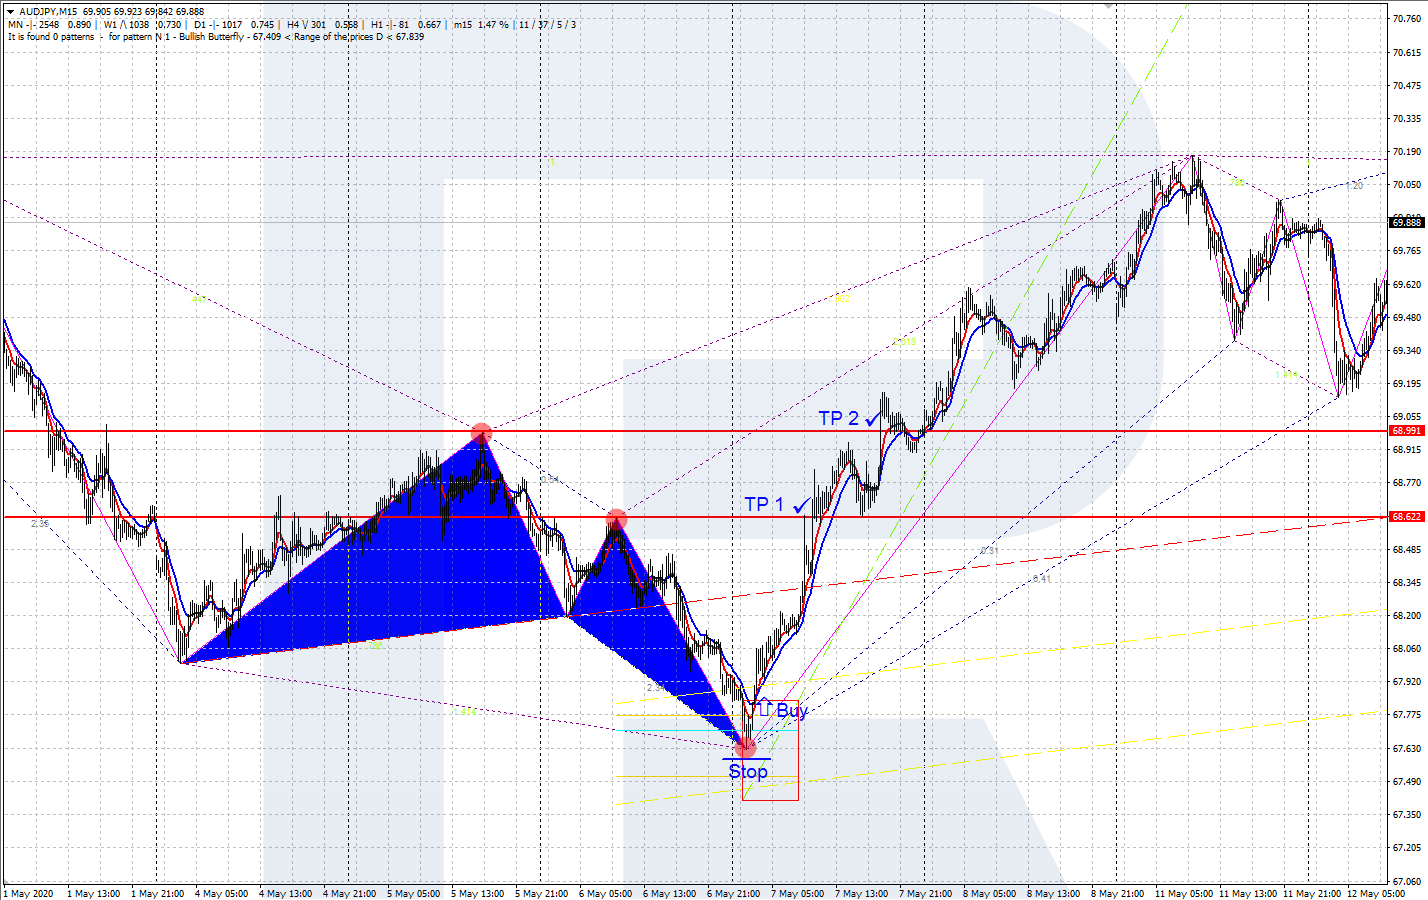
Example of a buying pattern
On M15 of AUD/JPY, the indicator marked a buying pattern, with the area for the buy enclosed in a rectangle. After the price reverses upwards, open a buying trade with an SL behind the last low of the pattern and TPs - on the two upper points of the "wings".
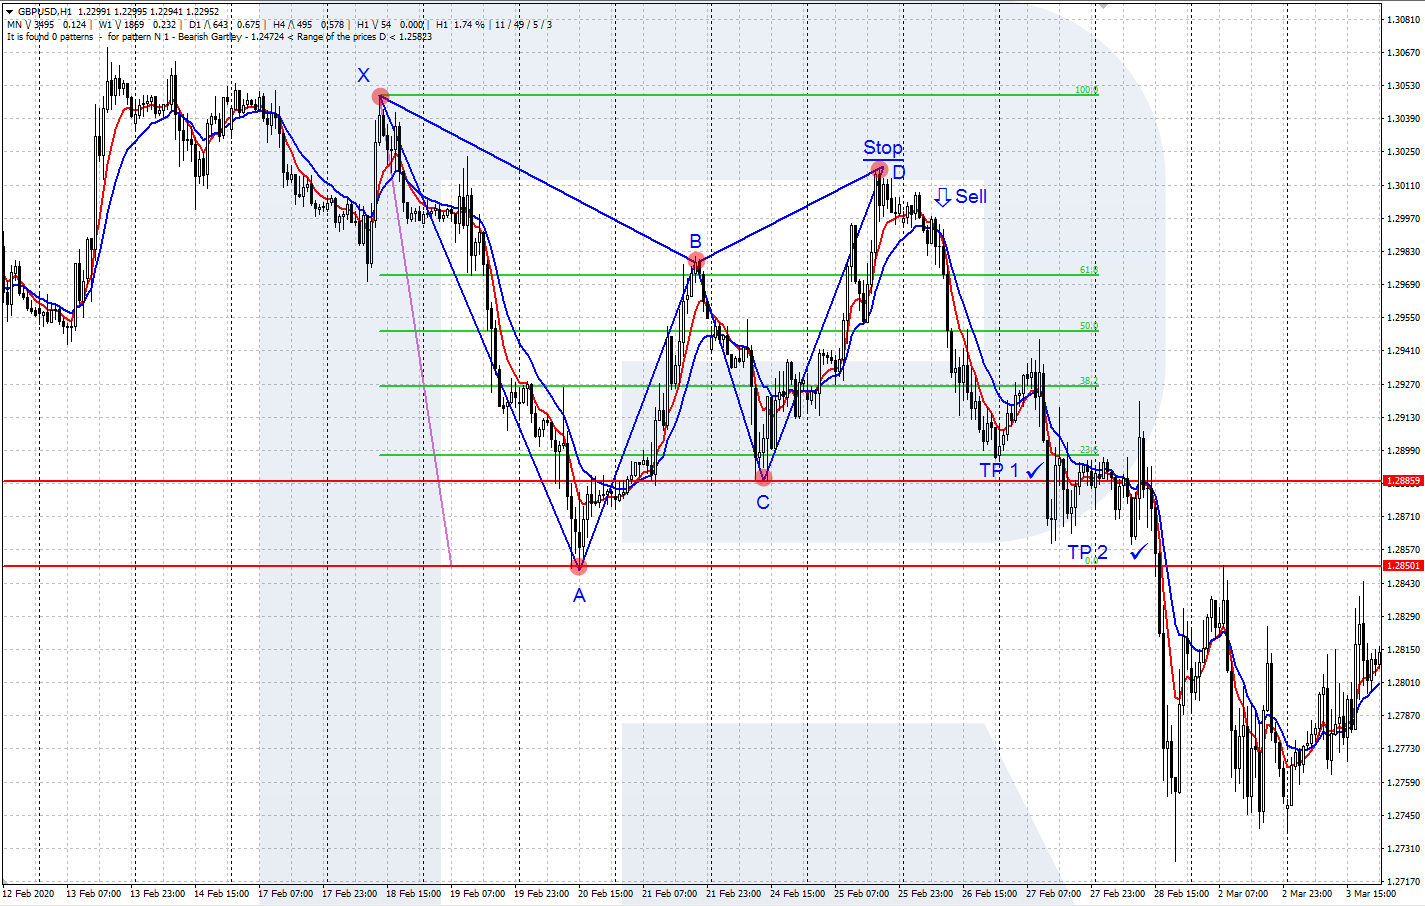
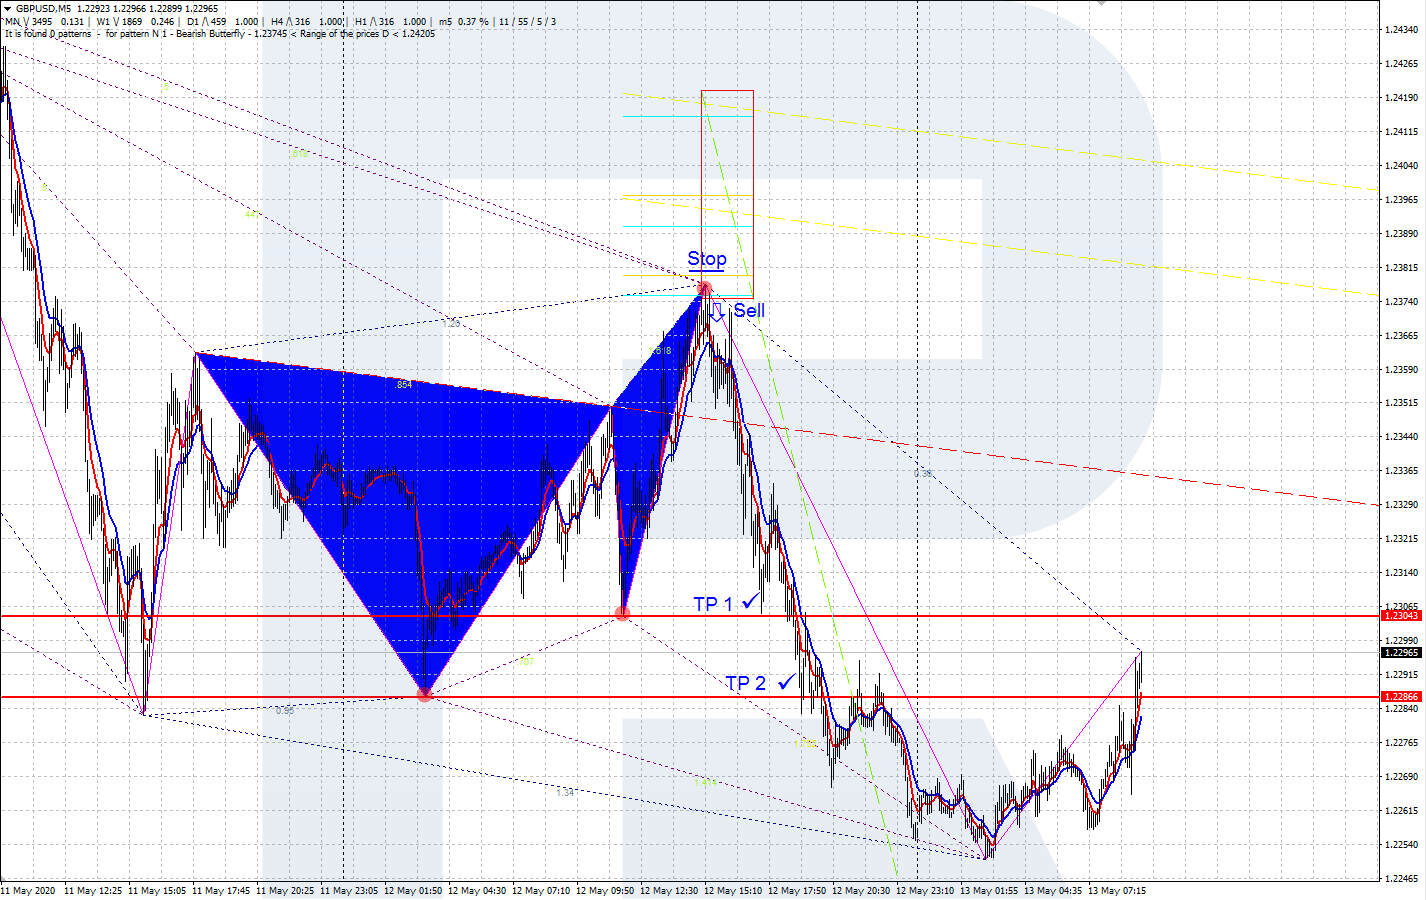
Example of a selling pattern
On M5 of GBP/USD, the indicator marked a selling pattern, with the area for the sell enclosed in a rectangle. After the price reverses downwards, open a selling trade with an SL behind the last high of the pattern and TPs - on the two lower points of the "wings".
Bottom line
The Gartley Butterfly is a rather popular trading pattern. It may be used alongside classical tech analysis, Price Action patterns, or other indicators.
The specially designed ZUP indicator helps to find the patterns on the chart, saving the trader's time and attention. In more detail, the pattern is described in the books by Harold Gartley and Larry Pesavento.


