Trading with the Golden Cross Strategy

5 minutes for reading
In this review, we will discuss a well-known trading strategy called the Golden Cross. This simple and efficient strategy uses two Moving Averages with different periods.
Why is it called the Golden Cross?
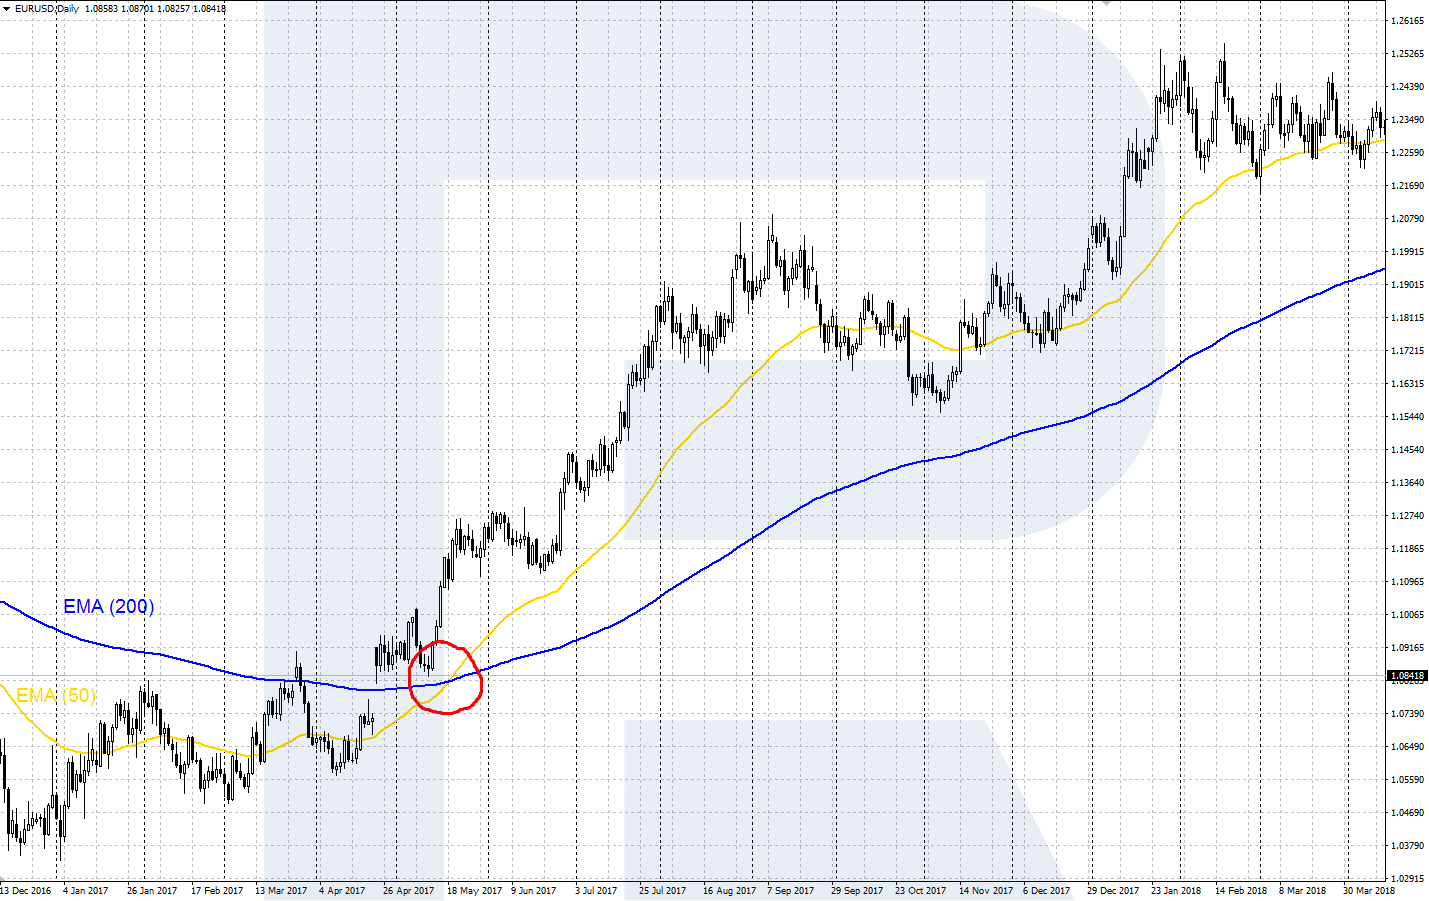
The main signal of this strategy is the crossing of two Exponential Moving Averages (EMA) with different periods. MAs have long been acknowledged as a simple and efficient instrument of tech analysis. A crossing of two MAs on the chart looks like a cross - this is where the strategy got its name from.
A Golden Cross is a signal to buy that emerges when the fast EMA crosses the slow one from below. As a result, the market turns into bullish from bearish. A reversed signal to sell that appears when the fast EMA crosses the slow one from above is called the Death Cross. This signal means that the bears are currently stronger than the bulls, and on the market, there is beginning a downtrend.
The main rules and peculiarities of the Golden Cross
The Golden Cross is a trend strategy, hence, it demonstrates decent results when there is a pronounced trend on the market. Normally, in this strategy, we use a fast EMA with period 50 and a slow EMA with period 200. A crossing of these two EMAs and an escape of the price from a flat signal the beginning of a new trend on the market.
Investors and traders who trade in the long term, usually use daily charts. For mid-term and short-term trading, I recommend using shorter charts - H4, H1, M15. Periods 50 and 2oo of the EMAs are classical, however, you may use other periods if they yield good results during testing.
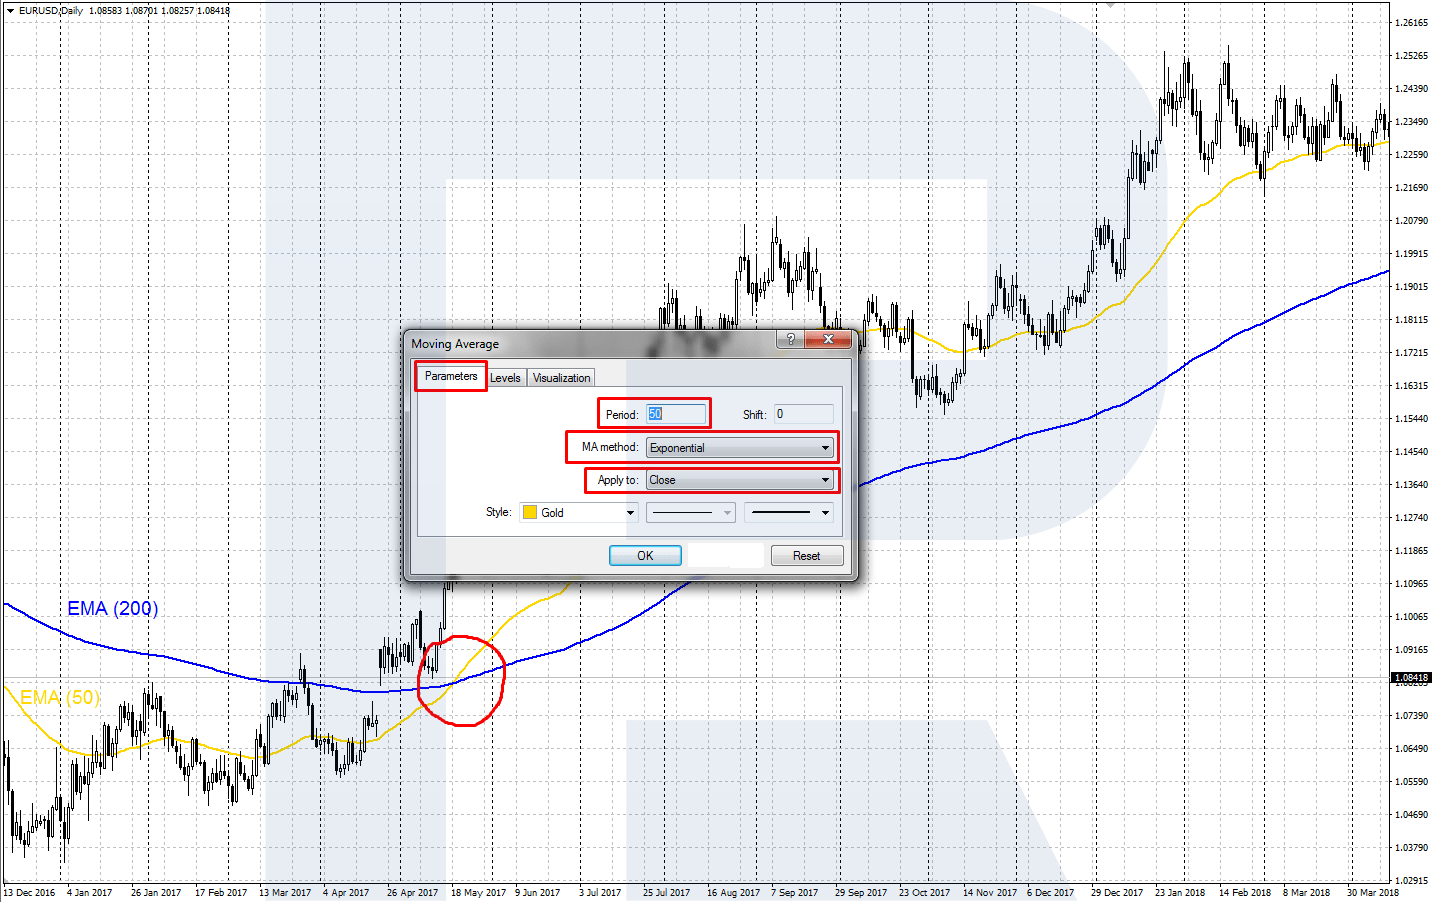
MAs are included in the most modern trading terminals; they are drawn directly on the price chart. On popular trading platforms MetaTrader 4 and MetaTrader 5, you can add MAs to the price chart via the Main Menu: Insert - Indicators - Trend - Moving Average. In the setting window, choose the periods (50; 200), the color and width of the line, and the MA type: Exponential.
The drawbacks of the Golden Cross
In the classical variant, you enter the market right after the MAs cross; a Stop Loss is placed behind the local high/low, while the profit is locked when the EMAs cross back. This trading scenario has certain drawbacks: they are the big SL and the probability of losing a large part of the profit if the market reverses downwards abruptly.
So, to make the strategy more efficient, you may add other instruments to it. An additional oscillator or the signals of tech analysis will help to find an optimal entry point. To lock in profit, you may use yet other indicators, important support and resistance levels, or Trailing Stop.
Opening a buying trade
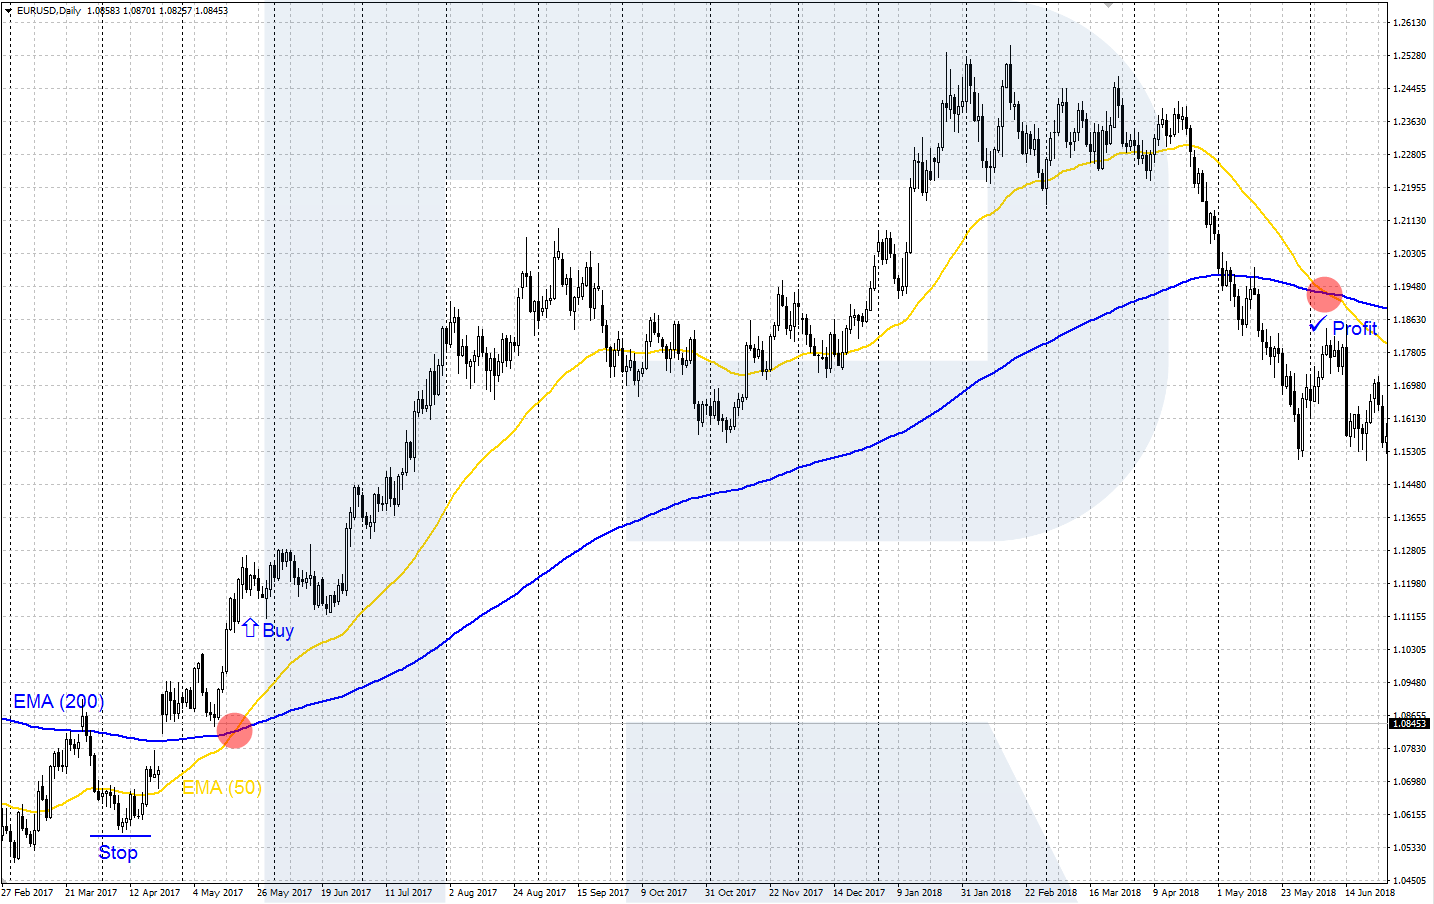
The Golden Cross gives a signal to buy when the fast EMA with period 50 (yellow) crosses the slow EMA with period 200 (blue) from below. Right after the cross, you may open a buying position, with a Stop Loss behind the local low of the price chart, and the profit locked at the backward crossing of the MAs.
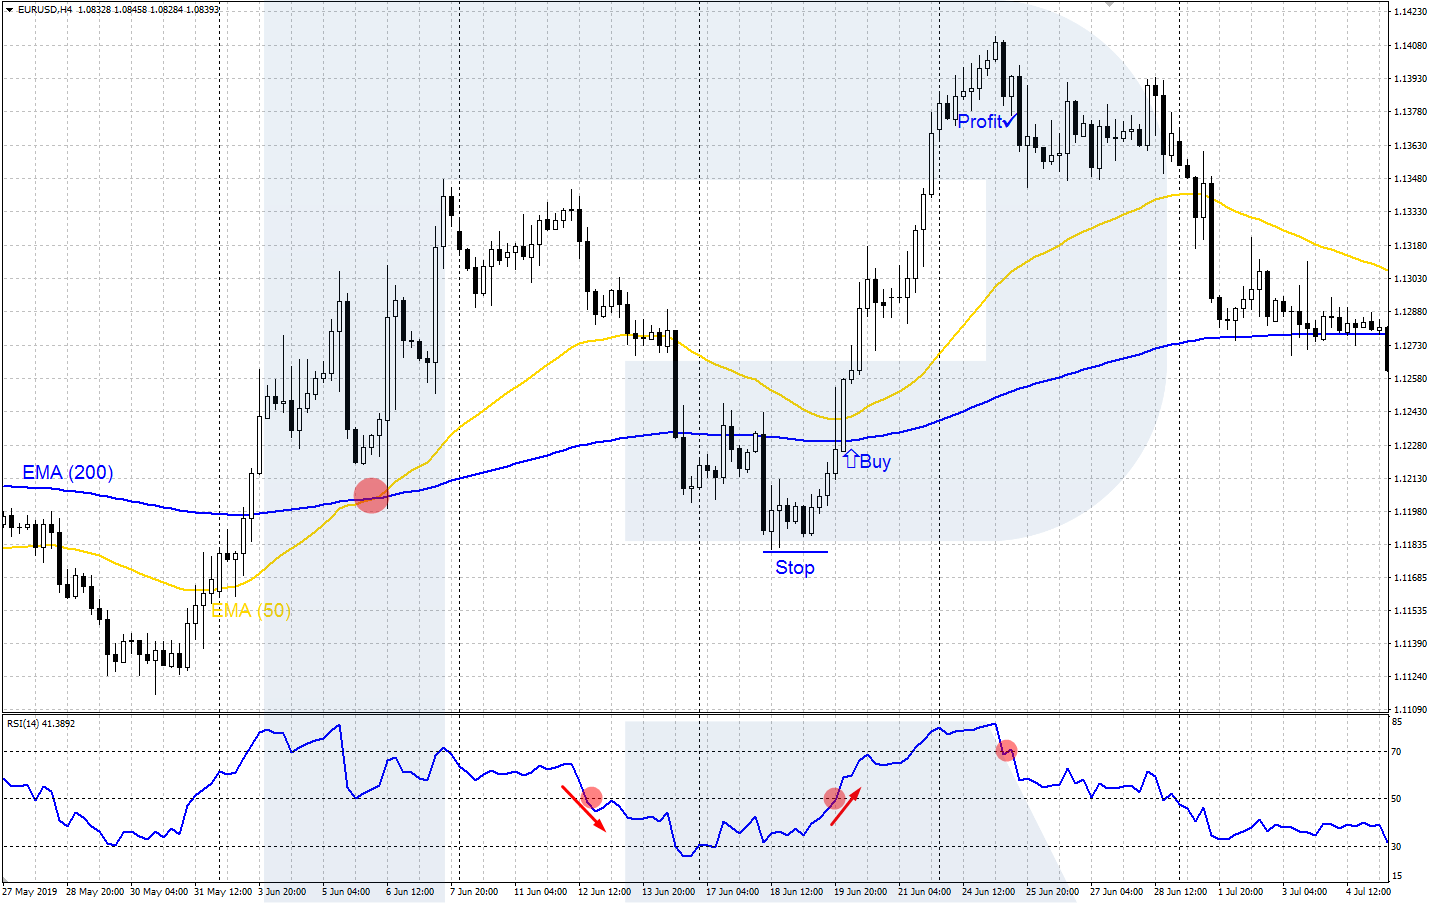
To make the strategy more efficient, let us add the signals of the RSI with a standard period 14. After the Golden Cross gives us a signal to buy, wait for the RSI line to decline below 50%. After it returns above 50%, open a buying position, with an SL slightly lower than the local low. Lock in profit after the RSI, upon going up, demonstrates a reversal and escapes the overbought area (the level 0f 70%).
Opening a selling trade
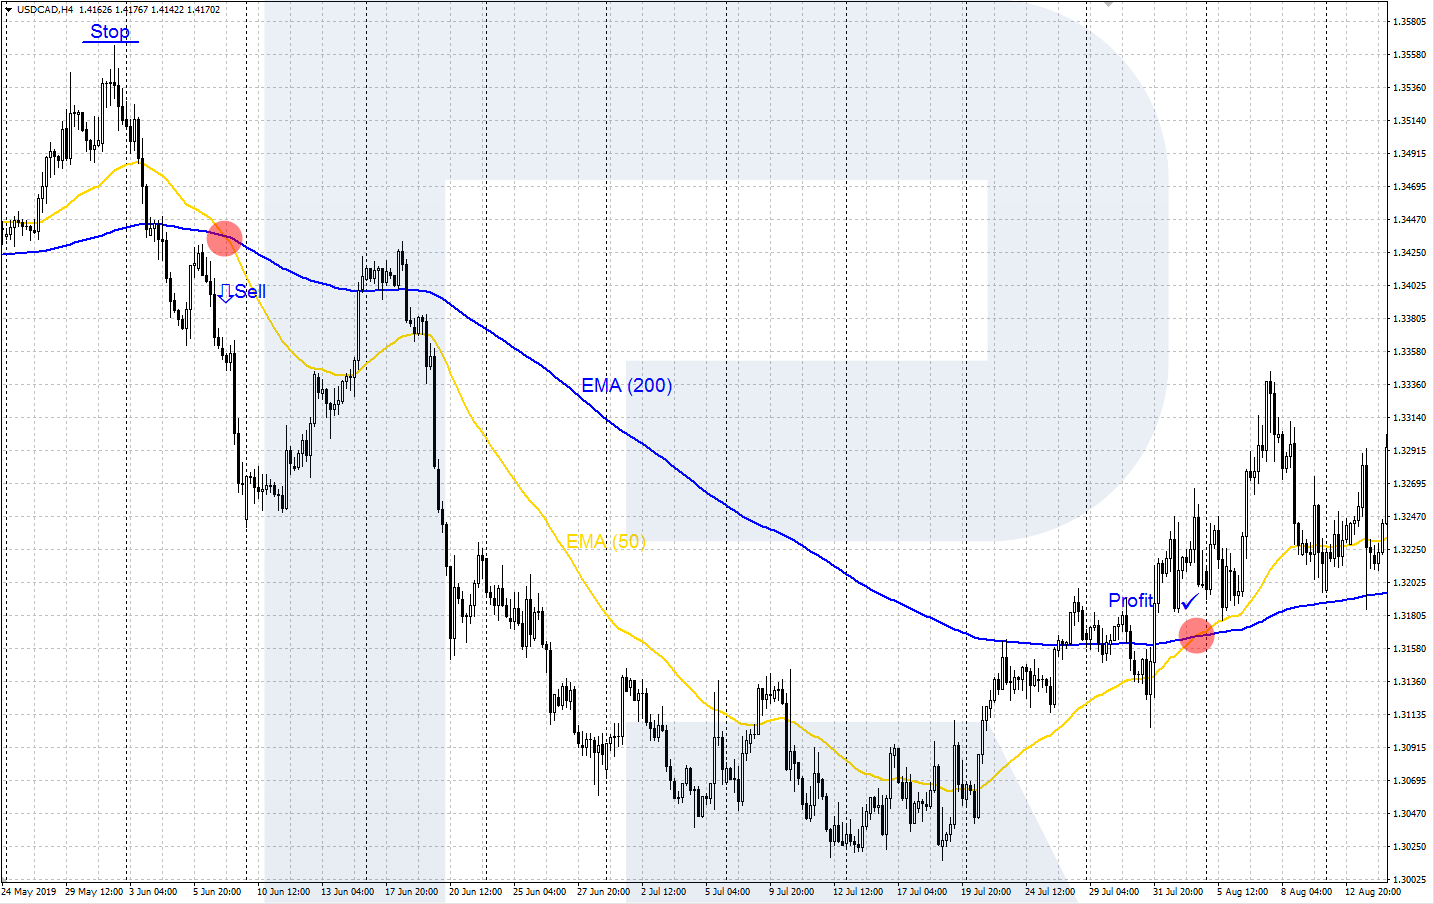
A signal to sell called the Death Cross forms when the fast EMA with period 50 (yellow) crosses the slow EMA with period 200 (blue) from above. This means there might begin a downtrend. After the MAs cross, you may open a selling position, with an SL behind the local high on the price chart and the profit locked when the MAs cross back.
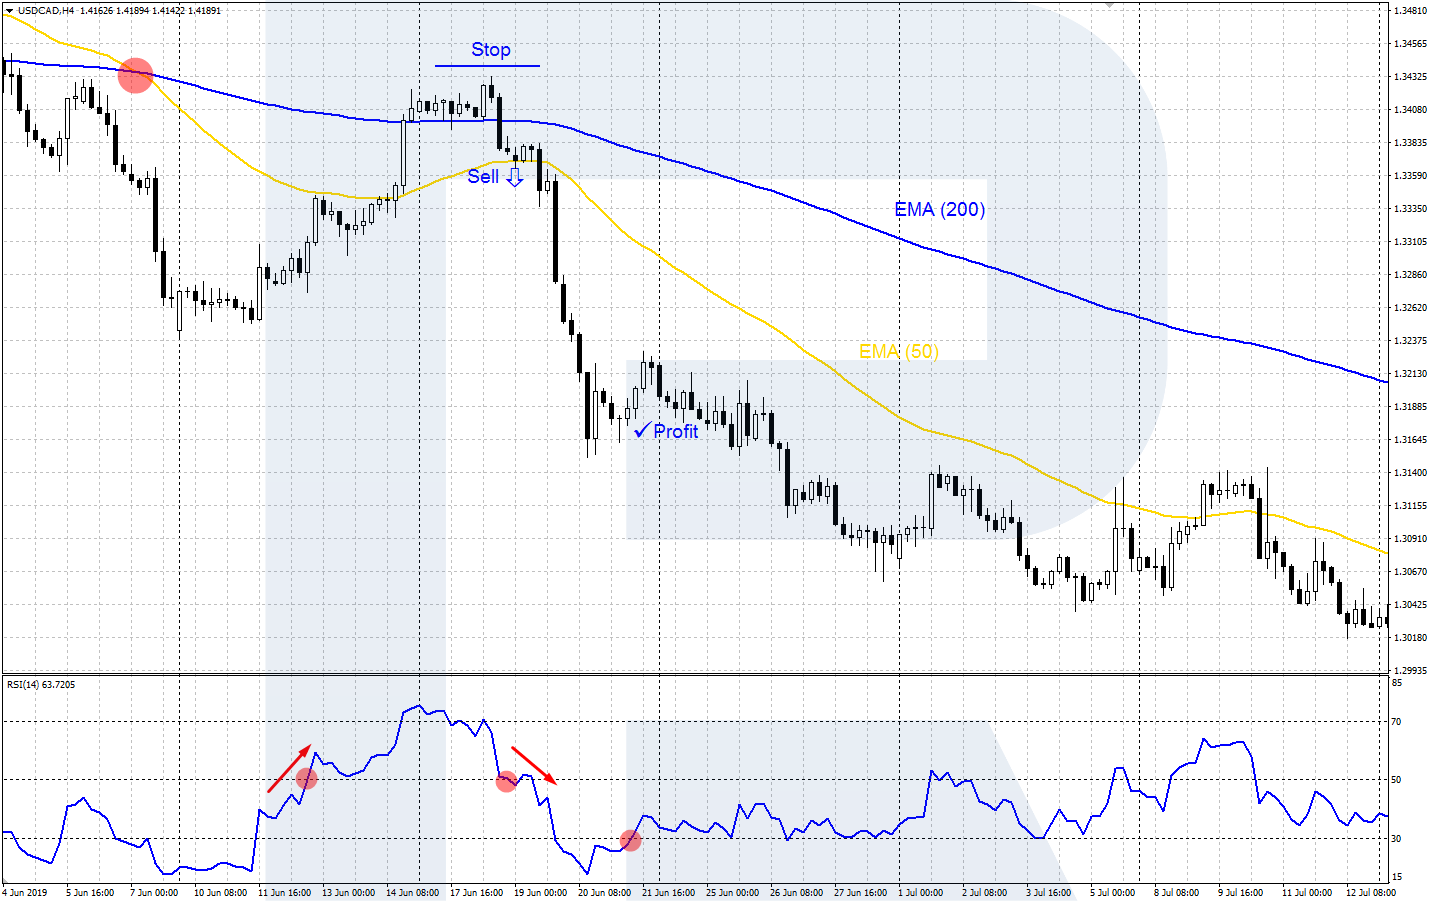
To find more optimal entry points, add the RSI with period 14. After the MAs cross, wait for a correction to begin, and the RSI line rises above 50%. Then, when the RSI line crosses the level of 50% from above, open a selling position. Place an SL behind the local high on the price chart and lock in profit when the RSI reverses after a decline and escapes the oversold area (the level of 30%).
Who will this strategy suit?
The classical variant of the Golden Cross is meant for investors and long-term traders with large deposits. When you enter the market right after the two MAs cross on D1, the SLs are sometimes rather large. and you will have to wait quite long for the trend to end so that you could lock in profit.
If you trade in short-term on a small deposit, you cannot afford large drawdowns and wait for the daily trend to end. Hence, traders with small deposits should trade on shorter periods, use additional instruments for finding better entry points with moderate risks, and close the trade in time.
Closing thoughts
The Golden Cross is a classical trend strategy based on the crossing of two MAs. It works well in the presence of a strong trend but may give losing signals when the market is in a flat. To find optimal entry/exit points, you may use additional instruments: some oscillator, levels, and patterns from tech analysis, Price Action patterns.