RSI Indicator: Description, Trading Strategies, Combining with Other Indicators

8 minutes for reading
The Relative Strength Index (RSI) is one of the few trader's instruments able to go ahead of the price. Of course, such situations do not happen every day, however, this feature is really interesting and useful for the analysis of the current market situation. The indicator was first introduced by J. Welles Wilder and described in much detail in his book "New Concepts in Technical Trading Systems". It is worth noting, that all calculations and drawings on the charts were done manually by the author. Apart from the RSI, which, in essence, is an oscillator (such instruments working best in the times of flats), the book describes several other indicators with various properties and application methods. The author tried to cover as many market situations as possible in order to show the application of the indicators.
In this post I will say about the most important aspects in my view related to the topic:
Description of the RSI
The RSI is a very popular instrument, used by not only beginner traders but also experienced ones, who are confident with such difficult but high-quality methods as Elliott Wave Analysis. As noted above, the indicator is an oscillator. Such type of instruments has been developed for flats, where they show, how much the price has deviated from the average or how fast it is moving. Such indicators predict a high possibility of a reversal. RSI is available on most trading platforms, so there is no need to download anything: it is enough to click a few buttons, and the indicator window will appear above the chart of the instrument.
The calculation method of the RSI
To put it simply, the indicator is calculated as the difference between the positive and negative closing prices of a certain timeframe. If the sum of the average positive prices is bigger than that of the negative ones, the values of the indicator go upwards; if vice versa, the indicator values decline. See the formula for the RSI below:
RSI = 100 - (100 / (1+RS))
RS is the average of the positive closing prices/average of the negative closing prices.
The author used the timeframe 14 for the RSI, but presently the value 13 is used more often. This influences the speed of the changes only, so with a smaller timeframe the indicator will just be quicker. There are lots of various trading systems with different lengths of timeframes; however, it is worth remembering that for the graphic use of the indicator it is better to stick to the conservative strategy with the timeframe close to the one recommended by the author.
How to use the RSI
Wilder singled out several ways of using the indicator, from the simplest ones to the most complicated which would be hard to apply without knowledge of the basics of graphic analysis. All variants may be broken into the following components:
- Overbought and oversold areas
- Searching for divergences
- Searching for graphic patterns
- Drawing trendlines
- The Failure Swing reversal pattern
Let us have a look at them in more detail so that we learned to find the points of entering the market with the help of the indicator or could create our own RSI strategy, using the method of chart analysis.
RSI trading strategies
Oversold and overbought areas
It is rather easy to define these levels: the author himself defined the area above 70 as the overbought one. If the price goes higher than that level, it is considered to grow too fast, so a soon reversal is expected. If the indicator falls below 30, the price is said to be declining too fast, so a correction taking the price back above 30 is expected. However, in times of trends, the RSI values may stay above 70 or below 30 for a long time, until the trend has its power.
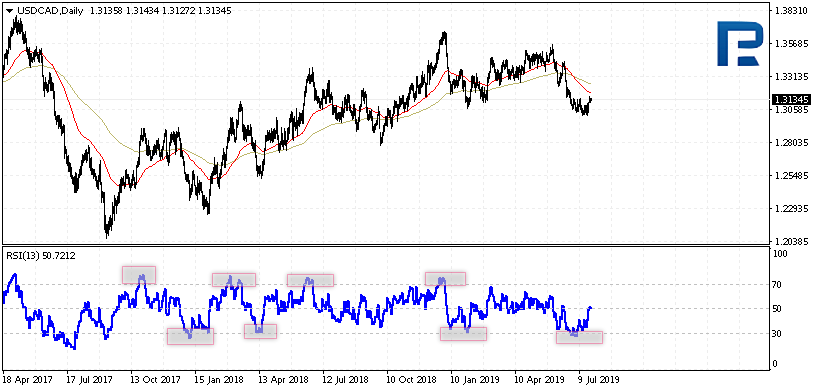
To solve this problem we have to wait for the indicator to go back below 70 in case of strong growth and only then consider selling the instrument, or to define the direction of the trend and ignore signals against it. For example, in a bullish trend, the indicator values may rise above 70 and stay there quite often. It is recommended to ignore such signals and wait for the price to fall below 30 before making the decision to enter the market. Same with a downtrend: it would be better to ignore signals below 30 and wait for testing the level of 70 when the signals supporting the current trend will be received.
Searching for divergences
We have discussed convergence and divergence signals in detail in the article devoted to the MACD indicator. If such structures appear on the RSI, we start a search for the divergence of the price chart and the indicator chart. For example, if the price shows a new maximum, but the indicator chart does not confirm it, a divergence that signals to sell is considered to form.
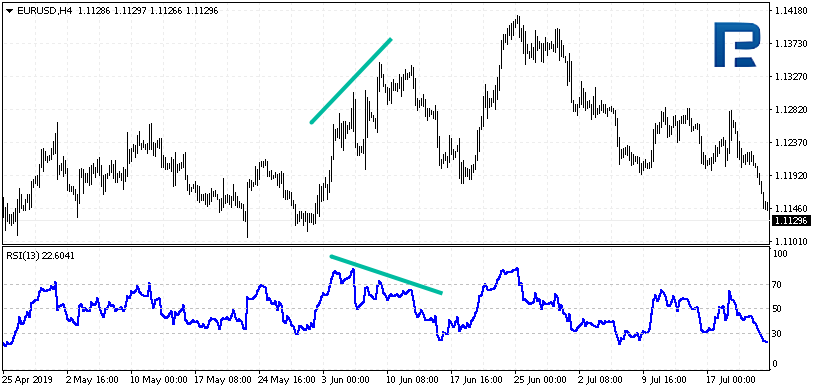
The signal is taken as the one for selling or buying depending on the place where the pattern forms (above or below 50). The MACD indicator might serve better for the search of such patterns because there is a line that gives a clear signal for entering the market. The RSI does not feature such a line, however, your ability to find such signals on it will always be useful.
Searching for graphic patterns
Quite often it so happens, that a reversal pattern Head and Shoulders forms on the RSI, while it does not do so on the price chart. This is how you can get a trustworthy signal for entering the market. You can also search for such patterns as Double Bottom, Triangle or Double Top. However, Head and Shoulders is the strongest one.
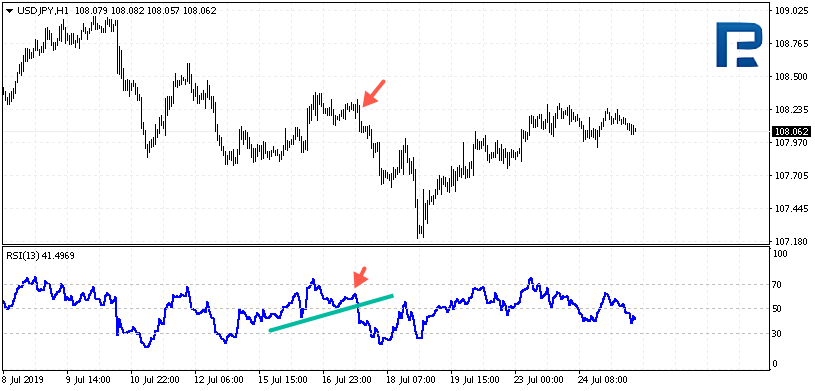
The market is better entered on the right shoulder of the pattern, same as when trading on a price chart. The moment when the neck line is broken away will sort of confirm the completion of the pattern.
Drawing trendlines
Drawing trendlines is one of the most exciting activities for a graphic trader. What is more, we can get a leading signal for entering the market. The trendline may equally be support and resistance. If the indicator values break through the trendline, the author recommended drawing the same line on the price chart and waiting for it to be tested.
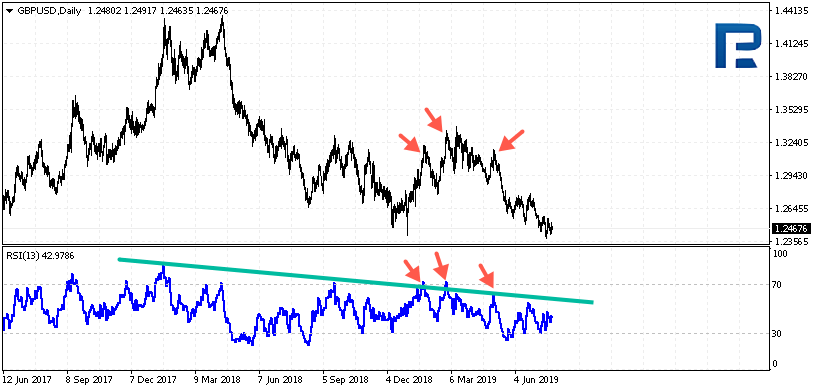
This is how the leading character of the indicator shows itself: the price has not reached the trendline yet, but the RSI has already broken it away. However, application of such a graphic method requires certain experience in graphic analysis and knowledge of drawing trendlines and levels on the price chart.
The Failure Swing pattern
The author described this pattern as a separate signal, having strict rules of searching for it before entering the market. The signal for buying is to be formed above 50, then the first peak of the indicator is to test 70, and then the indicator is to bounce down, but not below 50, and grow again, but not as high as previously up to 70. In the place where the indicator values leaped upwards, the support level is formed, and as soon as this area is broken through, a signal for selling will appear.
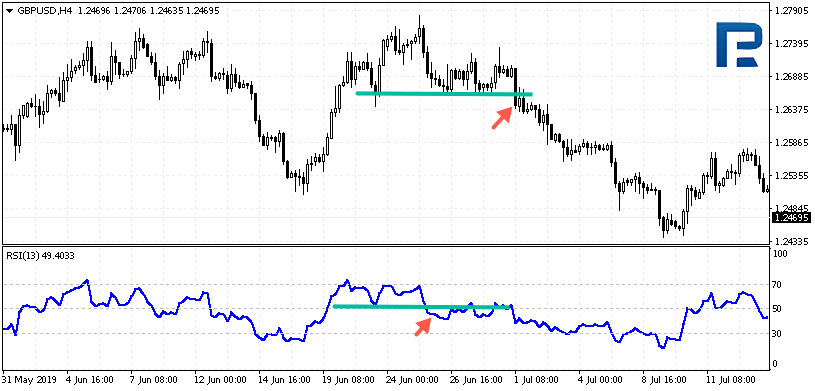
This structure may seem really like the Double Top and Dragon patterns. The similarity does exist; however, it is important to keep an eye on tests of the RSI levels, otherwise, the pattern will not work. The same but upside down is valid for the signal for buying. The pattern is to form below 50, the first peak is to be below 30, then a correction not reaching 50 is to happen, followed by another decline not reaching 30. A breakaway of the resistance will signal to buy. It should be noted that rather often the price will be dragging behind the indicator, confirming its leading character.
Combining the RSI with other indicators
Wilder himself did not speak about using the RSI with other technical analysis indicators. As the basic variant of defining the trendline on D1 of an instrument, 2 Moving Averages may be taken; meanwhile, on smaller timeframes signals on the RSI are to be searched for only along the trend.
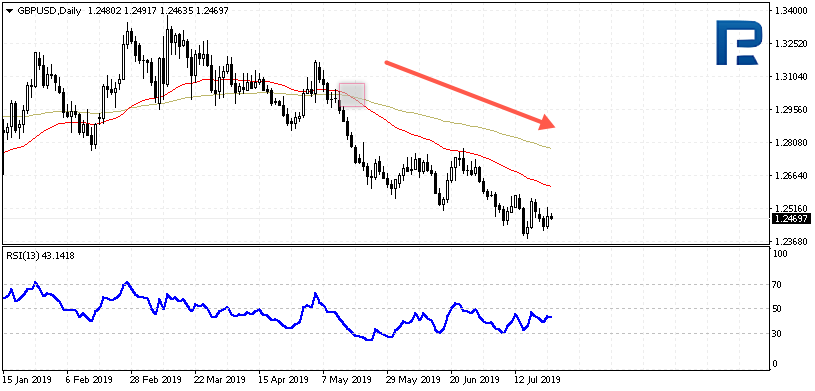
Such signals may be simple: moments when the indicator reaches oversold or overbought areas. If on a D1 the MAs are signaling an uptrend, on H1 we should expect just a test of 30, consider buying only and ignore everything above 70.
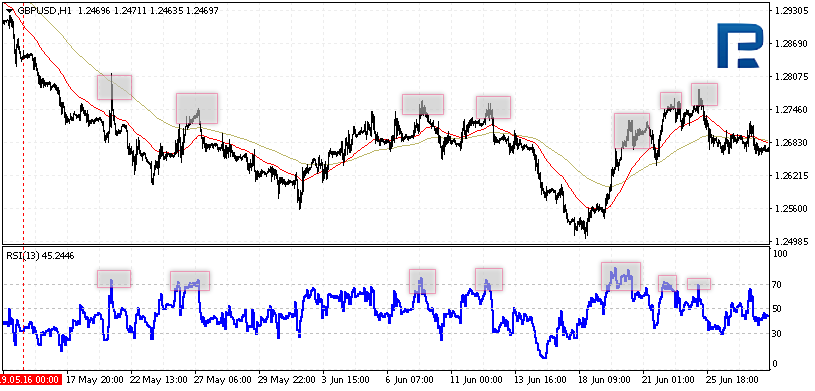
In case of a downtrend, a test of 70 is to be expected; if it happens, we should place orders for selling; all signals below 30 are to be ignored. This way we will get an efficient strategy of the RSI along the trend, combining timeframes as well.
Summary
The RSI is an interesting and strong instrument of technical chart analysis. It was created long ago but remains topical. As we see, it can be used by beginner as well as experienced traders. If you enjoy graphic analysis and know how to draw trendlines, you will be able to search for graphic patterns right on the indicator chart, without carrying out price analysis. If needed, you can combine the RSI with other indicators, creating a trading system on their basis: the RSI will be a great supplement to the MA and will help trade successfully along the market trend.


