How to Use Mean Reversion Indicator: Settings and Trading

7 minutes for reading
Many traders use support and resistance levels in their trading systems and strategies. There are quite many ways of using them: they apply to market and pending orders, their breakaways and bounces off them may be used in market analysis; also, they are landmarks for Stop Losses and Take Profits. Moreover, traders pay attention to the overbought and oversold areas. For trading, a comprehensive approach may be used: tech analysis suits for detecting the levels and indicators help find the oversold and overbought areas. However, you might manage with just one indicator that will show everything. It is called Mean Reversion.
Mean Reversion overview
Let us look at the indicator in action and try to see into its signals.
Mean Reversion belongs to the group of channel indicators. This means that on the chart it draws channels inside which the price moves and tries to forecast its behavior. The multi-currency Mean Reversion indicator in MT4 applies to all trading instruments. The developer states that it works on any timeframe and in any trading session. Theoretically, its application in Forex is unlimited.
Mean Reversion settings
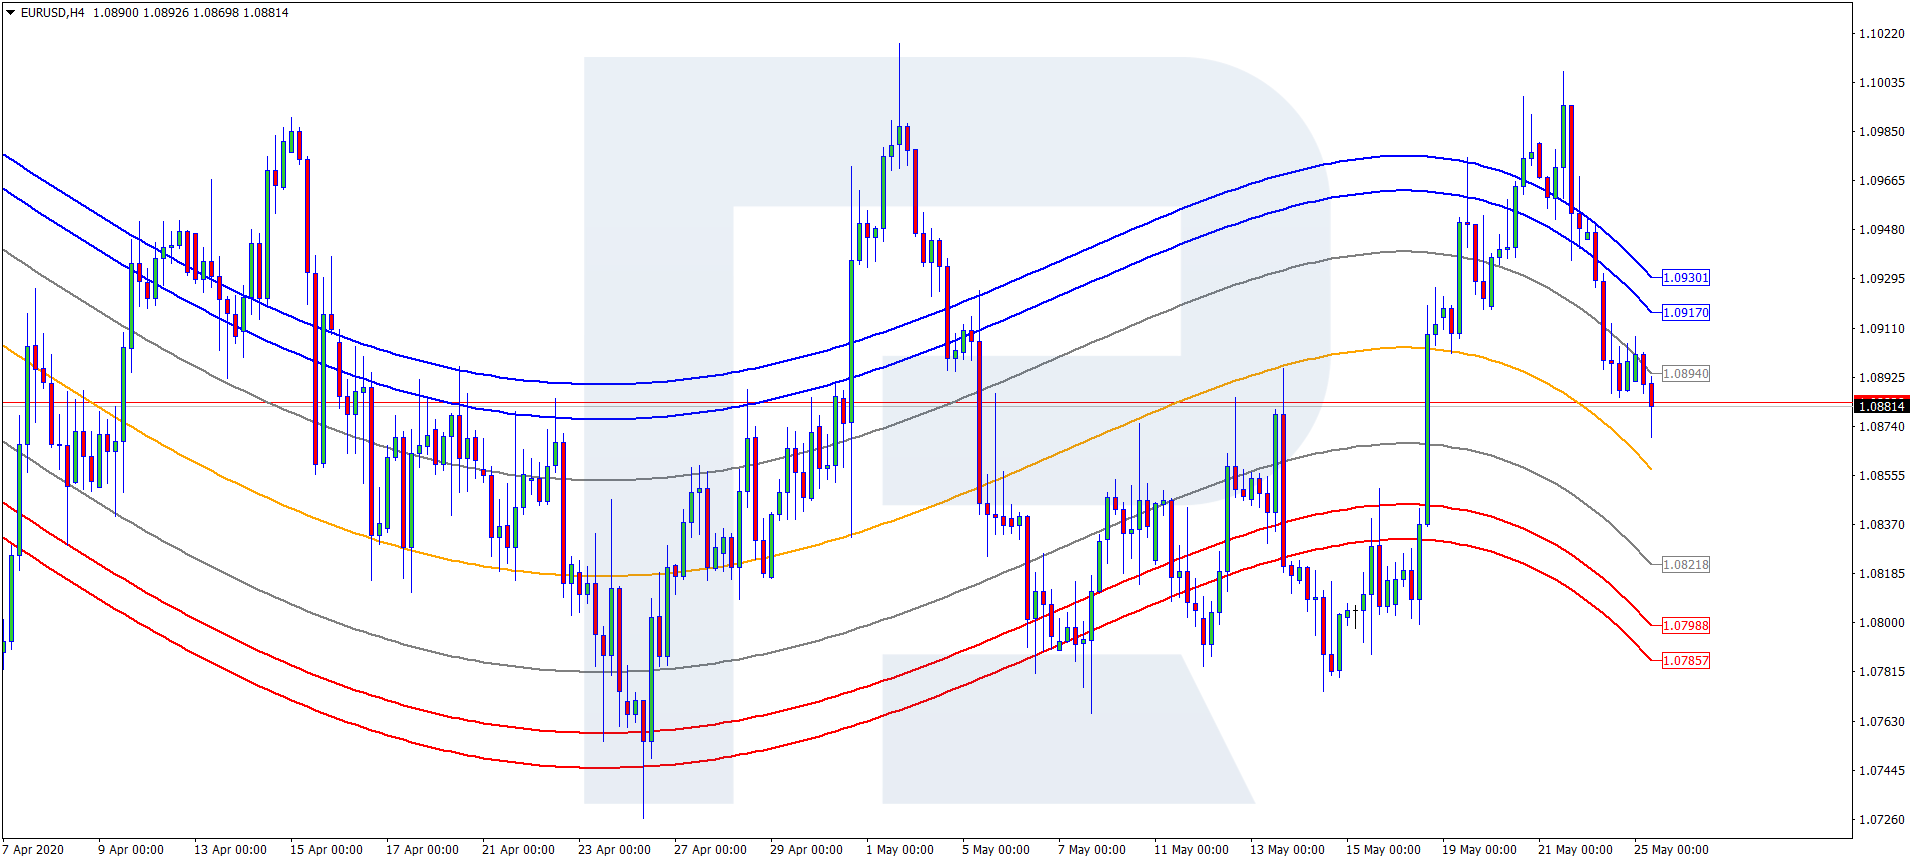
The indicator is drawn on the chart of the instrument and looks like seven lines, between which the price moves. The central line is the main one, above and below it six more lines constitute the channel. The main line is called the gravity center. It is calculated based on polynomial regression. Other lines show the overbought and oversold areas and are calculated as a standard deviation from the central one. For the sake of clarity, the overbought area lies above the central line between the grey and upper blue lines. The oversold area lies below the main line between the grey and lower red lines.
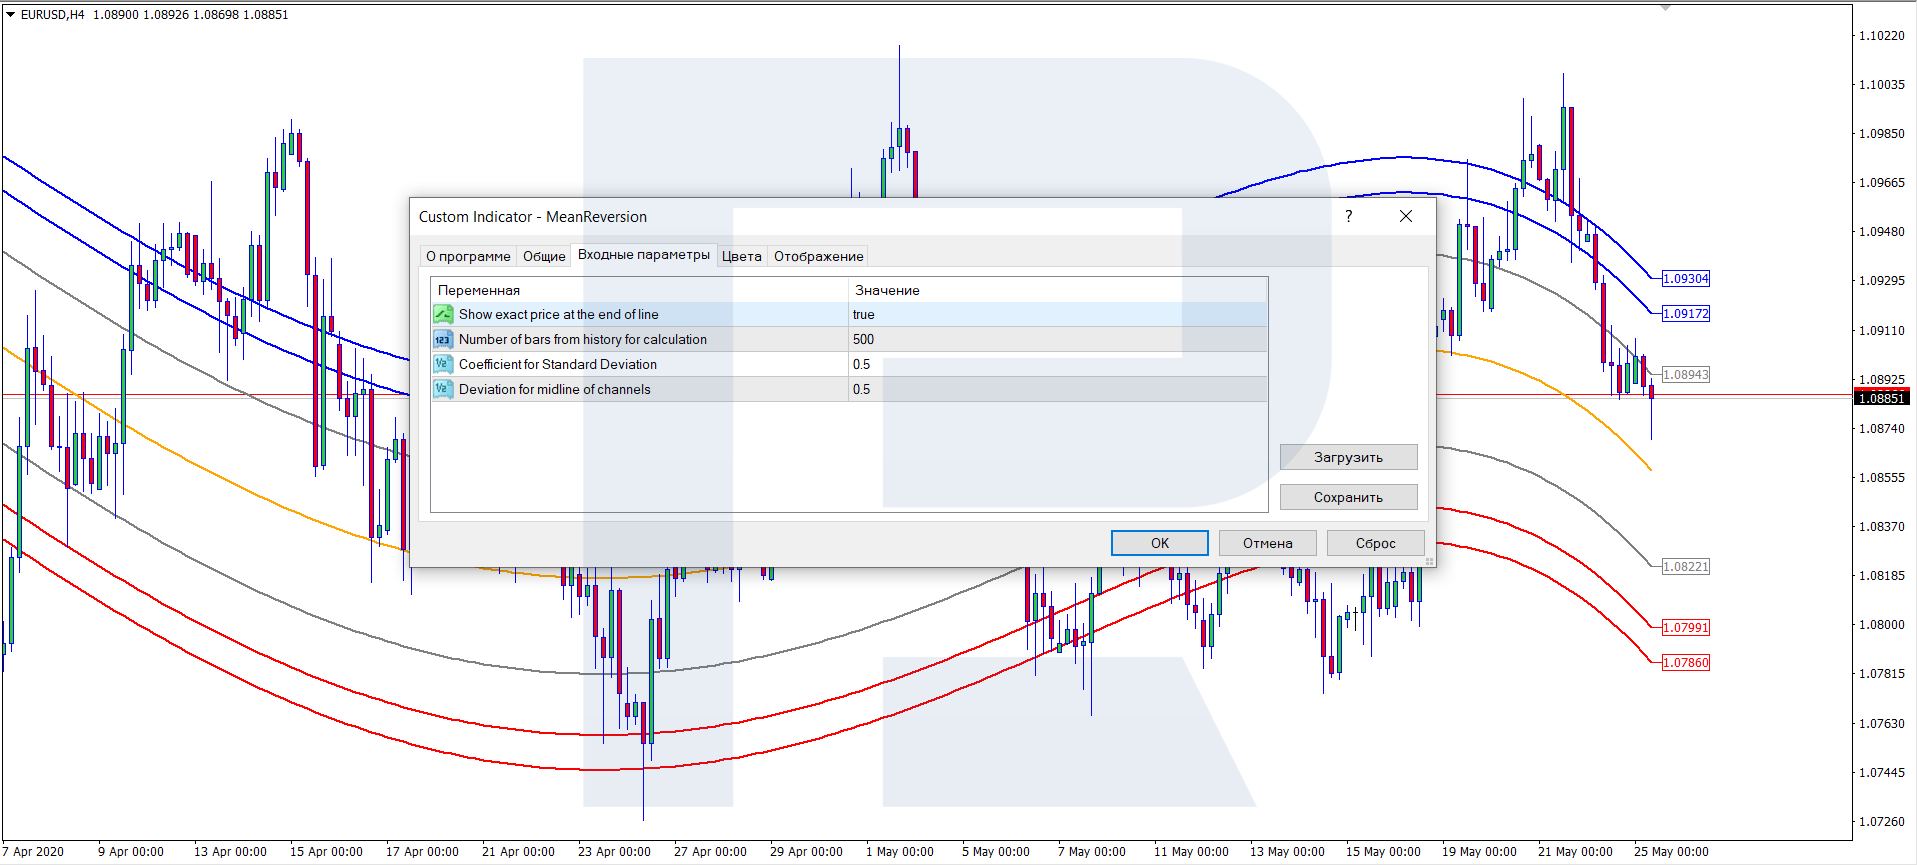
Starter settings
- "Show exact price at the end of line" demonstrates/hides the current price of each line
- "Number of bars from history for calculation"
- "Coefficient Standard Deviation" helps narrow or broaden the channel
- "Deviation for midline of channels" is the deviation of the grey lines.
With these settings, the trader may customize the indicator. However, mind the volatility of the instrument and the timeframe. The settings are optimal if the price chart remains within the channel borders most of the time. You may also change the color scheme.
Trading with Mean Reversion
To trade by this indicator, you need to know the basics of tech analysis, particularly the support and resistance levels, and use them freely. This is what trading with the indicator is based on. Indicator signals and tech analysis supplement each other and work for the trader.
False breakaway
Finding the key support and resistance levels on the chart, the trader counts on a breakaway or a bounce off the levels, which are sometimes hard to distinguish at once. Mean Reversion may act as a kind of filter, in this case, showing the moods of players in the market. The overbought or oversold state of the price may be a serious argument influencing the decision about further behavior of the price.
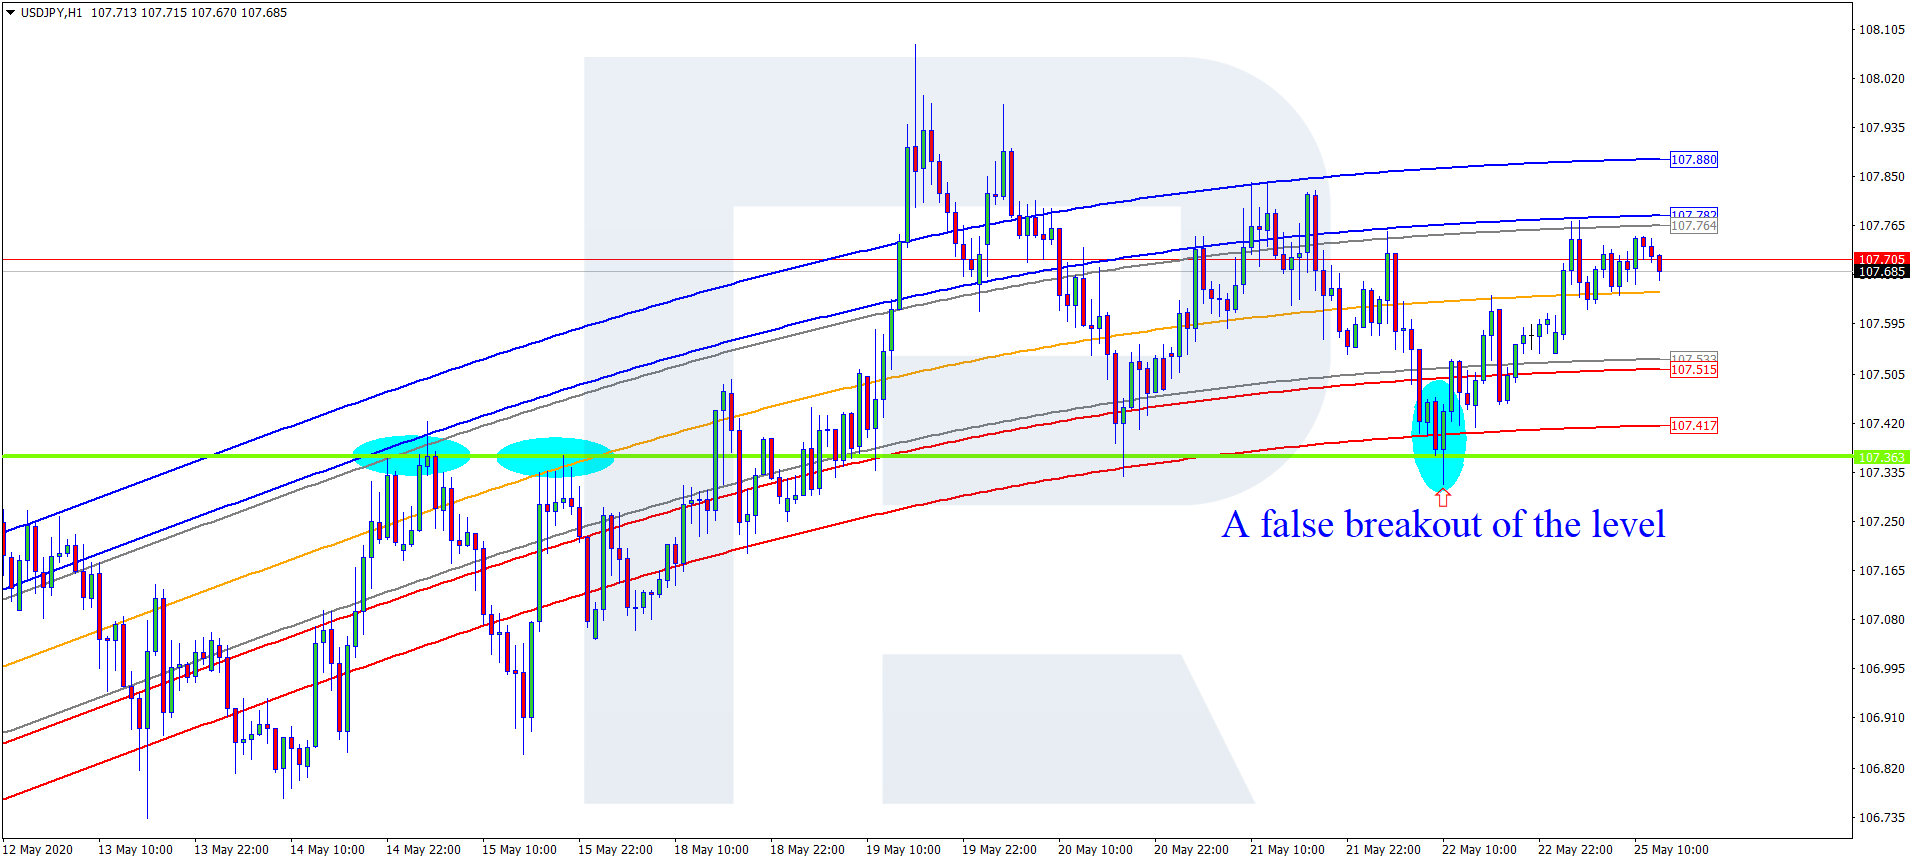
A false breakaway of the support level
In the picture below, you may see an example of a false breakaway of the support level. Let us discuss it in detail.
We see the price approach as the key support level and stop. Then, there are two ways: it may either break away the level and go on declining or bounce off the level and start growing. You may try to guess, but using the indicator signals will be safer.
In our case, it says that the pair is in the oversold area. This means that sellers are losing their power, and the time of buyers is coming. As we can see in the picture, the price broke the support by the shadow and returned into the indicator borders. From this example, we may conclude that the breakaway was false, and the decline is unlikely to continue.
In this case, after the candlestick that performed the false breakaway closes, you may consider opening a buying position. Place the Stop Loss near the low of the candlestick. Close the position and take the profit when the price enters the overbought area (touches the upper line of the indicator).
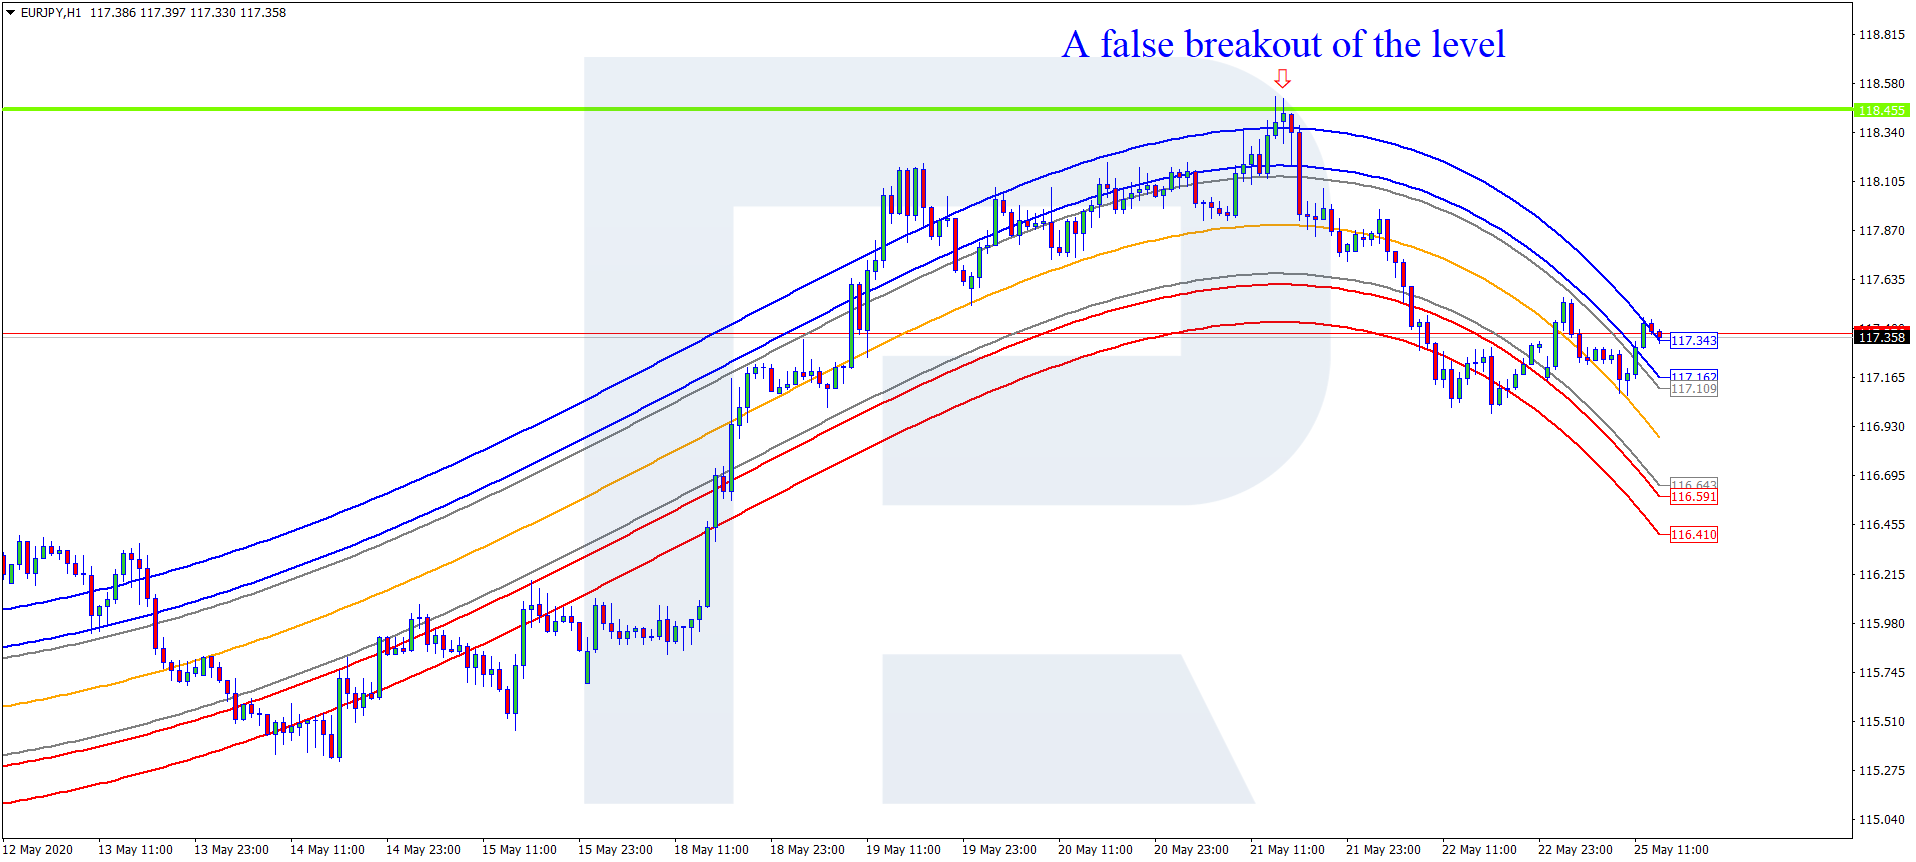
A false breakaway of the resistance level
In the picture below, we see the price approach the resistance level and stop beneath it. What will follow: a breakaway or a bounce? Look at the indicator signals.
The price is in the overbought area, which means the sellers may soon lose their power, so the price may bounce off the level. If you open a selling trade, put the Stop Loss behind the high of the group of candlesticks. As we see, the quotation bounced off the resistance level and started declining. Close the position with a profit when the price enters the oversold area (touches the lower red line).
Trading the trend: buying and selling
Now, let us proceed to trading the trend and entering the market at pullbacks.
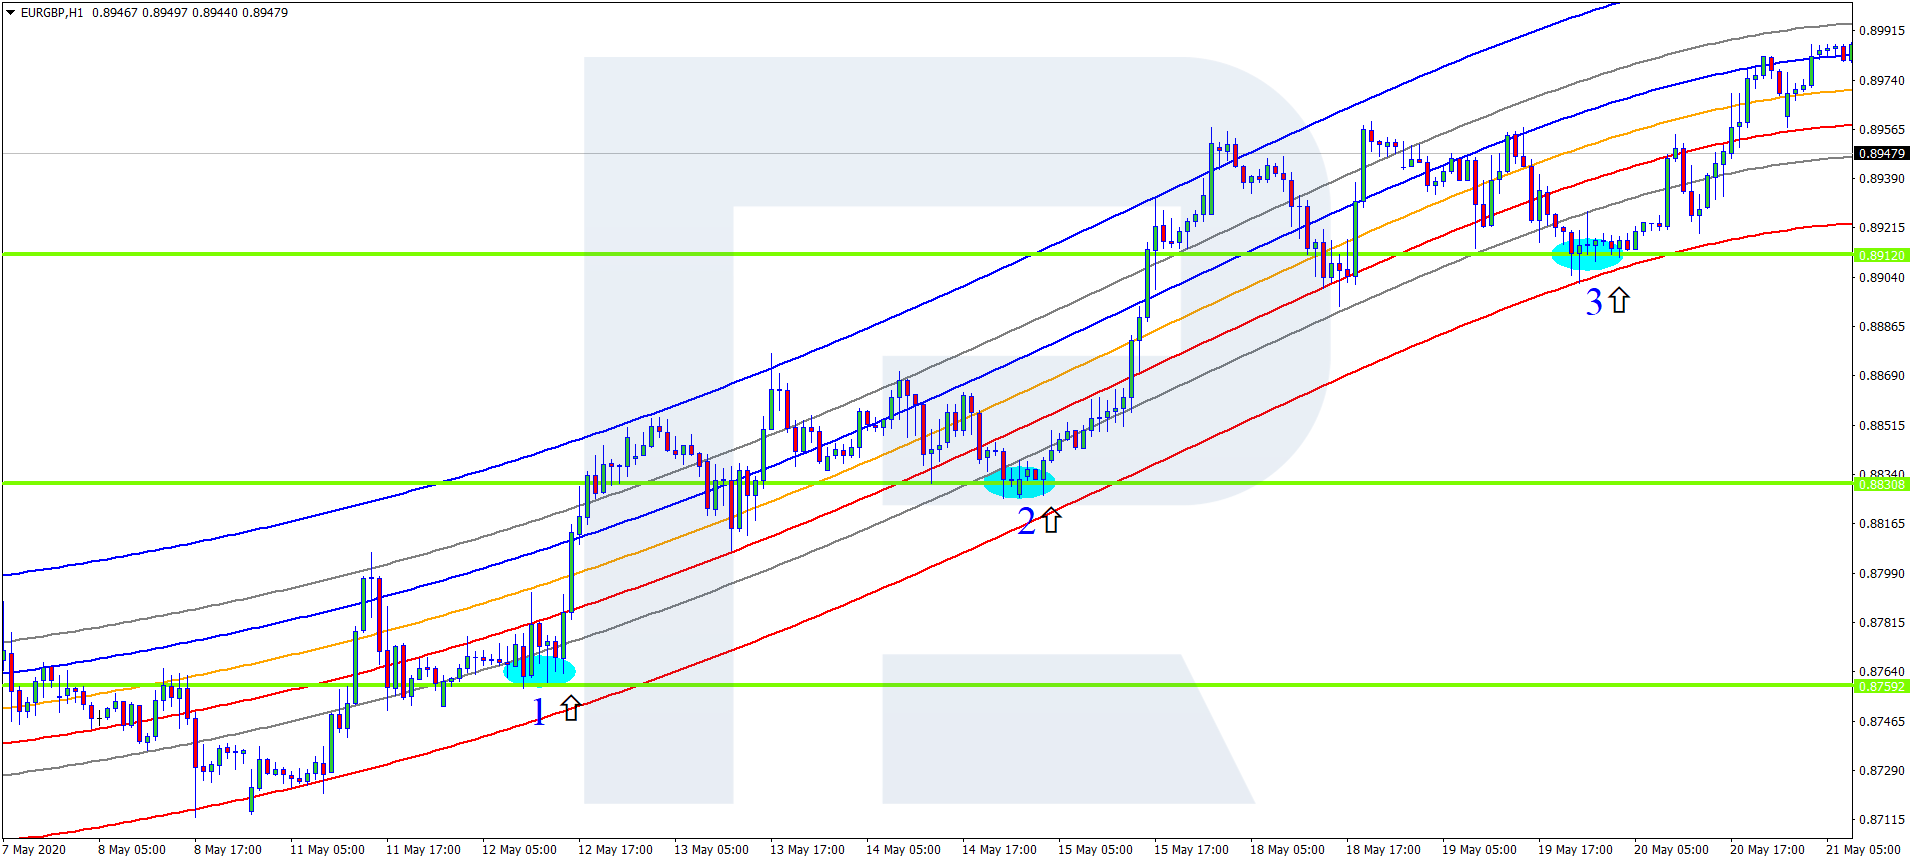
In the picture below we see the price correct to the broken levels after growth. For us, it is an opportunity to open a trade at a pullback. We may either buy in an existing trade or open a new one. When the price returns to the broken level, it gets into the oversold area, which is an additional signal of sellers losing their powers and new buyers cutting in.
Trading pullbacks note that the indicator lines must be looking up. This indicates an uptrend in the market, so open positions in the direction of the trend.
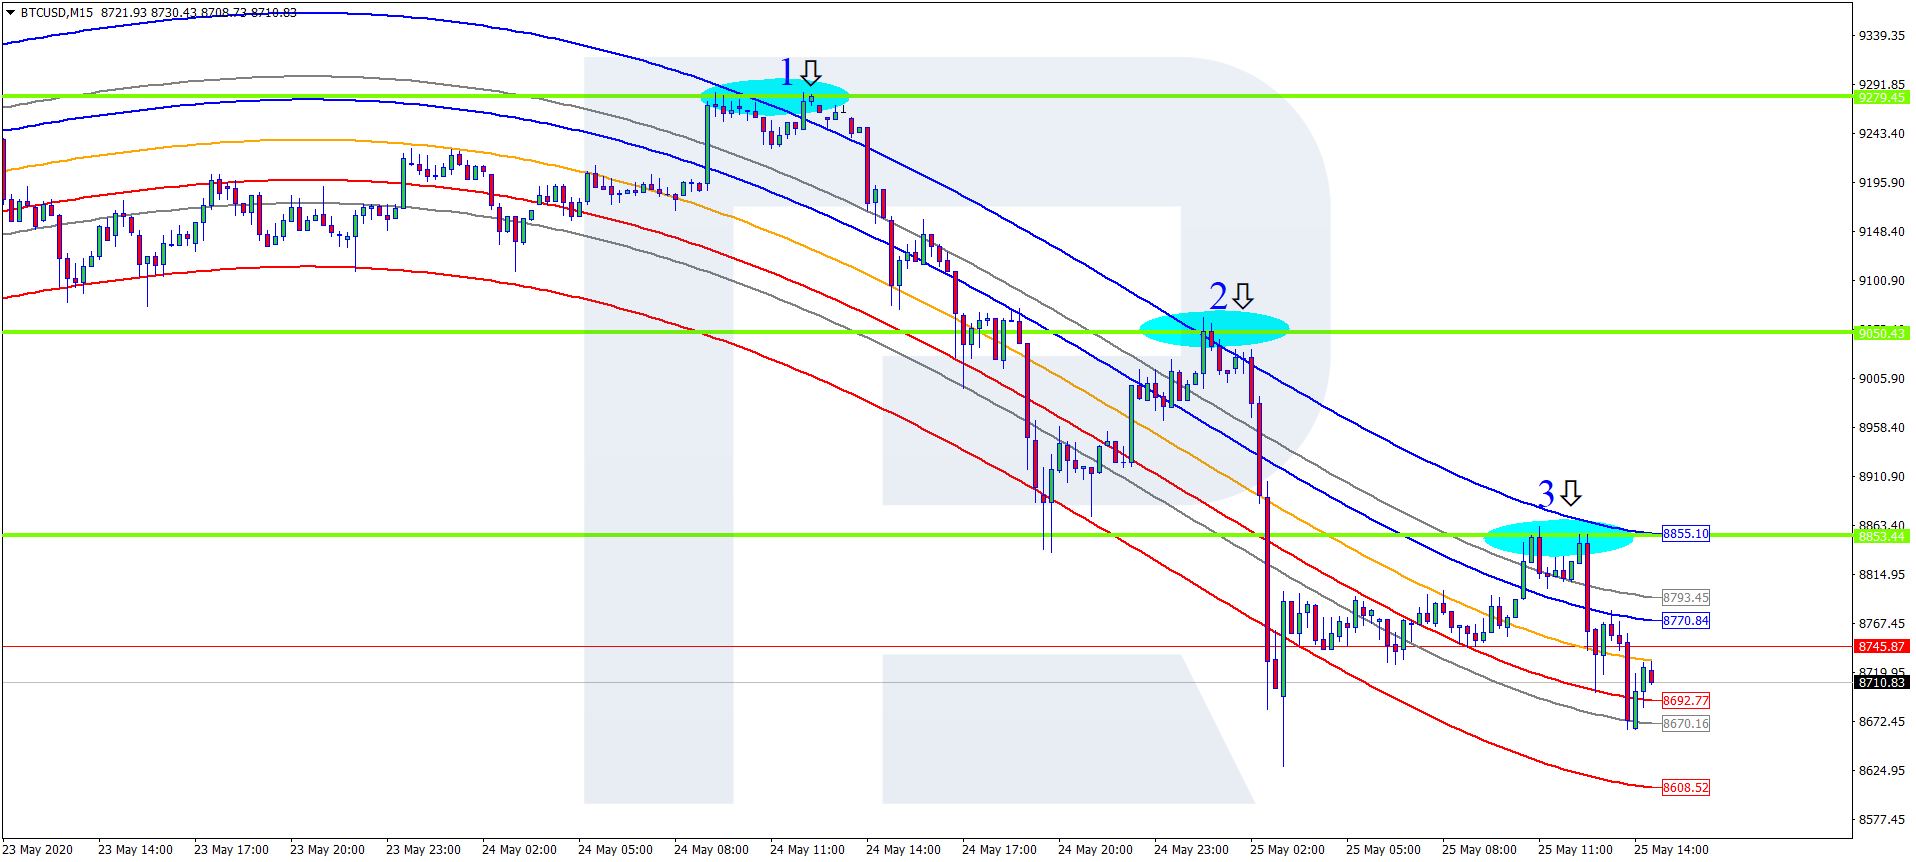
Selling trades are carried out the same way.
After declining, the price pulled back to the resistance level, entering the oversold area simultaneously - this is an additional signal of a possible bounce off the level. In the picture we see the pair make three bounces and g on descending in the chosen timeframe. In all cases, Stop Losses are placed behind the levels, preferably behind the highs of the patterns that attempted at breaking the levels.
Summary
As the examples above show, theoretically, there is nothing difficult in trading by Mean Reversion; however, there are things to keep in mind:
- The indicator keeps redrawing.
- The story looks beautiful and neat but in reality, you may get confused.
- The use of the indicator requires the knowledge of tech analysis.
- Basic knowledge of the classical candlestick analysis will help you choose a more precise signal to open a position.
Along with other types of analysis, this indicator may be a good help to both beginner traders and experienced speculators.