How to Trade With OsMA Indicator?
4 minutes for reading
In this article, we will get acquainted with the OsMA indicator. It helps to find divergences on the price chart and use them for trading.
Description of OsMA indicator
OsMA (Moving Average of Oscillator) is an oscillator based on the difference between two Exponential Moving Averages and their normalized values. The indicator helps to find and use in trading bullish and bearish divergences of the indicator and price charts. In terms of its calculation method, OsMA is very similar to a better known and more popular indicator – MACD.
In essence, the OsMA indicator is a modification of the MACD. For calculating the OsMA, the same MAs as for the MACD are used. The difference between the values of the MACD histogram and its signal line forms a bar of the OsMA histogram. The bigger the difference between the MACD histogram and its signal line – the bigger the OsMA value.
As other oscillators, OsMA gives an idea of what is up on the market. If the OsMA histogram is above 0 and shows another high – this means an uptrend and the overbought state of the market. If OsMA is below 0 and forms local lows – there is a downtrend on the market and an oversold state.
The OsMA indicator is shown in a separate window under the price chart. It is represented as a bar chart. The indicator values are not normalized, the central axis is 0. OsMA is included in most popular trading platforms, such as MetaTrader 4 and MetaTrader 5.
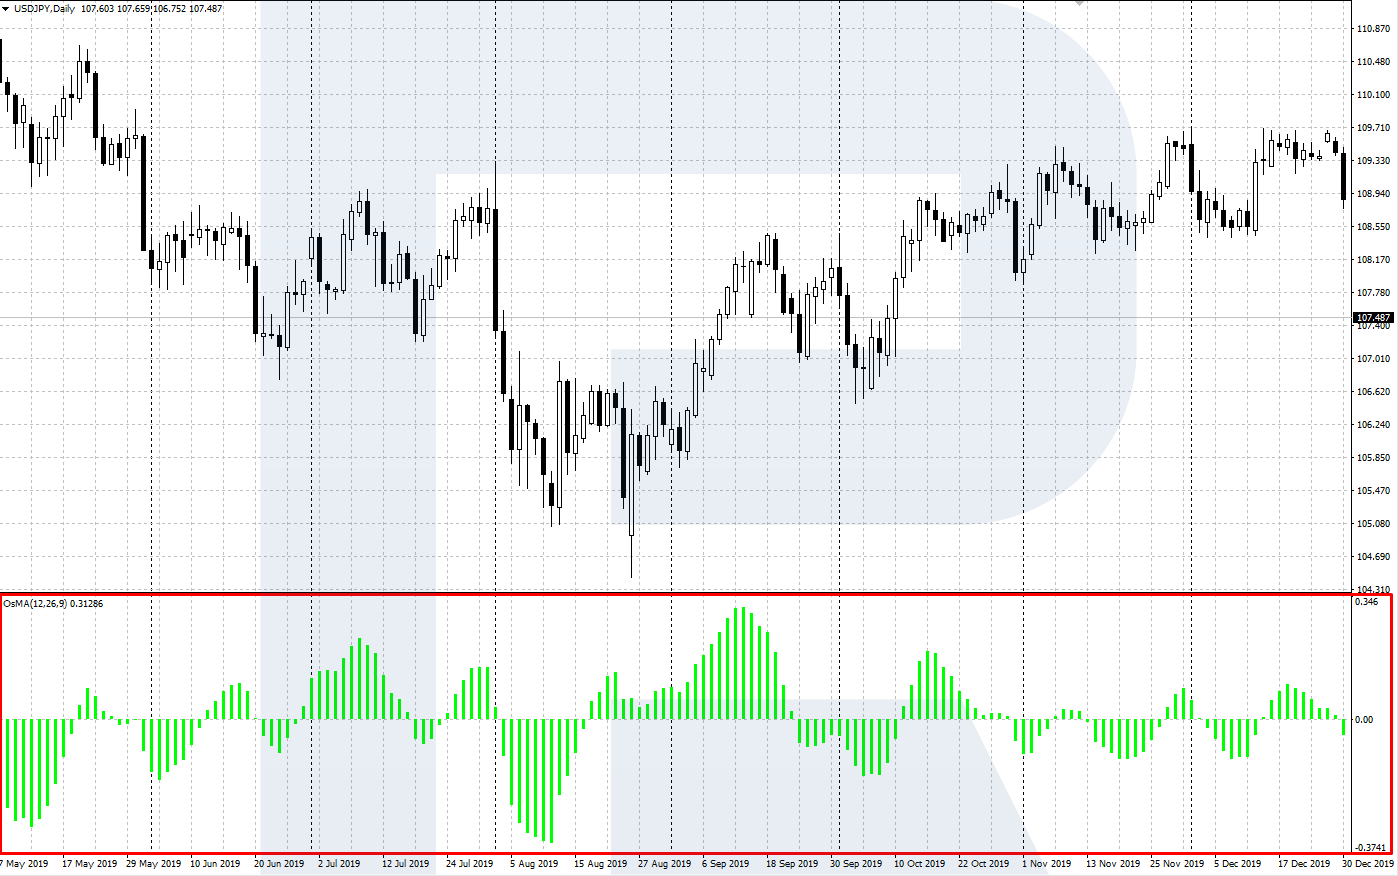


Characteristics and settings of OsMA
To add the indicator to the price chart on MetaTrader 4 or 5, click the Main Menu: Insert – Indicators – Oscillators – Moving Average of Oscillator
The formula for calculating the indicator is as follows:
OsMA = MACD - SMA (MACD); MACD = ЕМА12 - ЕМА26
Where:
MACD is the value of the MACD histogram, calculated as the difference between to Exponential Moving Averages (EMAs)
EMA is the Exponential Moving Averages
SMA (MACD) is the signal line of the MACD, a Simple Moving Average.
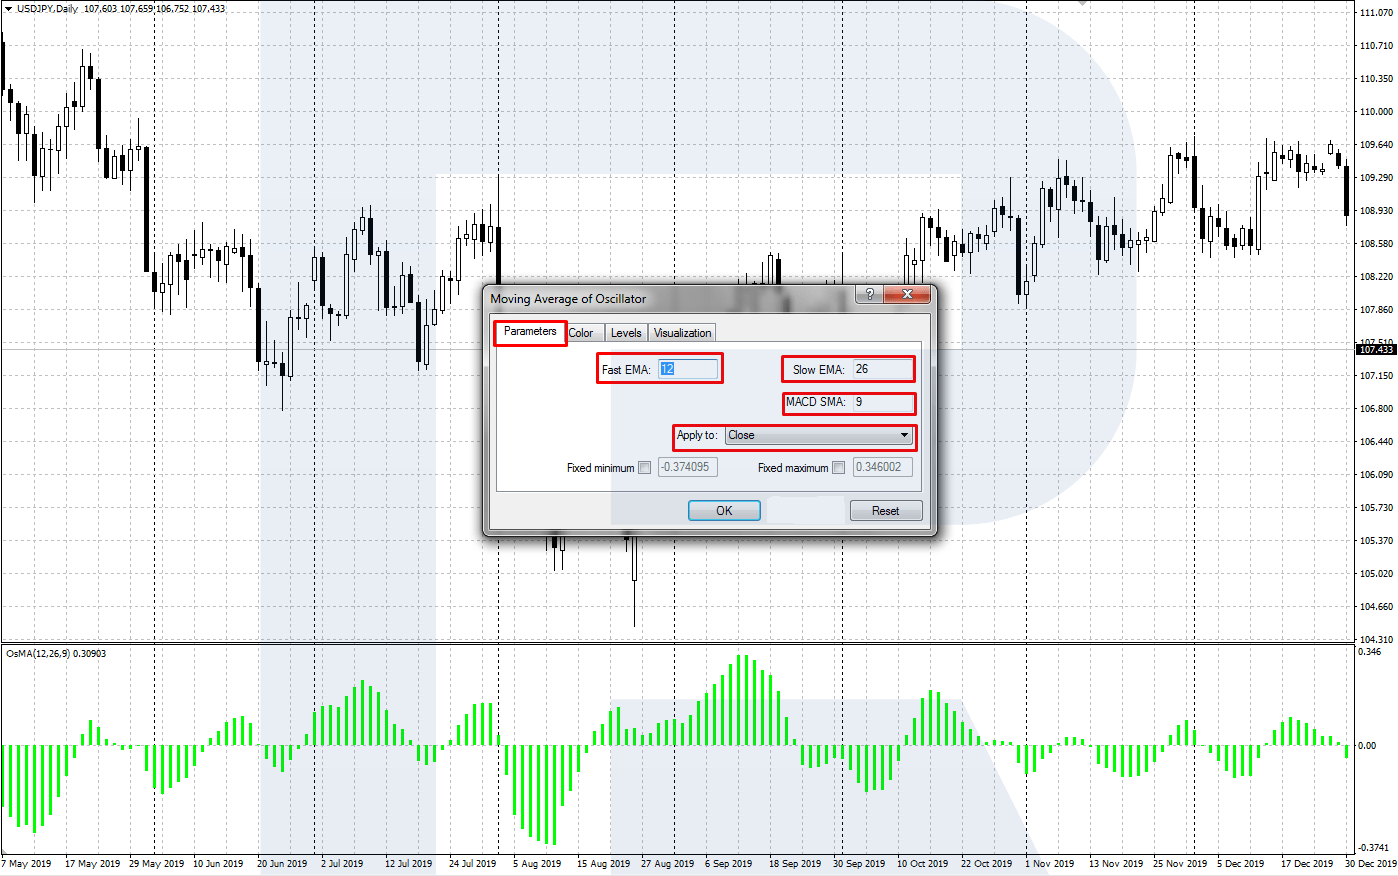
When installing the OsMA indicator, the following parameters must be set up:
- Slow EMA is the EMA with a large period. By default, it is set as 26.
- Quick EMA is the EMA with a shorter period. By default, the setting is 12.
- MACD SMA is a Simple Moving Average, the signal line of the MACD. By default, it is set up as 9.
- Apply to – specify the necessary price type here. By default, the Close price is used.
The OsMA indicator normally works well with the default settings. However, you can always customize the indicator, evaluating its work historically.


OsMA trading signals
Let us discuss the two main trading signals generated by the OsMA indicator.
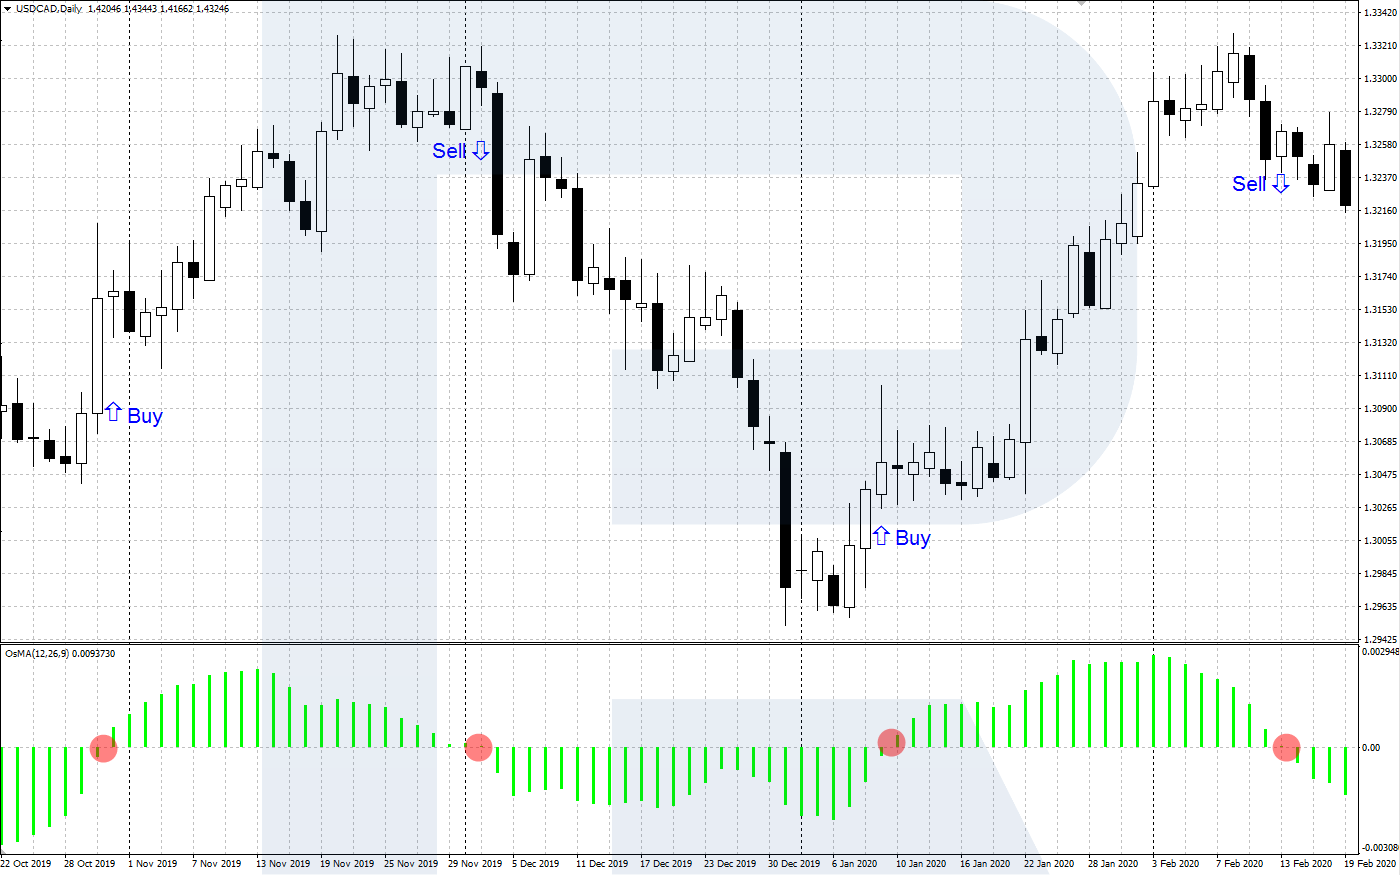
Crossing the zero level
The main axis of OsMA is the 0 level. If the level is crossed from below by the histogram, this means active growth of the market. Right after the bar of the histogram closes above zero, you may open a buying position with the SL behind the local low.
And vice versa, the decline of the OsMA histogram below 0 confirms the descending mood of the market. After the histogram closes below 0, selling is recommended with the SL above the local high. To make the signals more reliable, I recommend using them with the classic tech analysis.
The divergence of the OsMA and price charts
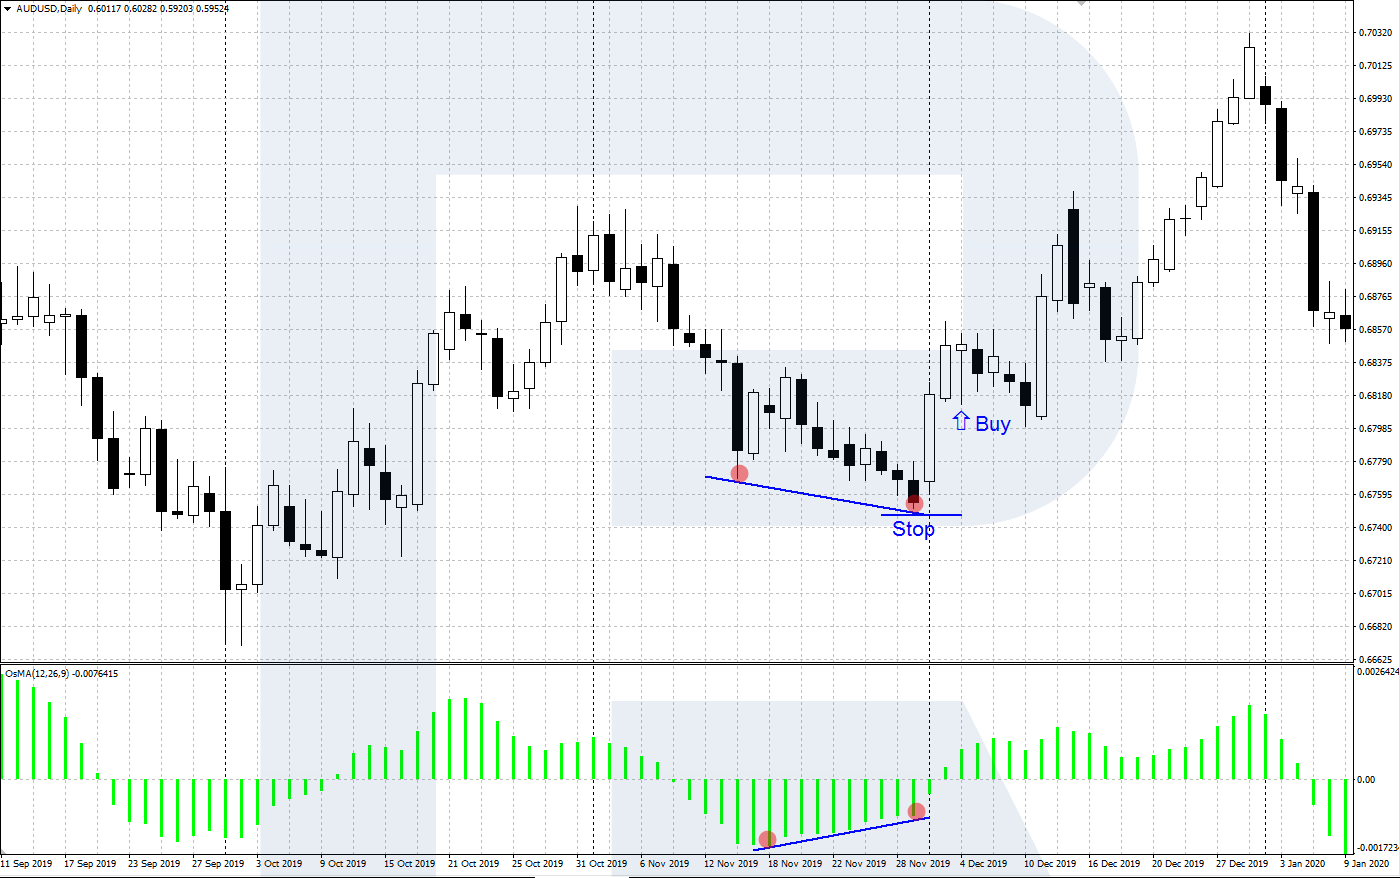
A divergence that signals buying forms, when the price demonstrates the next low under the previous one, while the low of the OsMA histogram turns out above the previous one. This signals the weakness of the bears and allows the bulls to fight back. When the price chart reverses upwards, open a buying position with the SL behind the local low.
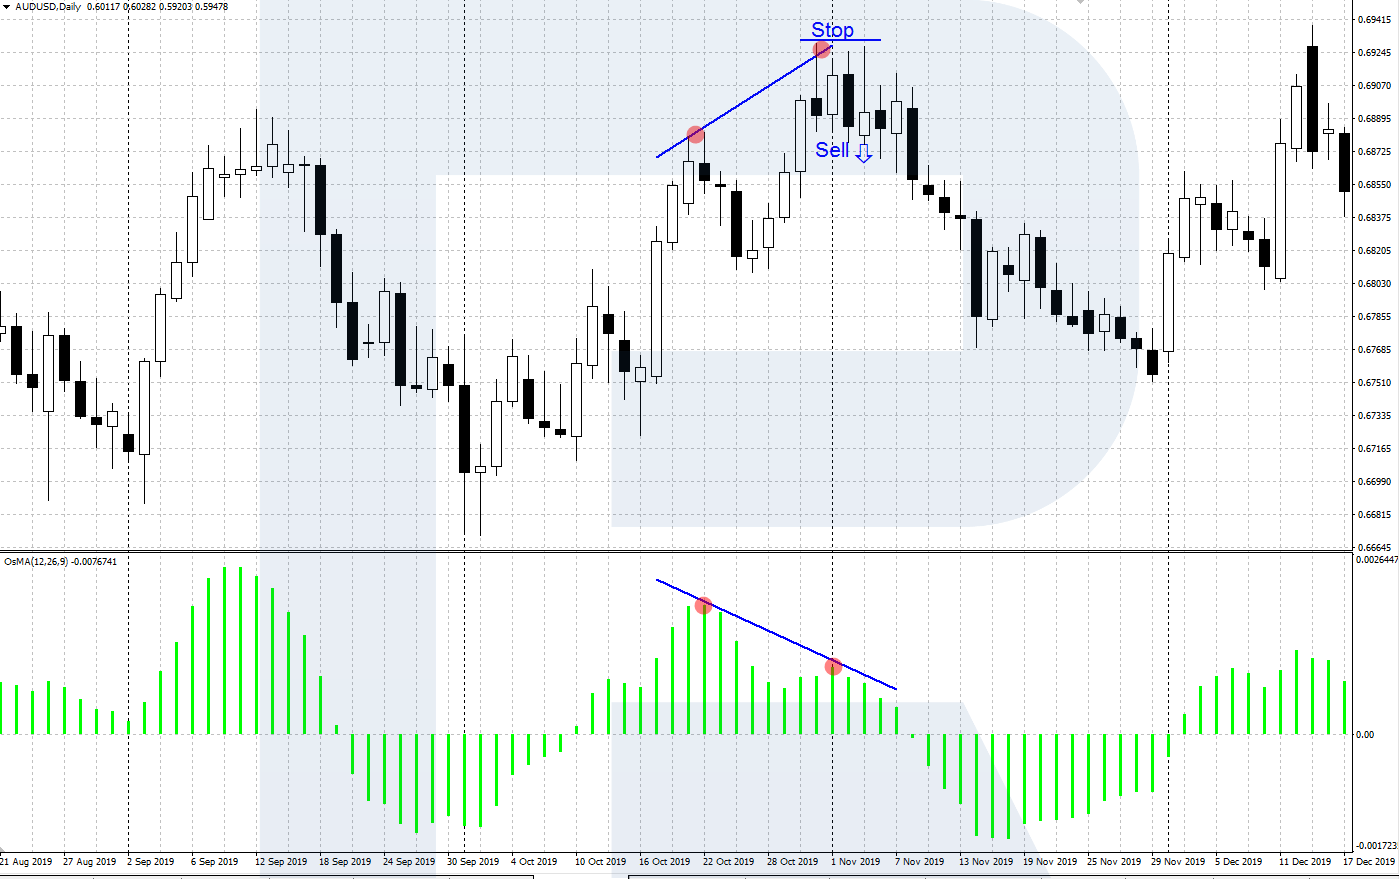
A divergence that recommends selling appears, when the price chart forms the next high above the previous one while the OsMA histogram demonstrates a high lower than the previous one. This means that the bulls are losing strength, so the bears may try to reverse the price downwards. When the price heads down, you may open a selling position with the SL behind the nearest high.
Closing thoughts
The OsMA indicator is quite a curious modification of the more famous MACD indicator. It shows divergences forming on the market very well and gives signals a bit earlier than the classical MACD. However, it is not a universal trading system, so it is better to be used alongside trend indicators and the instruments of tech analysis.