Trading the News: Preparing a Trading Plan

5 minutes for reading
Introduction
I guess, it is no secret that the main trigger of quotation movements on the market is the publication of important fundamental news, such as the decisions of central banks of the leading countries on interest rates, various macroeconomic indicators, speeches of politicians, etc. The influence of fundamental data on the movements of currency pairs is studied by a special type of analysis, which is called fundamental analysis. It is included in all curricula for beginner traders. However, this type of analysis provides only general recommendations, such as: "if the data on the British GDP is worse than forecast, the pound will fall" or "if the Fed increases the rate, the dollar will grow."
It is all true, only how should we apply this in practice?
Though we are not long-term investors, who invest in a certain asset without leverage, owning large amount of capital and having the opportunity to wait for profits for months and years. Short-term trading requires a precise entry to the market, when the trader makes their mind in advance about where and when to enter, where to place a Stop Loss or a Take Profit? I suggest splitting the preparation for trading the news into three parts: choosing the time, preparing a trading plan, and trading in accordance with the plan.
Choosing the time for trading the news
For this, we will need the economic calendar and the basic knowledge of fundamental analysis. Take the calendar for the current week, pick the news that is having a maximal influence on the market, judging by the fundamental analysis. Such news may give a strong impulse for the movement of currency pairs and other financial instruments. Such news might be:
- Publication of the data on employment in the USA
- Decision of the Bank of Canada on the rates
- Brexit voting in the British parliament, etc.

The example shows the publication of data on retail sales in Canada at 15:30 Moscow time, on May 22nd. This piece of news had a strong influence on the exchange rate of the Canadian dollar, and the time of its publication could be used for trading, provided you have designed a plan.
Preparing a trading plan
After we have chosen a suitable piece of news, we should analyze the price chart and decide where and how we will open a trade. Here, technical analysis comes to our rescue: it will show the closest strong levels of support/resistance, price or graphic patterns that we can use as landmarks. They will help us choose an optimal place for entering the market and evaluate the perspectives of the price movement.

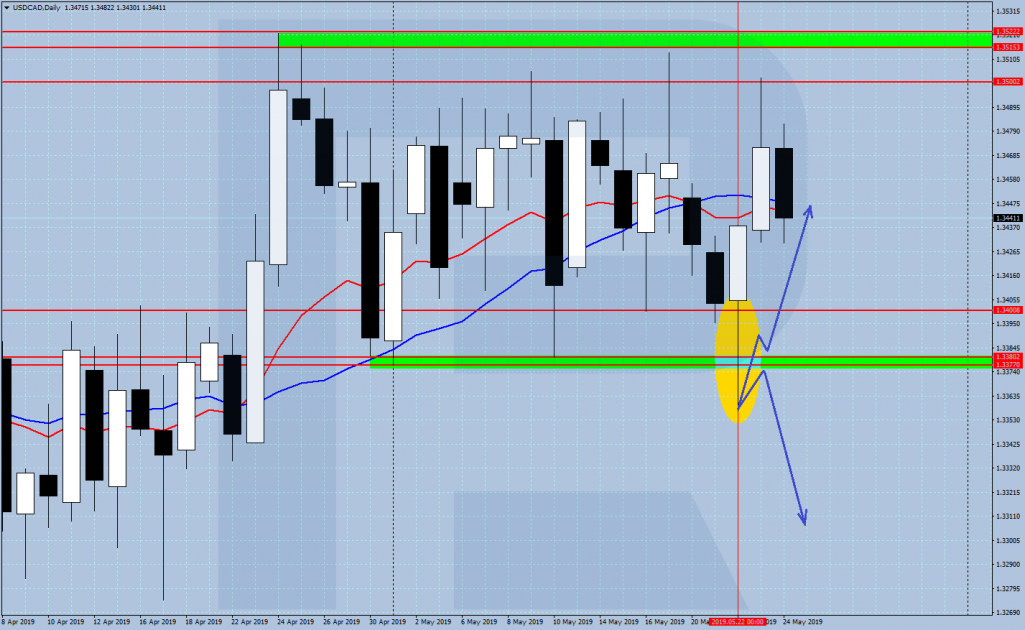
The example shows the USD/CAD pair before the emergence of the news on retail sales. The price is inside a daily flat near its lower border — the green area of 1.3377-1.3380. This is a strong support level, and we can design a trading plan on the basis of the price reaction to this level after the publication of the news. Most often, I consider two main scenarios: a confident breakaway, then a small pullback, and then further movement in the direction of the breakaway; and a false breakaway, when the price "pierces" the level, then returns behind it, and then proceeds in the direction counter the breakaway. So, we should design a trading plan for both scenarios:
- If we see the confident breakaway of the level, we sell the pair after the small pullback, counting on the further descending; we place an SL above this level and a TP — near the next strong support level.
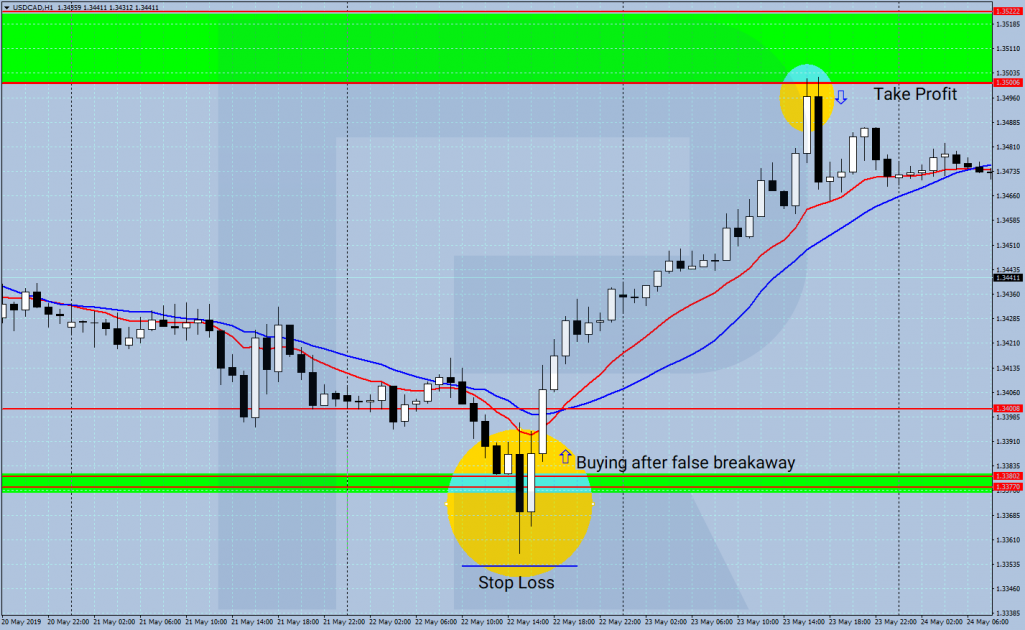
- If we see the false breakaway of the level, we buy the pair after the return behind the level; we place an SL below the price minimum after the false breakaway and a TP — near the upper border of the daily range.
Trading the news in accordance with the plan
What is left then is acting strictly in compliance with the plan. We wait for the publication of the fundamental data and, depending on the reaction of the price, carry out or do not carry out the trade. In our example with the Canadian dollar, the price formed a false breakaway after the publication of the data on retail sales. The lower border of the daily range was pierced, so the plan to buy triggered. The next day, the USD/CAD pair reached the upper border of the daily channel, the area of 1.3500, and we locked in profit.

If after the publication of the data the price goes differently and does not reach our goals, it means that the trading plan does not work, and we simply abstain from carrying out trades, waiting for other trading opportunities that will inevitably emerge. The SL to TP ratioб I advise keeping at 1/2 or higher.
Summary
We do not really care whether the news is better or worse than expectedб as practice shows that, regardless of the actual data, a movement may be in any direction. No matter what, we watch the price at the chosen support/resistance levels and strictly comply with the trading plan. I hope, I have managed to explain to you the very essence of using fundamental data for short-term trading on this example. The practical details that we have not discussed will be, hopefully, spoken about in the upcoming posts.
Successful trading, everyone!


