Catch the Wave with Surfing Strategy

5 minutes for reading
Most often, beginner traders consider trading the trend to be a complicated process. Today, we are looking into a simple but efficient strategy called Surfing. Using such a strategy, any trader can pretend a surfer catching a wave to ride. However, here we will not just ride the market waves but will try to make a profit on their peculiar movements.
About the system
Many trading systems are based on Moving Averages because this instrument shows the trend direction most clearly. For example, if the price is below the MA, we consider the trend descending and recommend selling. Conversely is the price is above the MA, we call it an uptrend and recommend buying.
The method we are talking about is no exception, here, we use Exponential Moving Averages and a Simple MA. Also, we will need the RSI, a very popular analysis instrument of modern trading.
A combination of both a trend indicator and an oscillator showing the fluctuation of the price from the average is considered to be one of the best.
The system parameters
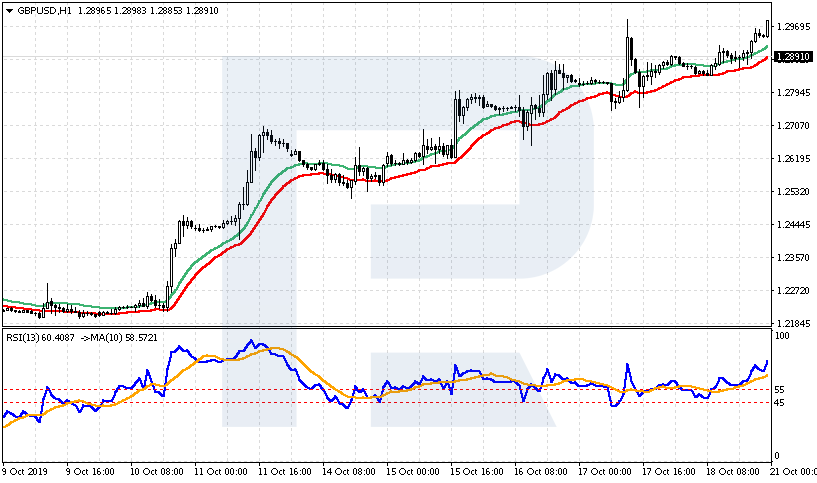
The Surfing strategy is intraday and works well on small timeframes from M15 to H1. For full-scale work, prepare your chart, i.e., add all instruments of technical analysis that will give entrance and exit signals:
- EMA (20) is an Exponential Moving Average with period 20. Drawn by the maximal price (High), color green.
- EMA (20) is an Exponential MA with period 20. Drawn by the minimal price (Low), color red.
- RSI (10) is the Relative Strength Index. Period 10. Drawn by the closing prices (Close), color blue. Here, we add two levels: 45 and 55.
- SMA (10) is Simple Moving Average, period 10, color orange, added to the RSI chart. For everything to work smoothly, choose "Previous Indicator's Data" in the MA settings.

The signal to buy in the Surfing system
As we have noted above, we only work intraday, so we can start analyzing the chart and searching for an entrance as soon as the London session opens, which is 10 a.m. (GTM +3). For a signal to buy to appear, the following rules should be complied with:
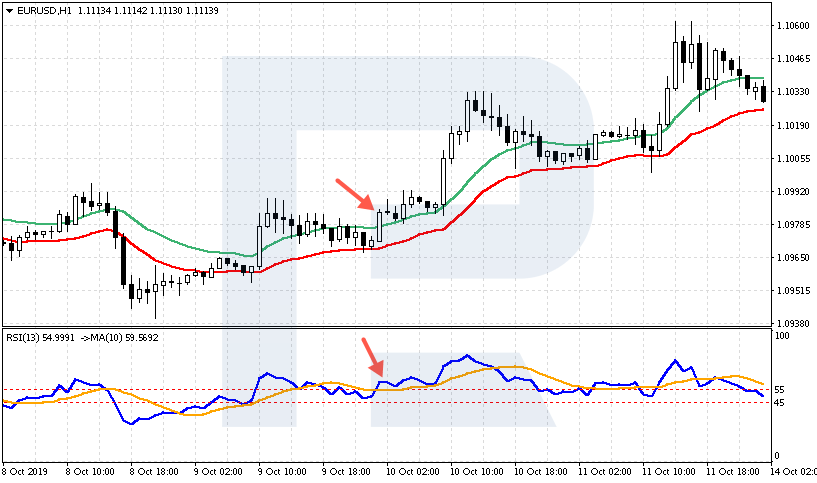
- The closing price of a candlestick is above the green EMA 20.
- The RSI values have crossed the level 55 from below.
- The RSI values are above the orange SMA.
Let us have a look at the example with the currency pair EUR/USD. As we may see, the candlestick closed above the red MA; the RSI is also above the orange MA and above 55. Such a situation signals to buy.

The signal to sell in the Surfing system
In the case of sells, all the rules become the opposite. Particularly:
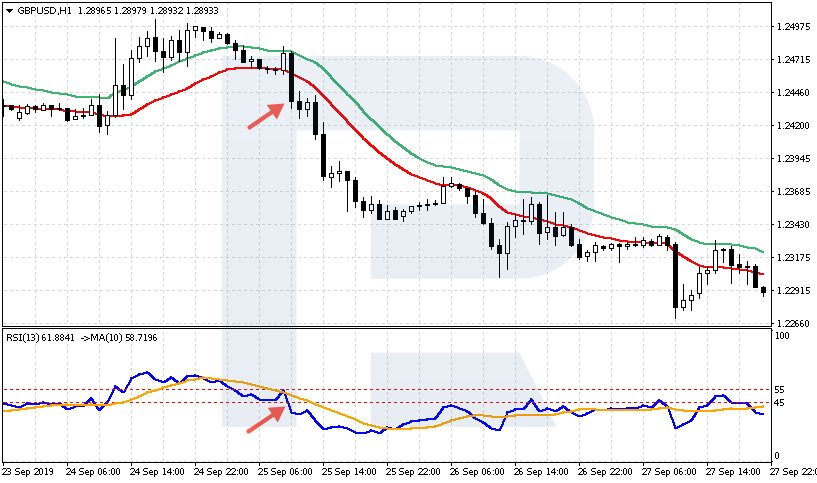
- The closing price of the candlestick is below the red EMA 20.
- The RSI values have crossed the level 45 from above.
- The RSI values are below the orange SMA 10.
Let us discuss a selling trade on GBP/USD. As we may see, the candlestick closed below the red EMA, the RSI values are below the orange SMA, having broken through 45 from above. This is a signal to sell.

Closing trades
Opening a position, it is essential to put a Stop order the right way and not to forget your risk management rules: the risk should not be over 2-3% of your deposit. In the case of buys, we put an SL below the red EMA 20. And if we open a selling trade, we put an SL above the green EMA 20.
Also, we can try placing a Trailing Stop and moving along with the market. If it reverses, the trade will close with a profit.
Profit may be locked in when an opposite signal forms. Another option is to wait for the RSI to break through the SMA 10.
For example, is we are holding a buy and see that the RSI values have dropped below the orange MA, we can close the position with a profit. Conversely, if we have a sell open, we wait for the RSI to rise above the orange MA, which will signal to close the position with a profit.
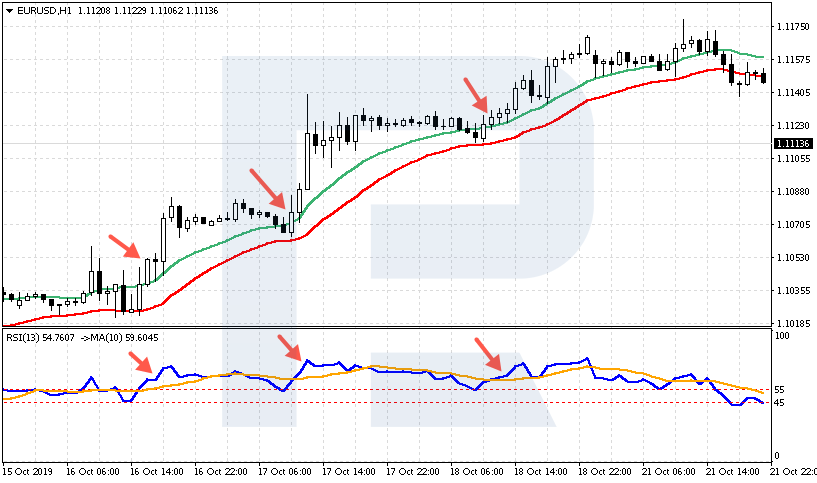
If there is a strong trend on the market, signals will follow one another. On the example of EUR/USD, there were three signals along with the general trend, and all of them executed fully.

Summary
The Surfing strategy has very simple and clear rules for entering and exiting the market. It should be remembered that any trading method is customizable and has its weak and strong points.
The advantage of the Surfing system is its orientation on catching the general direction of the market movement. We do not attempt at reversing the current trend, which for beginners usually ends up in mistakes, but simply move along with it. Good trends will give a series of profitable positions.
The drawbacks of the system include the necessity to watch the market constantly, waiting for the entrance signal, which may appear at any moment of the day.
Any trader shows better results when they use ready-made rules of work, compared to intuitive trading. Following strict rules always appears better for a beginner. The Surfing system provides such rules for the start, allowing you to create your personalized system with time if you need one.


