How to Trade Support and Resistance Levels

8 minutes for reading
Horizontal support and resistance levels are at the base of classical tech analysis. Many traders despise such a simple instrument and avoid spending their time on studying the basics of graphic analysis. However, the influence of the horizontal levels on the price movements is hard to deny.
Any trend is a sequence of support and resistance levels, so we can see tests and breakouts of such important areas every day. I recommend paying attention to this aspect of analysis and studying this instrument to be able to detect these levels.
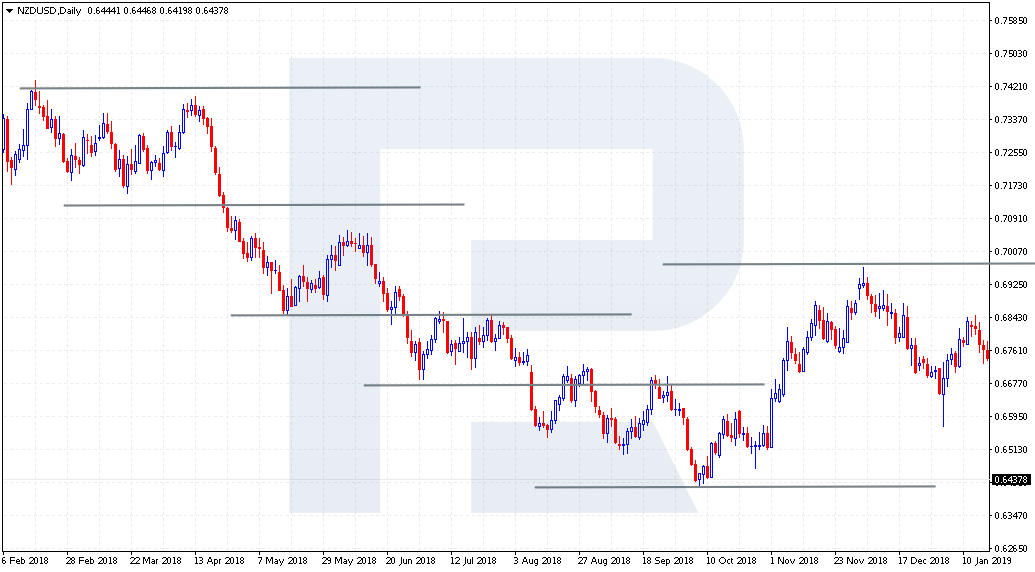
Putting it very simply, near the support level you should buy while at the test of the resistance area, you should sell.
What is the support level?
In theory, a support level is an area below the current market price where the players can buy; this area is highly probable to remain under the pressure of sellers. T the moment of testing the support level, the prices push off it and start growing; hence, the pressure from sellers shrinks as they cannot secure under the level to continue the decline. We can say that buyers are stronger.
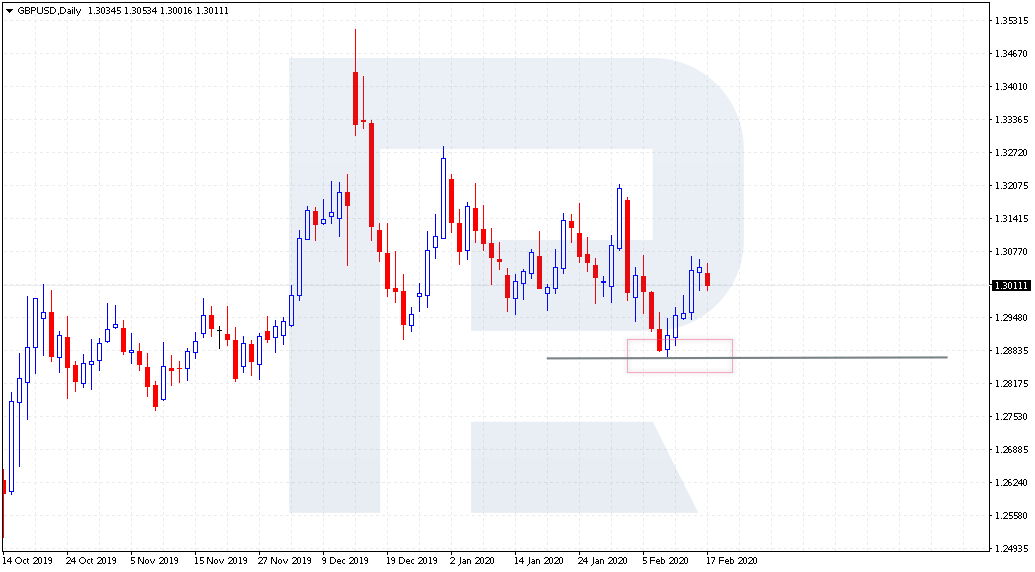
As a rule, such levels can be detected on the chart beforehand. We can use both the daily and hourly charts. However, experienced traders say that longer timeframes are more important. For example, a support level on D1 will be much stronger than the support level on M5.
On D1, the prices can be testing the support level for weeks before the bears manage to push the price down. As for M5, one test may be enough to secure below this level and move to the next one.
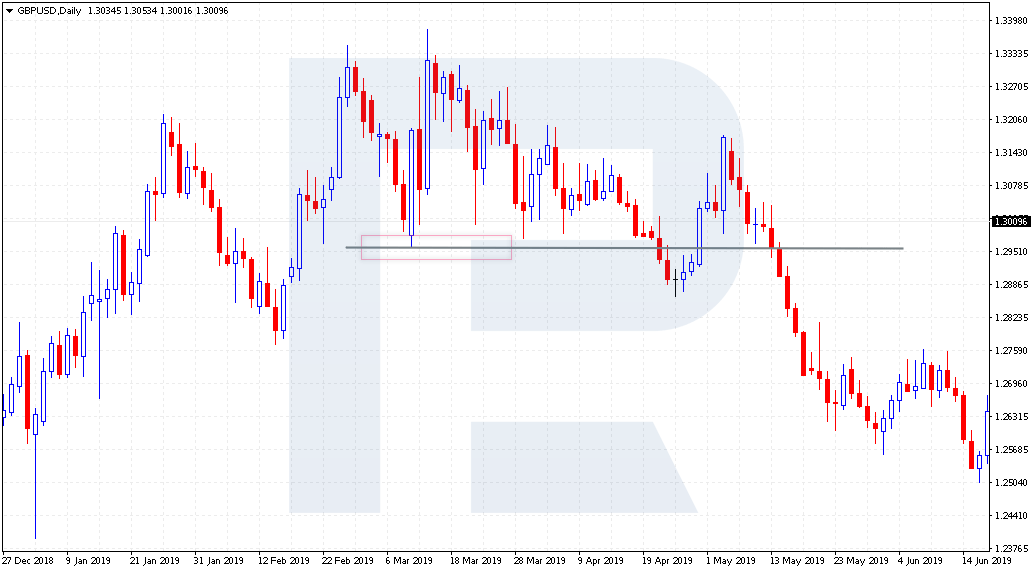
Also, with a breakout of the support level, we can speak about the end of the uptrend development. If the prices are growing, and after tests of the support level we keep seeing bounces and further growth, we may speak about further growth. Conversely, if we see a breakout of the support level, we can consider the end of the uptrend on the chart.
What is the resistance level?
The resistance level is opposite to the support level. While the support is below the current market price, the resistance is above it. Thus, the resistance is the area where the pressure from sellers is much higher than from buyers, the prices bounce and fall. So, at the moment of testing a strong resistance level, the prices push off it quickly and start moving in the opposite direction.
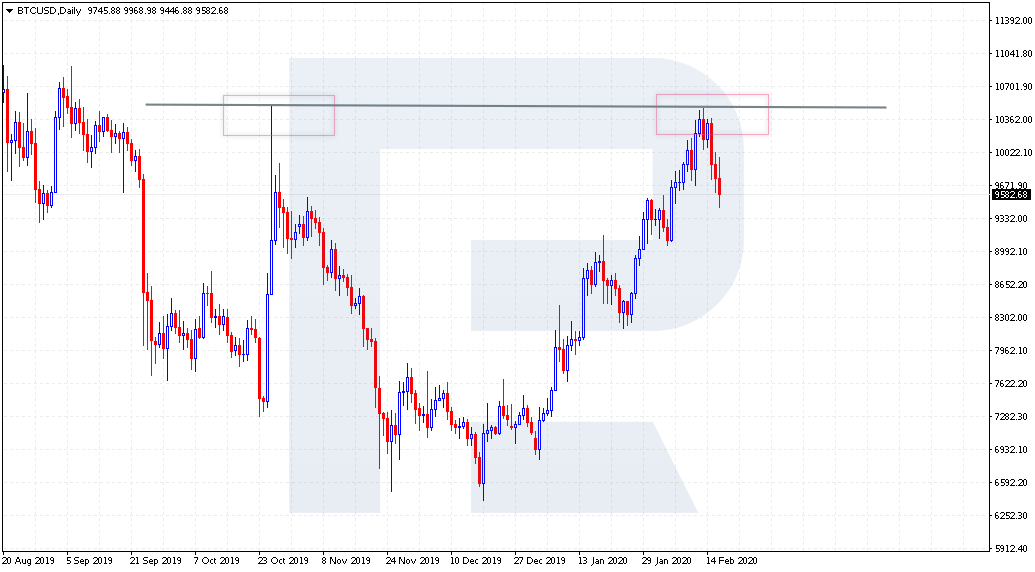
At the development of a downtrend, resistance levels are places for conservative selling along with the trend. Again, the general rule is to sell at the resistance and buy at the support levels. So, if the trend is declining, this is a correction going on, followed by a test of the resistance. In this case, the buyers go weak, and the prices decline along with the current trend.
How to detect support and resistance levels on the chart?
Unfortunately, like other any type of graphic analysis, detecting support and resistance levels may be subjective. Hence, the quality of support and resistance levels detection on the chart depends on the expertise of the trader. If we are drawing the levels for the first time, it may be hard to understand which area is good and which one is better skipped.
For example, there used to be a nice exercise: a beginner trader was given a printed chart and told to draw support and resistance lines on it. After several repetitions of the exercise, the beginner will learn to detect the levels easily on real charts. In other words, practice makes perfect.
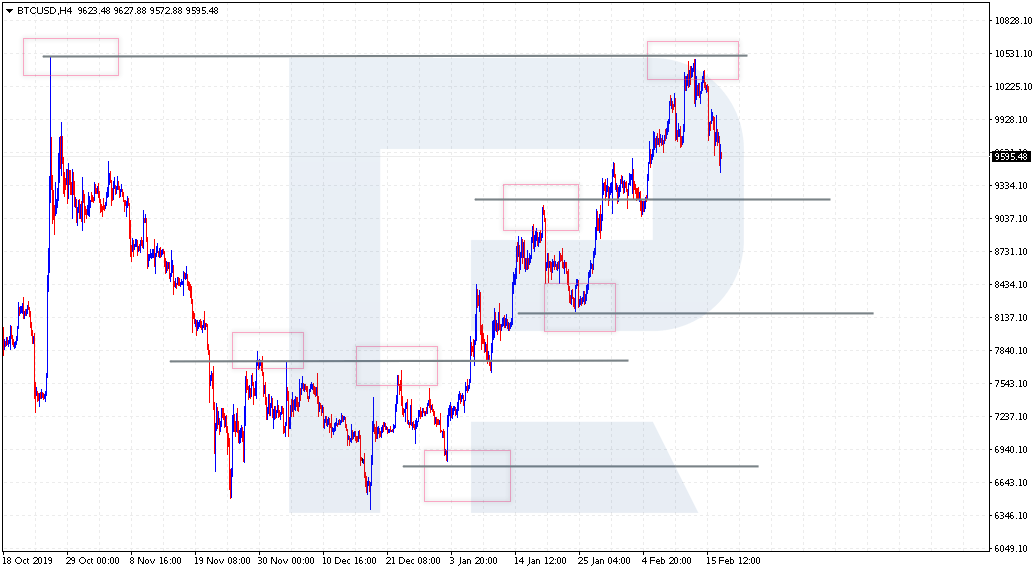
To draw a level, it is important to see the price bounce off this area in the past. Next, we simply draw a horizontal line. It is also worth remembering that the support or resistance level is not a certain price on the chart but more like an area. So, it can fluctuate a couple of points here or there, if we are on H1, or a couple of dozens of points if we are on D1.
Ways of using the levels
There are many ways of using the levels: some will use only them while others will simply add them to their trading systems.
There are such traders who simply take daily charts and place pending orders to buy or sell near the levels that they consider important. If in the past the price on D1 pushed off the resistance level, most probably, it will not manage to break out this area at the first attempt, so there will be a bounce that might bring a profit.
Hence, the simplest way is to buy at the support and sell at the resistance. However, if the trend on the market is bullish, we can either buy at the support or already at the breakout of the resistance level.
If the trend is descending, it is important to sell at the test of the resistance level and after the prices have dropped under the support area.
Trading bounces off the levels
This is a rather simple approach mostly used in flats. The idea is as follows: when the price tests the support area, we just buy placing the Stop Loss a couple of points below the support level. If the price pushes off this support level, we can either lock in profit at once or move the SL to the entry point and wait for a strong bounce off this area.
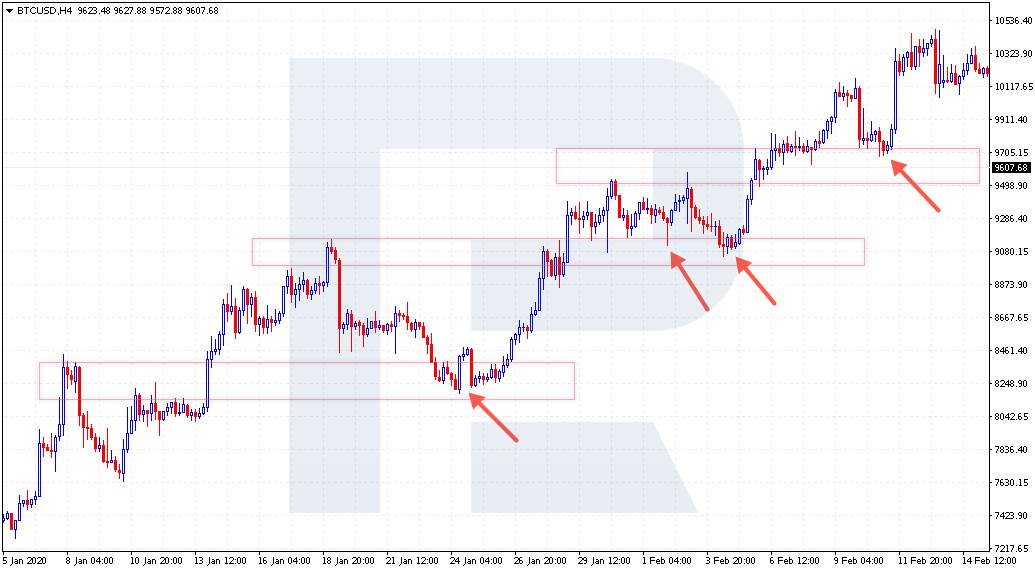
With testing the resistance area, it is alike. We just sell at the moment of the test, placing the SL some points above the resistance area. Unfortunately, we never know in advance if this level will be broken, so we just stick to the rules.
Trading breakouts of the levels
This option can be used both at the escape from a flat or in a strong trend. Here, we do the other way round. When the prices are testing the support, we do not try to buy but simply wait for them to drop lower. At such a moment, we can sell, placing the SL above the support level. Thus, we will watch the support and resistance levels swap places.
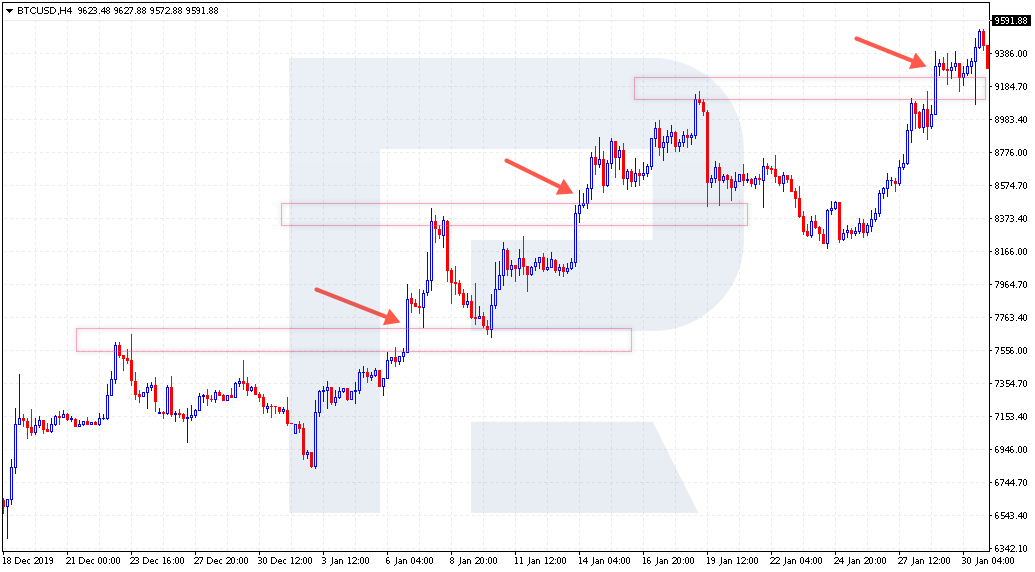
Same at the moment when the price reaches the resistance level. Here, we do not hurry to open a selling trade but instead, wait for the candlestick to close above the resistance level. As soon as this happens, we can buy, placing the SL below the level. Here, we will see the resistance level become the support after a breakout.
Using the MACD
For many, just the levels are not enough, so the MACD indicator can be added. It can generate good signals called divergences on its own. However, with the support and resistance levels, the quality of these signals will be enhanced, and we will receive an additional entry point.
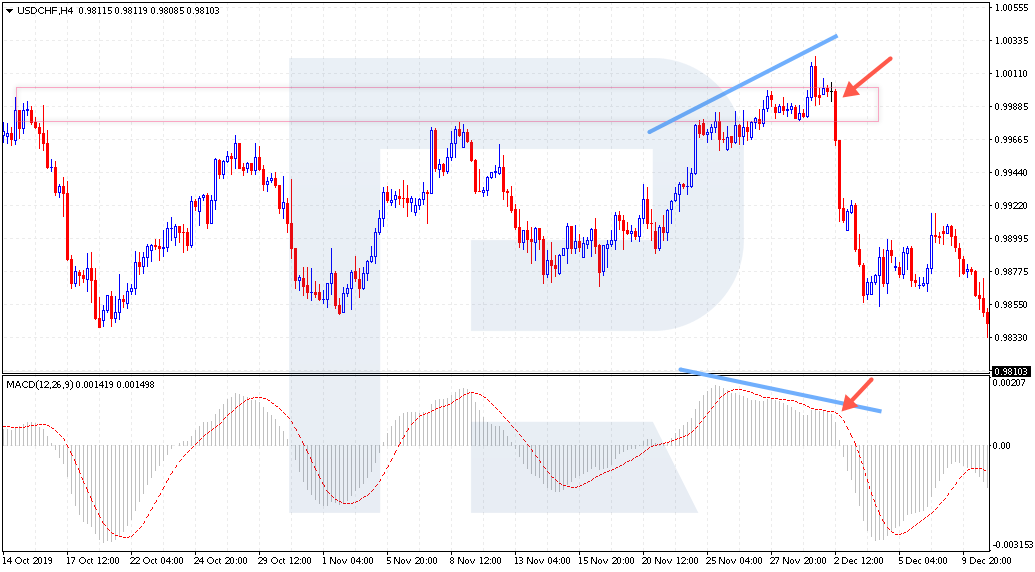
For example, if we see a divergence forming on the MACD near the resistance level, we can take our time selling and wait for the signal line of the indicator to leave the histogram area. Thus, we will receive two signals to sell: a bounce of the resistance level and a divergence on the MACD. As a confirmation, we can wait for a breakout of the nearest support level and only after that open a trade to sell.
Using the RSI indicator
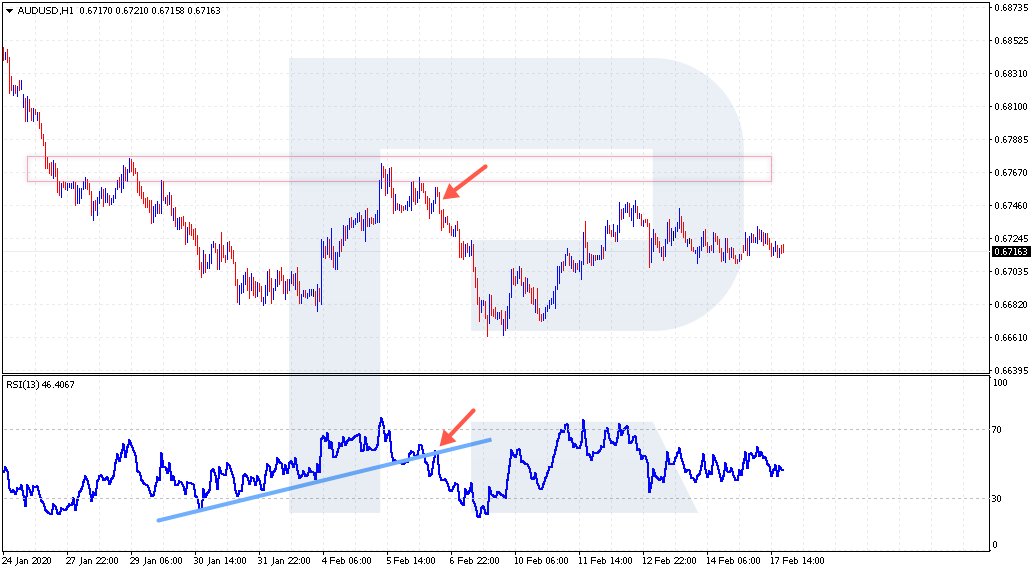
This time, we will again simply add the signal from the popular RSI to the test of the level. Only, unlike the MACD, on the RSI, it is very comfortable to draw trendlines and a breakout of such a line will give a signal to enter the market. So, at the test of the support line, we do not hurry to open a trade to buy but wait for the RSI values to break out the resistance line. Only after that, we enter the market. The SL is under the support level.
Bottom line
The graphic analysis is a subjective way of trading. At first, using horizontal levels may seem complicated, but many traders use them on stock markets or Forex. Experience will make these levels easy to find on the charts, and by adding various indicators you can design your trading strategy, unique and simple. Making a profit does not necessarily require using complicated strategies, you can stick to simple methods - the main thing is to follow the rules of money management.


