Ruler Strategy: Trading On Daily Charts

6 minutes for reading
Trading on intraday charts remains popular among traders because it allows making a quick profit. Less eagerly, they trade larger timeframes, such as daily and weekly ones, where trades open rarely and a profit is long to wait.
On the other hand, not everyone can spend long hours in front of the screen, watching the signals of the system. At times, we want to look at the trading terminal less often. A good decision here will be trading on daily charts with the Ruler strategy.
Signals will form seldom; you will need to look at the market situation for several minutes once a day and open trades after the current day closes.
The description and peculiarities of the Ruler
The system supports all currency pairs without limitations. However, it is usable on the daily chart only. The system forms signals rarely but you may increase the number of trades by adding more currency pairs.
Note that you may enter the market strictly after the daily candlestick is closed. If you try to enter earlier, the prices may be different at the moment of closing, hence, the signal itself may change. Taking your time to open the position will be the best choice as you are trading on a daily chart, and several points or even tens of points will not make much difference.
The instruments necessary for using the system:
1. A Simple Moving Average with period 10 is used for entering the market; to add it to the chart, go to “Indicators” - “Trend” - “Moving Average” in your trading terminal.
2. A Simple Moving Average with period 200 is used to evaluate the potential for opening a position.
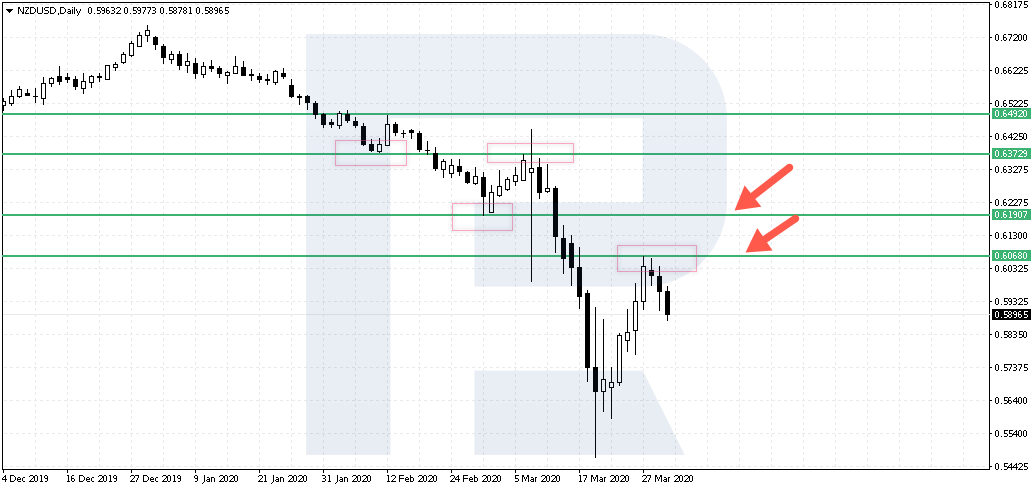
3. Support levels are horizontal levels on the chart below the current market price, off which it has already bounced.
4. Resistance levels are horizontal levels on the chart above the current market price, off which it has already bounced.
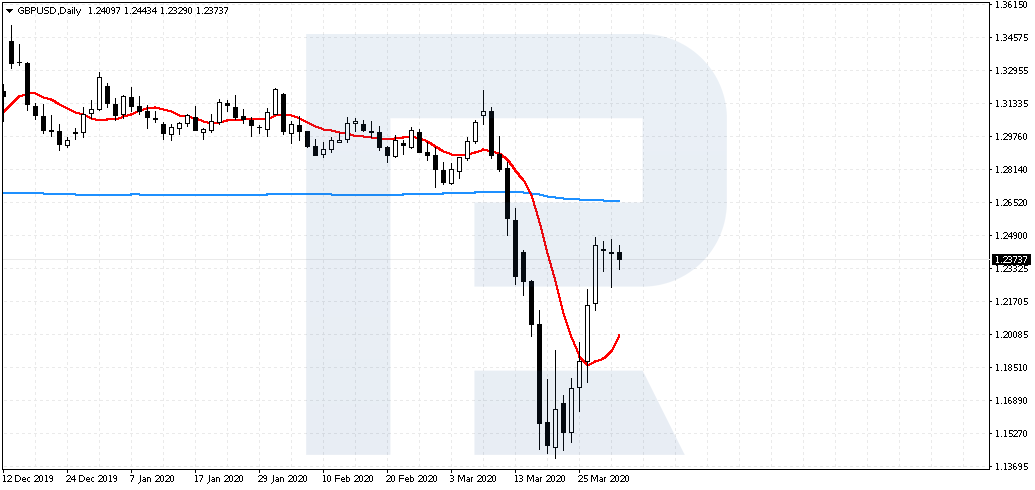
Moving Average
The Moving Average is the oldest trend indicator, and some authors insist that it has helped to earn most of the money on financial markets. Indeed, at the moments of strong trends and a general panic with fast movements, it is the MA that generates high-quality signals and makes the trader hold the most profitable positions as long as possible.
We use two MAs with periods 10 and 200; by default, they are Simple but remember that you can always experiment with the settings.
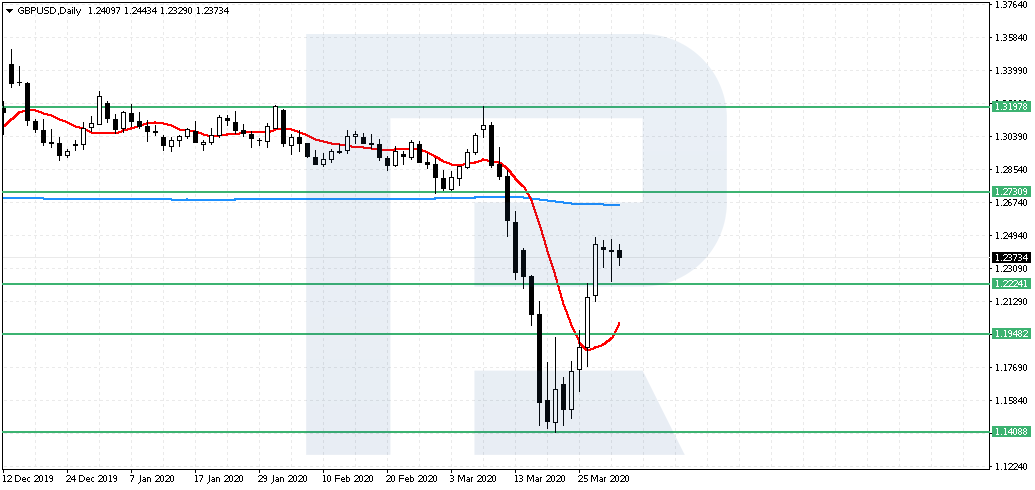
Support and resistance levels
The next important step in the work is drawing and finding important support and resistance levels. They are drawn manually, so their quality and exactness depend on the trader only. Hence, working by this strategy, we will not only follow its strict rules but also learn to analyze the price chart and look for the opportunities to open positions near these horizontal lines.
You can study this topic in more detail if you read the article “How to Trade Support and Resistance Levels” in our blog.
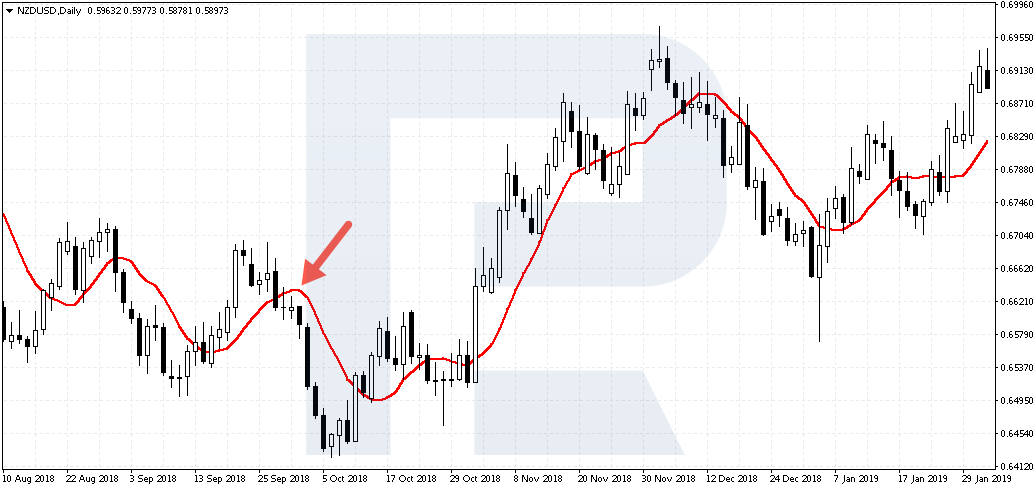
How to open a selling trade by the Ruler system
The first condition for opening a selling trade is a bounce of the price off the important resistance level. The second signal is the closing of the candlestick below the MA with period 10.
It is also important that the distance to the MA 200 and the support level was not too small. If it is small, your losses may be huge, while your profit – tiny. And the money management rules state that the potential profit must be larger than the potential loss.
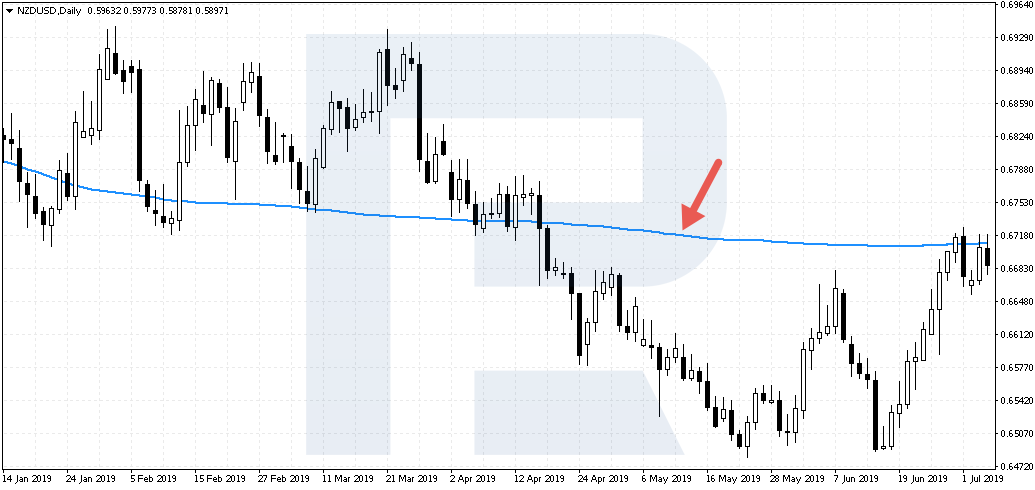
Next, we open two selling trades at once, with Stop Losses over the resistance level. The first trade will be closed when the profit reaches 100 points. As soon as this one is closed, we may take the SL of the second one to the breakeven.
The Take Profit of the second position is placed at the level of the MA 200 or before the nearest support area. If the price, after a significant decline, returned above SMA 10 again, this will signal to close the position.
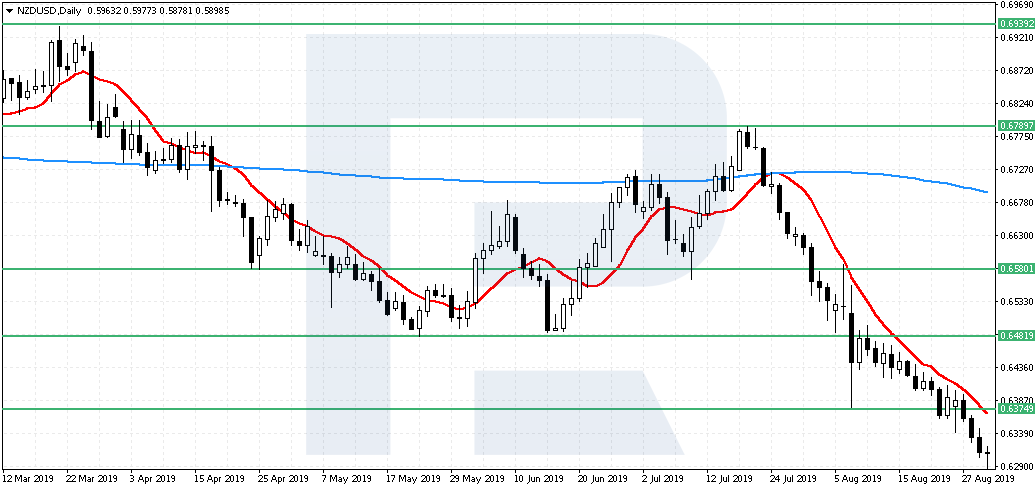
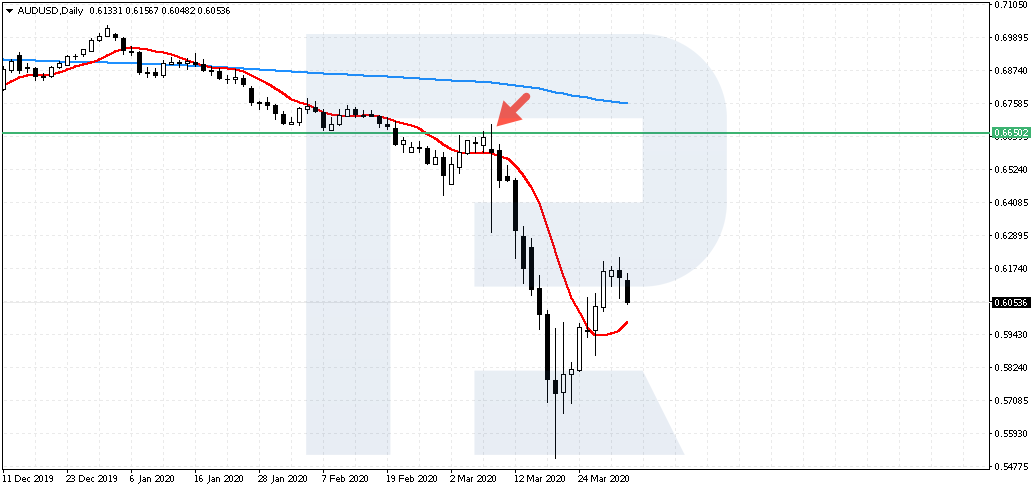
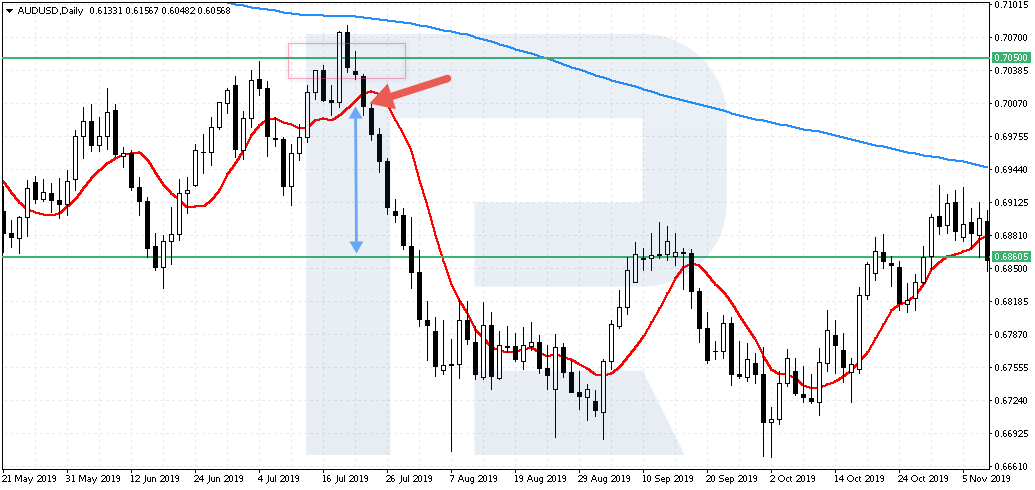
An example of opening a selling trade
The currency pair is AUD/USD. As we may see, after a bounce off the resistance level, the prices have broken the SMA 10 top-down on July 23rd, 2019. For us, it is a signal to sell at 0.7000. The SL, in this case, is placed above 0.7065. The first TP is placed at 0.6900, the second one – at the nearest quality support level, which is at 0.6860.
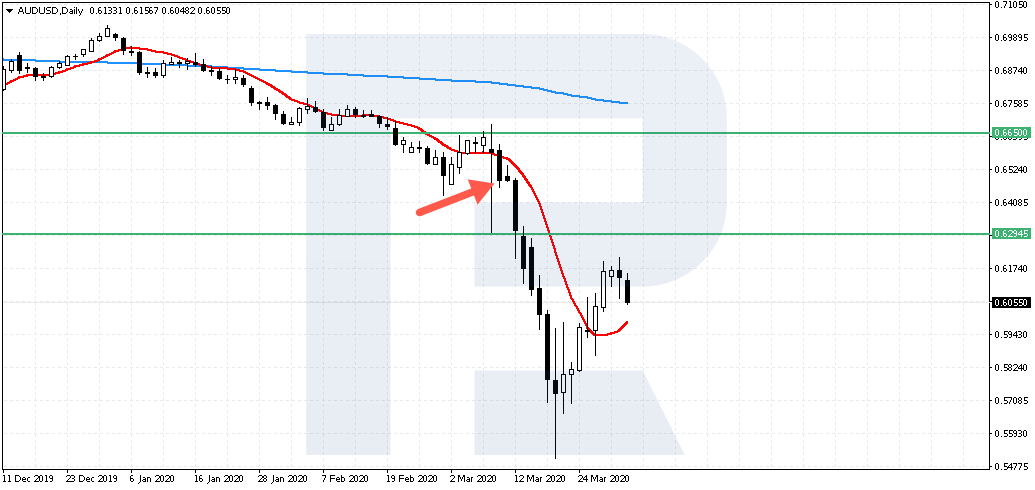
Thus, both our positions closed with a profit. However, we see that the prices went even lower, so we might let the profit from the second order grow and not hurry to exit near the closest support area.
The rules of opening a buying trade by Ruler
Here, we also start by looking for an important support level on the daily chart. If there is a bounce, we go to point two of the rules and wait for the breakout of the SMA 10 upwards by the closing prices. Then we evaluate the distance to the SMA 200 or the nearest resistance level. If it is less than 100 points, we better skip the trade.
Then, we open two buying trades at once. The SLs are below the support level, which the price has bounced off. The TP for the first position is 100 points higher than the entry point. For the second position, we place the TP near the resistance level or simply watch the trade and at the moment the closing prices break the SMA 10 downwards for the second time, we close the position.
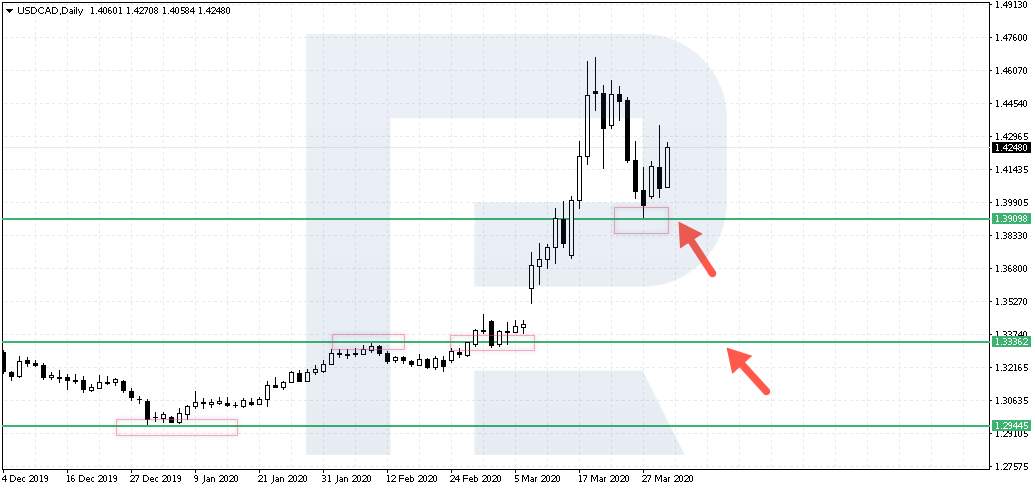
An example of opening a buying trade
The currency pair is USD/CAD. After a bounce off the support level, the closing prices broke the SMA 10 upwards on January 10th, 2020. The nearest support area is at 1.2955, so we place our SLs below this level. We open the trades at 1.3055.
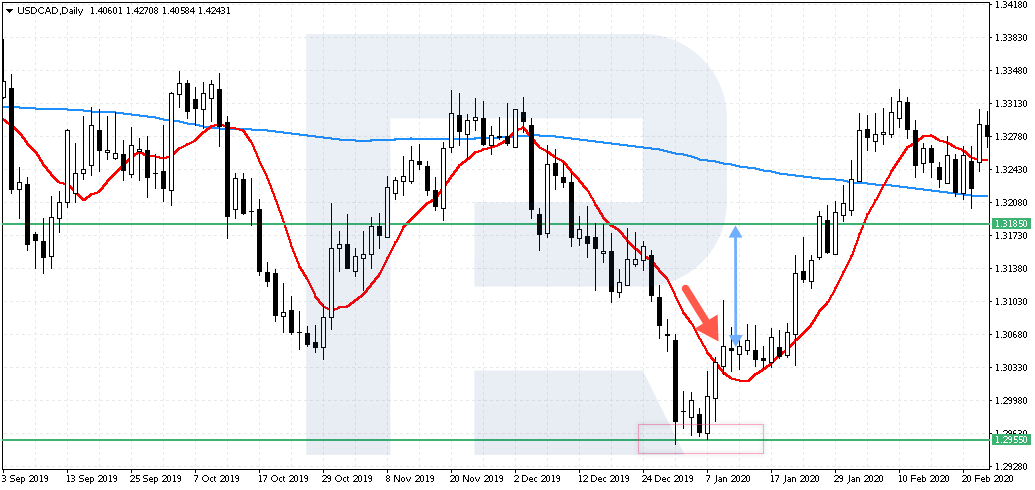
The TP for the first position is placed at 1.3155, for the second one – at 1.3185, which is the nearest resistance area. Or we wait for the prices to fall below the SMA 10 and close our second buying trade.
Closing thoughts
Unlike scalping strategies, the systems of trading on daily charts do not require watching the chart constantly and catching every signal of the system. Here, the trader may evaluate the perspectives of the currency pair calmly and find places for the SL and TP in advance. Moreover, there will be much fewer signals, while the profit may reach several hundred points.
On the whole, Ruler is a simple strategy with clear rules; its only difficulty for a beginner might be defining the horizontal levels on the chart, however, a short practice will help you learn to do it.