The MFI Indicator: Peculiarities and Trading Strategies
6 minutes for reading
Today, we will get acquainted with the MFI (Market Facilitation Index). It was developed by an experienced trader Bill Williams and described in his book “The Trading Chaos”.
The author aimed at research and quality analysis of the ratio between trade volumes and the price of the asset. He assumed that the trade volume or turnover initiated growth. The larger the volume of the asset, the brighter the price growth.
The indicator in question uses the tick volume for calculations.
Placement and appearance
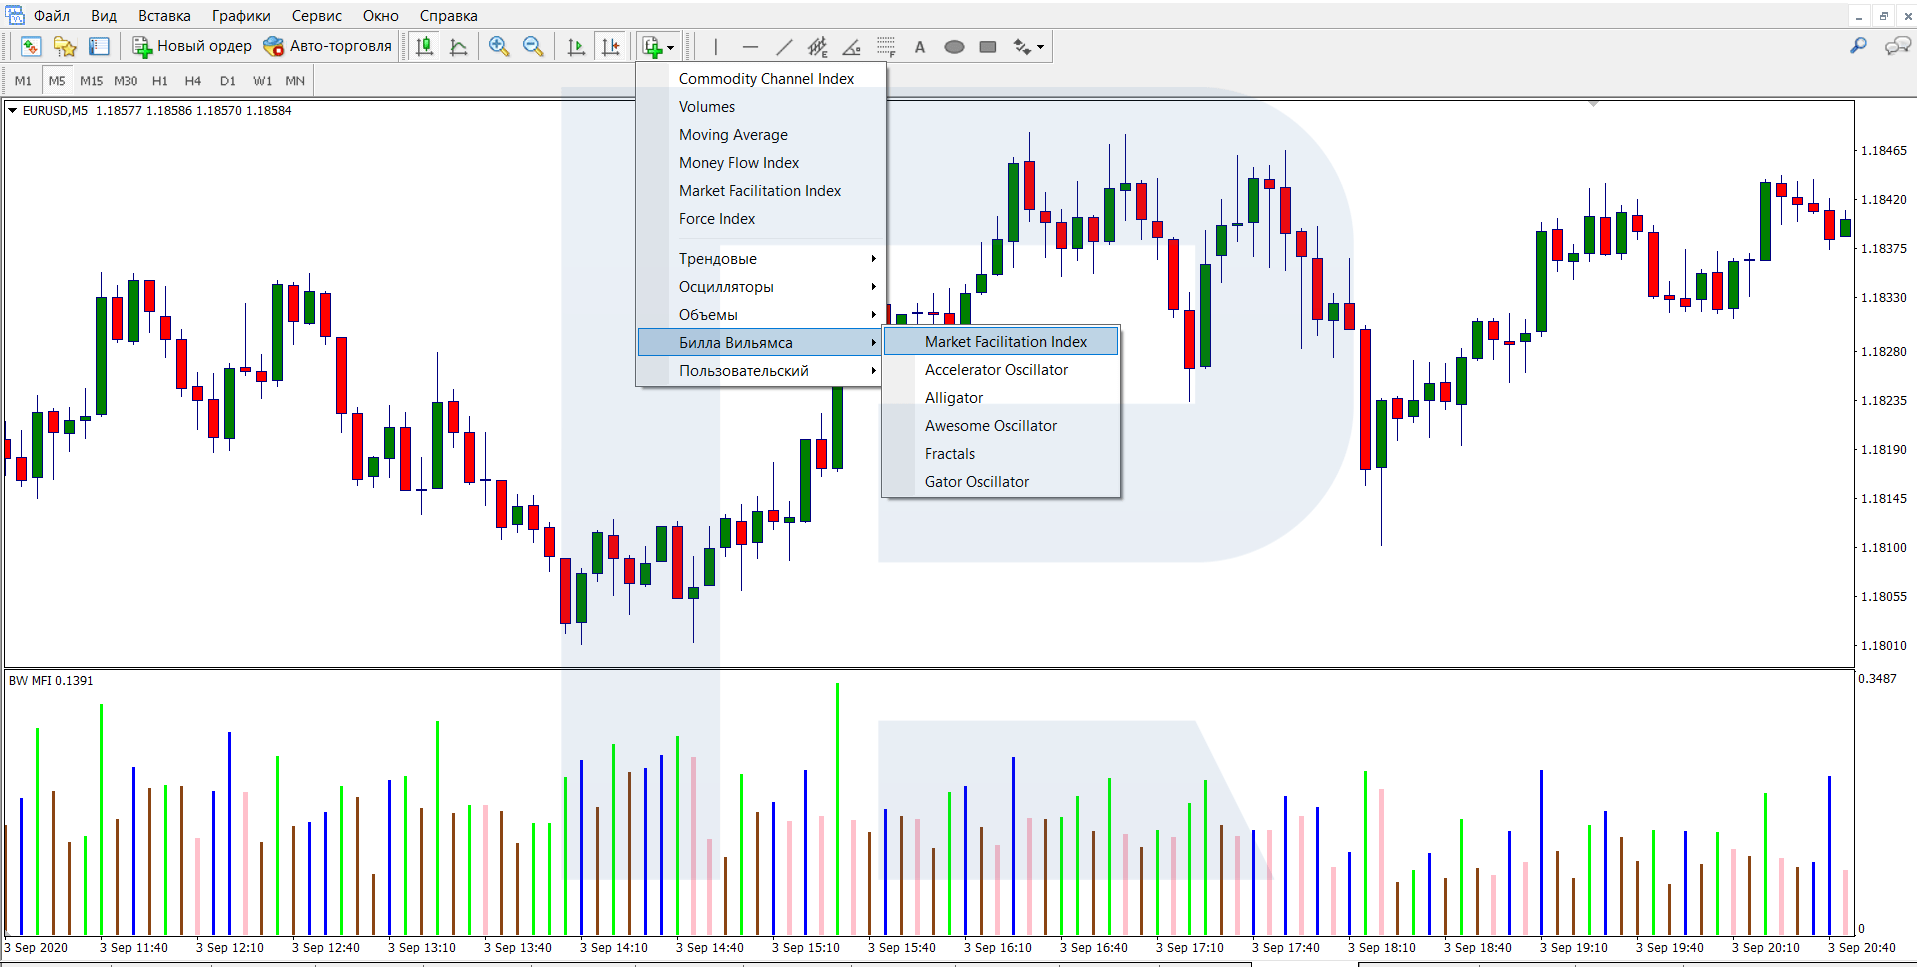
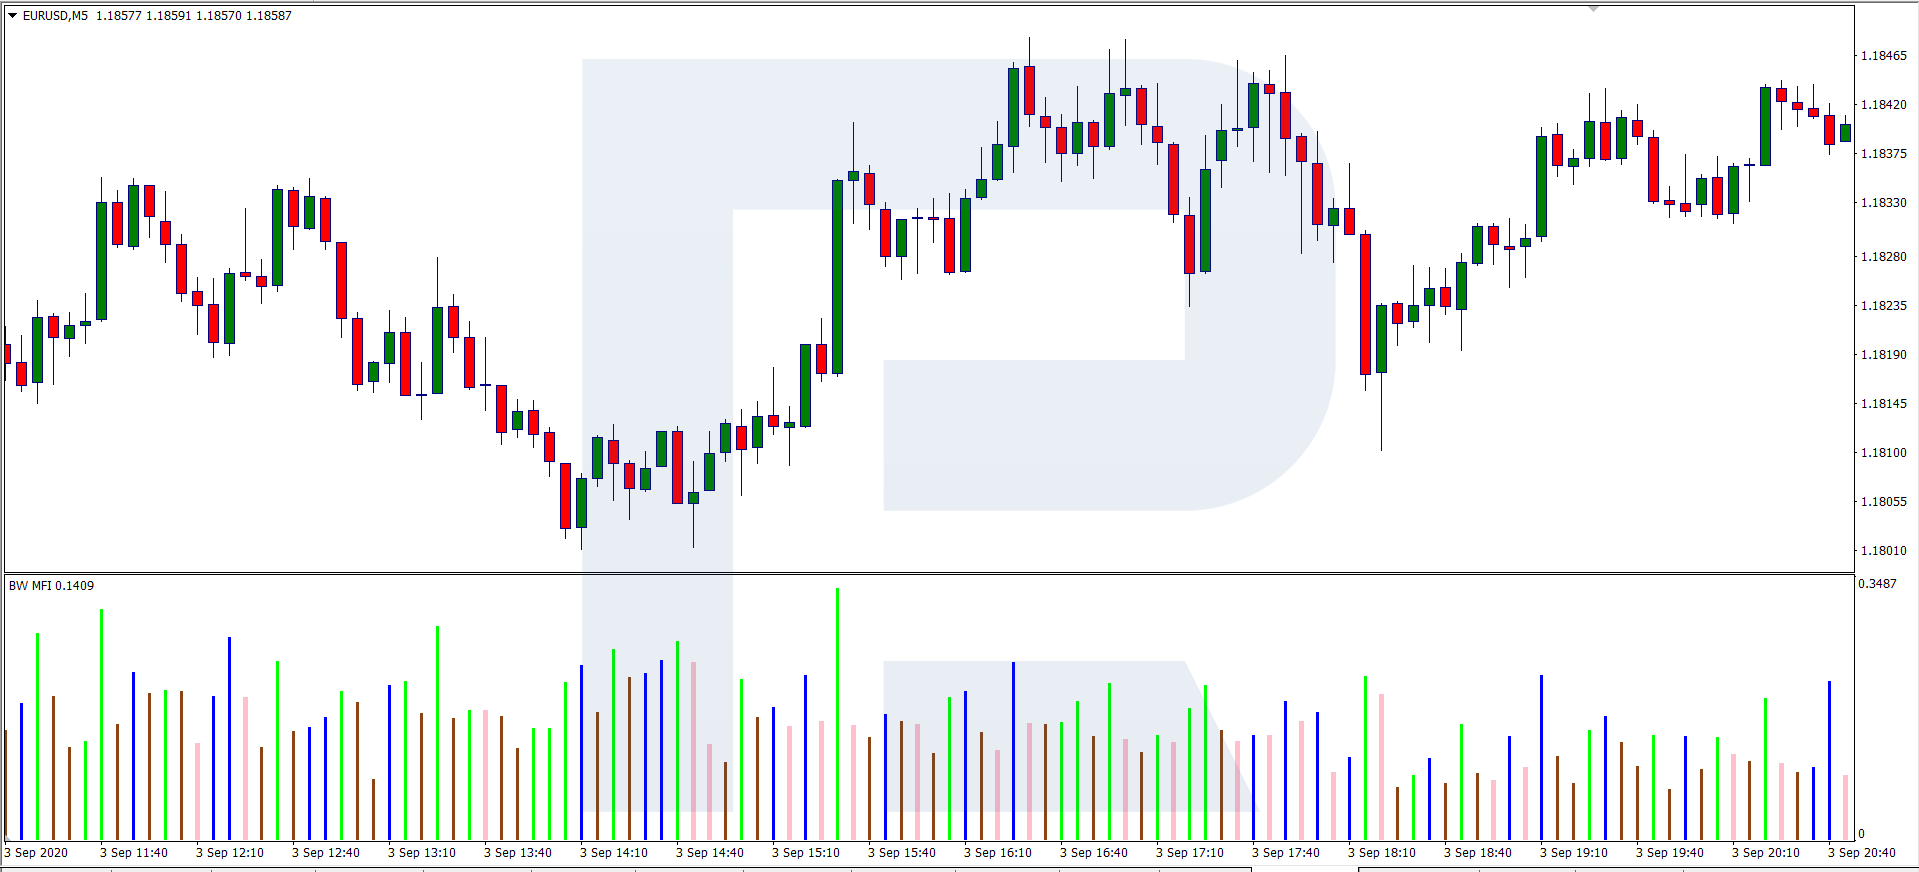
In MT4, you can find the MFI in Indicators – Bill Williams. The indicator is displayed in a separate window under the price chart and looks like a histogram made of bars of four different colors. The color and width of the bars are customizable. By default, the colors are as follows:
- MFI upwards, volume up – Lime
- MFI downwards, volume down – SaddleBrown
- MFI upwards, volume down – Blue
- MFI downwards, volume up – Pink
Usually, it is up to the trader whether to place highs and lows – normally, they are not used in trading by the MFI. The indicator has no other settings.
The formula of the MFI
The calculation formula looks as follows:
MFI = (High – Low) / Volume
The High and Low are taken for the current bar.
Volume is the tick volume of trade (the number of ticks in the calculation period). Unlike normal trade volume, there might be many more ticks in the bar, which makes the result differ from the real volumes.
What does the MFI show?
The indicator provides the following information:
- The green bar means that the number of market operations increases and the trend is getting stronger. The current impulse may continue because new players come to the market and make a lot of operations. This signal is not meant for opening positions because the impulse emerged much earlier, and the price has already covered a long distance. But if the trader already has an open position, the growth of the green bar will mean they were right.
- The brown bar means that volatility and liquidity are falling because market players are losing interest. Usually, such a bar precedes a flat, and the probability of a reversal is almost null. After the flat, the price may proceed in either direction with equal probability.
- The blue bar indicates that the impulse is currently developing not because some new players have entered the market but because either buyers or sellers are leaving it. They have lost interest in the asset, and the situation is dubious.
- The Pink bar shows that both bulls and bears are active. This bar promises a reversal and is most preferable for traders.
Though the MFI gives certain information to the trader, the author advises against trading by this indicator only. It should be used alongside other indicators or some trading strategy.
Trading strategies with the MFI
The Moving Average + MFI
This strategy is rather simple and requires no special knowledge. It is based on two indicators: the MA and the MFI.
Place an MA to the chart:
- The calculation method is Simple.
- The period is SMA25.
- Apply to (Close).
- Shift = 0.
The color and width of the lines are irrelevant. Then add the MFI and set the width and color if necessary (but better leave them by default).
A selling trade
Enter the trade when the price crosses the MA. Choose your timeframe based on the time you have and your money management rules.
At the top of an uptrend (with the price renewing the highs) wait for the quotations to cross the SMA25 top-down; it will be perfect if there is a clear support or resistance level nearby – we will use it later.
Then the price crosses the MA top-down, the candlestick closes, and a pink bar forms on the MFI. Place a pending Sell Stop at the support level below the closed candlestick and the Stop Loss – to the nearest high.
Close your position with a profit when the price crosses the MA from below. Alternatively, place a Take Profit 2-3- times larger than the SL.

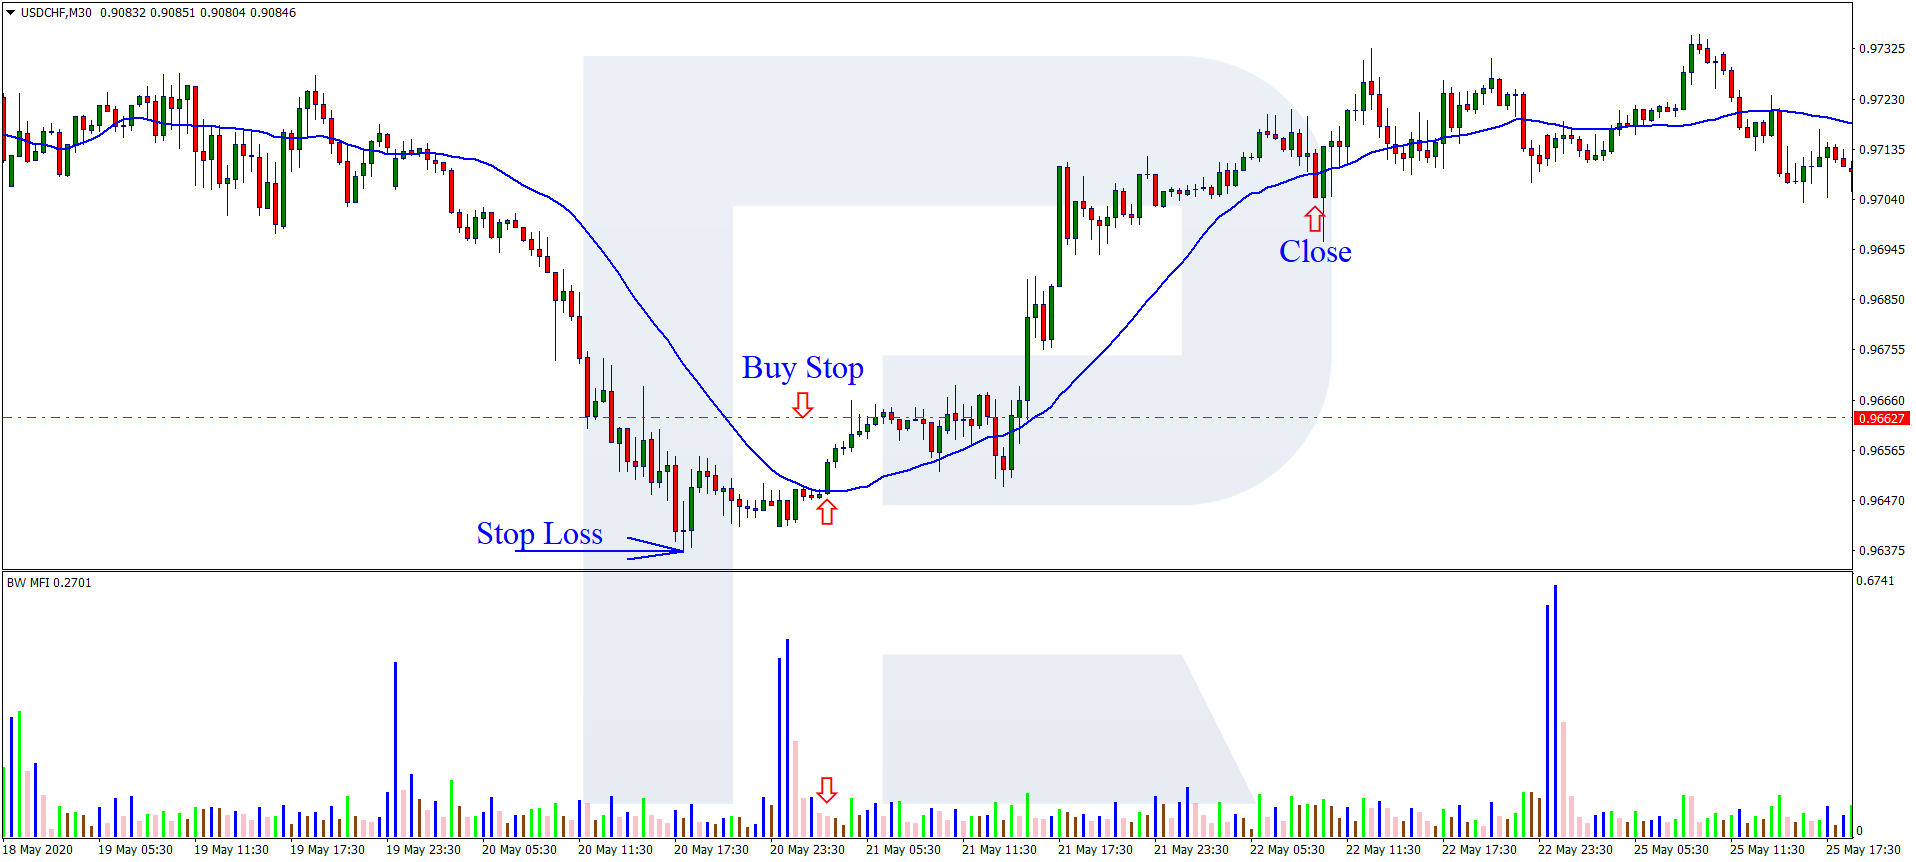
A buying trade
As with selling, choose a timeframe for comfortable trading based on your money management rules. At the bottom of a downtrend, when the price renews the lows, wait for the candlestick to cross the MA from below. Moreover, we would like to see a support or resistance level nearby.
Then the price crosses the MA and closes above it, while the MFI forms a pink bar. Place a pending Buy Stop at the resistance level above the closed candlestick and a Stop Loss – at the nearest low. Close the trade with a profit when the price crosses the MA top-down or place a TP 2-3 times larger than the SL.
No doubt this strategy has its strong and weak sides. To trade successfully, choose your instrument and timeframe well. The settings of the SMA25 are customizable.
A scalping strategy with the MFI and Volumes
Let us have a look at another strategy that we may conditionally call scalping.
The timeframe is M5; choose your currency pair from the majors with a small spread. Keep in mind that a scalping strategy requires from the trader fast decisions, good reaction, and cold calculation. The SL and TP must be placed momentarily, or avoid them altogether, closing your positions manually and without compunction. Otherwise, a scalper that was too greedy to close a trade with a small loss might turn into a long-term investor, trying to survive drawdowns.
A buying trade
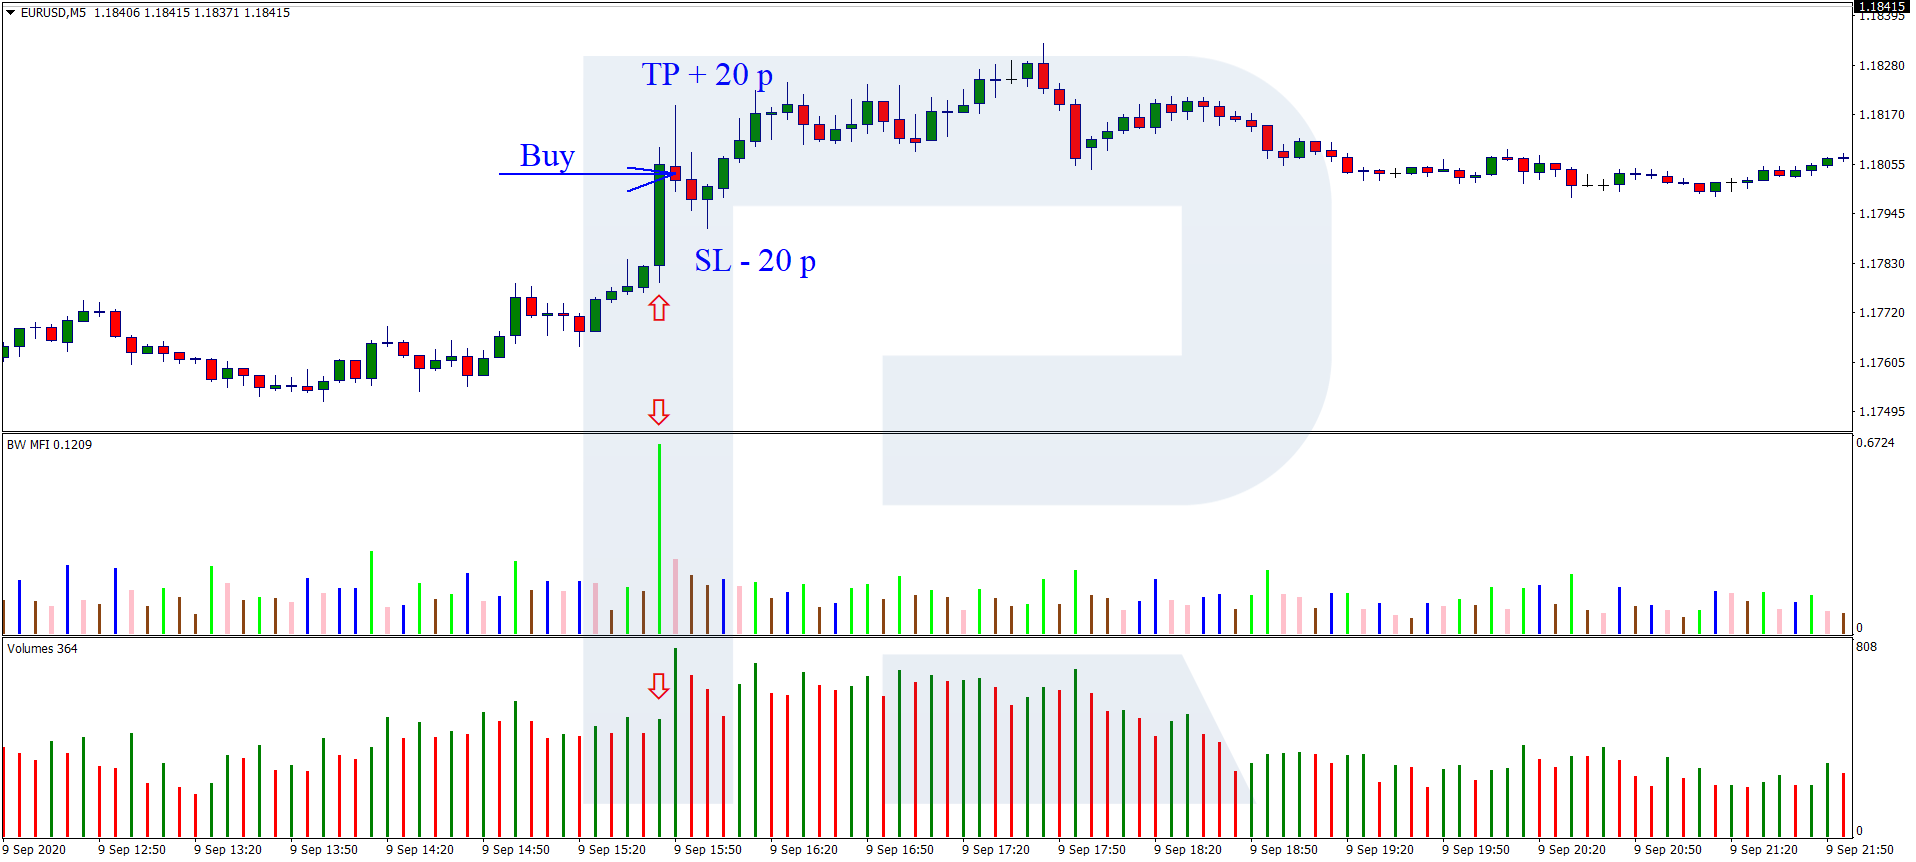
To the chart with the Mfi, add the Volumes indicator with basic settings. Wait for the market price to leap, i.e. create a large ascending candlestick. On the MFI, there will be a green bar, as well as on the Volumes indicator.
Wait for the candlestick to close and open a buying position at the opening of the next bar. Place an SL 20 points below and a TP – 20 points above the open positions. You may do without protective orders but close the position as soon as the price reaches some previously set level.
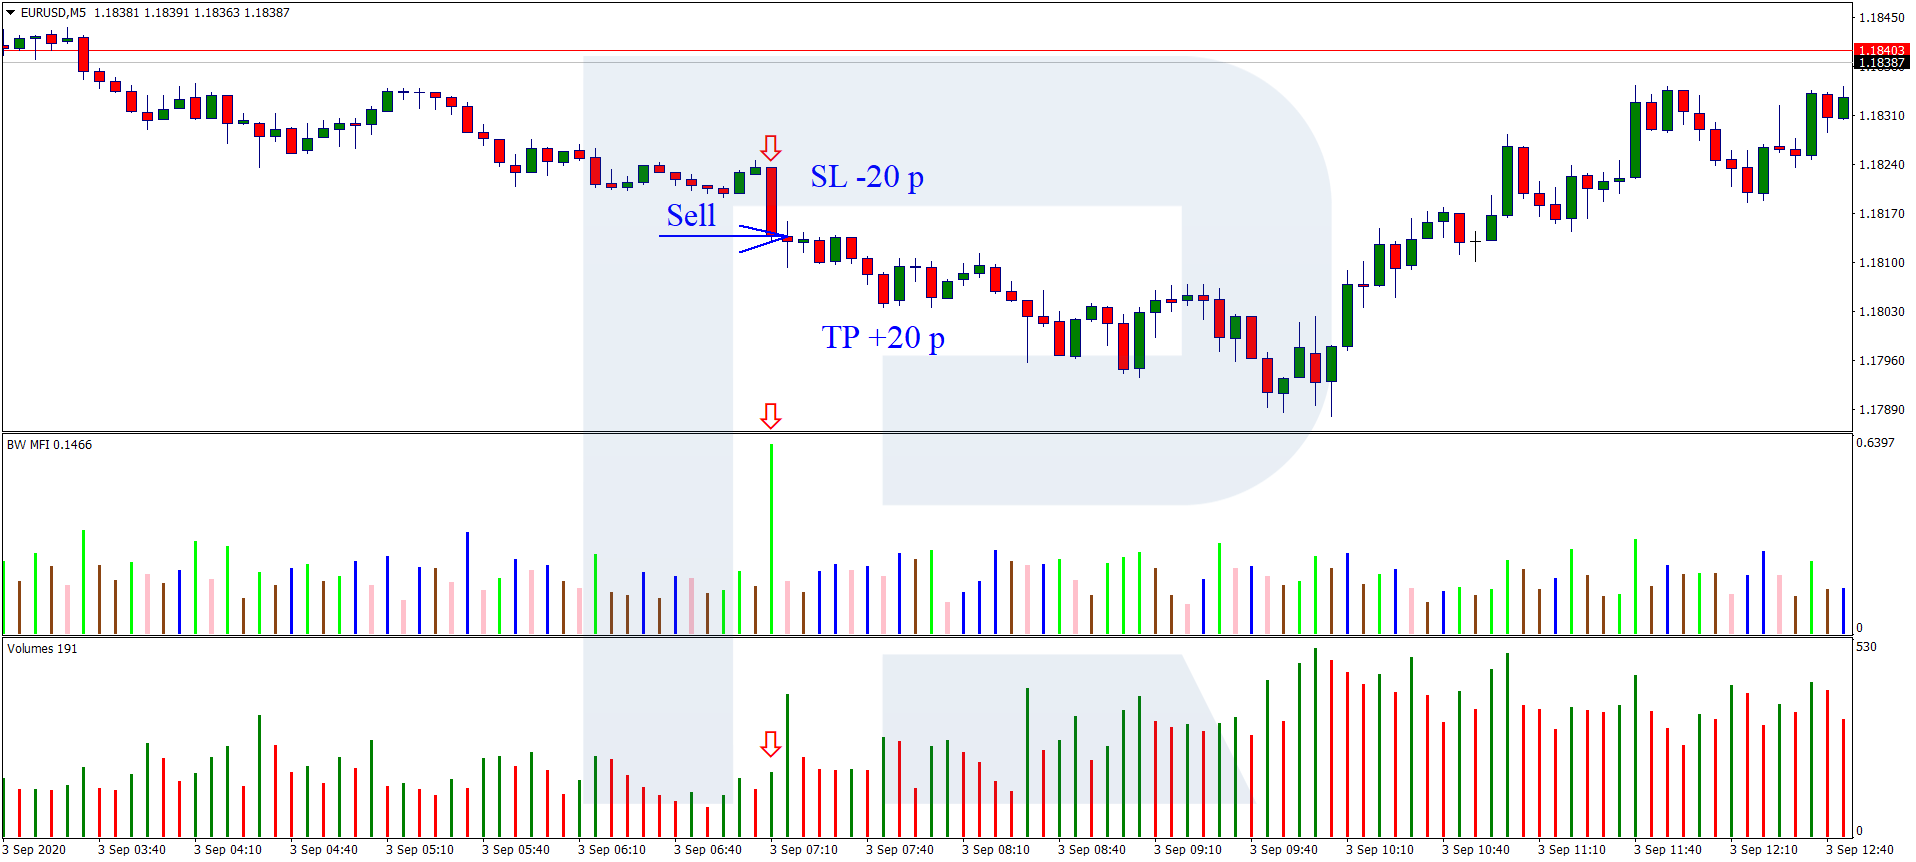
A selling trade
Wait for the quotations to fall abruptly; the two indicators will form green bars. After the control bar closes, open a selling position. Place an SL and a TP at -20 and +20 points, respectively. Or place no such orders, monitor the position, and close it manually.
Peculiarities of the strategies with the MFI
- Monitoring an open position, you may abstain from placing a TP and transfer the SL to the positive area: above the opening price when buying and below it - when selling.
- The signals of the indicators must be clear and bright.
Summary
Though the MFI describes certain market states, it must be used alongside others. Before starting to use it, practice on a demo account and assess the statistics of profitable trades.


