Trading Strategies That Were a Revolution: Trading Chaos-1 by Bill Williams

22 minutes for reading
Welcome to our blog! This post starts the series of publications devoted to the theories, strategies, and methods that once changed the evolution of trading on financial markets.
If we do not change the direction, we will likely return to the place we started from.
Chinese saying
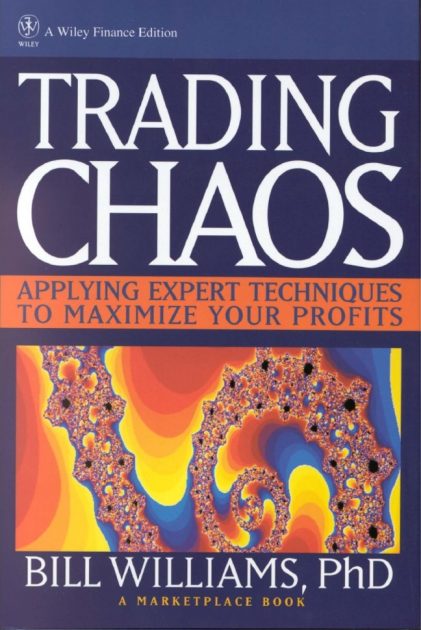
These words went as a preface to the book by Bill Williams "Trading Chaos: Maximize Profits with Proven Technical Techniques" published in 1995. For many traders, the publication of this book was the moment of changing the old paradigm of trading, understanding, and interpreting the market, understanding the trader's place on the market and right behavior in trading.
The book was a present to those who decided to become the cream of the trading world regardless of their previous failures and successes.
The author Bill Williams explained his Theory of Chaos — a new look on the market. A look not on a random wandering of prices and opinions but on a highly organized order.
Sometime later, the system got the name Profitunity System. The approach will allow to get rid of the psychological pressure on the trader, of the strain, the dying of neural cells, and deplenishing of the account. Understanding the market, the trader can control their emotions and actions and the situation on their trading account.
Who is Bill Williams?

In different sources, you can find that Bill Williams was born in either 1928 or 1932 in an ordinary American family. At school, he was a quiet and calm kid though he used to put out theories and try to prove them. After school, the parents wanted him to learn at the Church college and later become a priest, but the lad chose the university, where he met his friend and fellow trader called Rodgers. He got the young man acquainted with trading and the exchange. As early as the first year of the university, Rodgers worked at one of the New York exchanges, earning a substantial profit. Every day, his friends discussed the situation on the world financial market, and Bill became more fascinated by the idea to become a successful professional trader.
After graduation, Bill and his girlfriend get married and leave for another town. He keeps working at the exchange, bringing his skills to perfection. But neither business literature nor other trading skills helped him reach the desired level of income. Soon, he started investing more than earned on selling stocks, and the financial situation in the family worsened. At a certain point, he wanted to quit trading, but his wife insisted on his taking the business in his hands and thinking by his own brain.
Step by step, Williams starts creating his own method of analysis and trading, based on his own experience, knowledge, mathematical calculations, and intuition. His career starts developing steeply. Williams writes a Ph.D. on stock markets. In 1995, he decides to publish the book "Trading Chaos". In the book, he talks about his own theory, according to which the market is a highly organized chaos, and to make a profit you do not only have to account for various types of analysis but also understand the very structure of the market. The strategy by Bill Williams became a bestseller and an informational bomb that brought Williams lots of fans all over the world.
Later, the world saw "Trading Chaos 2". After the great success of his books, he becomes an official consultant of various American banks and hedge funds. Also, he founded the Profitunity Trading Group that is still teaching and consulting beginner traders.


“Trading Chaos”. First edition
In the first book, from the very beginning, Williams makes the brain of beginner and experienced traders clash with the market reality. Moreover, according to him, the reality is that most traders treated the market as a problem. In other words, the attention was paid to the wrong interpretation of the relationship between the market and a trader. The very essence of the problems was in the trader's psychology.
Even when progressive technology entered the market, the appearance of computers, indicators, and the Market Profile the problem was not gone, it just changed the shape and move to additional instruments.
Most often, trading was interpreted as a pseudo-intellectual science, or a pseudo-scientific intellectual game, in which the profit was directly connected to the intellect of the trader. However, in reality, trading is anything but an intellectual effort. Knowledge is not the only way to successful trading. What also plays an important part is the health conditions, especially the stomach or heart. Intuitive and harmonized coincidence of the trader's interests and the market interest will bring more profit than pseudo-scientific and high-brow theories. The book headed the trader for common sense and the right view on trading.
Trading should be not a difficult but a profitable thing.
Bill Williams
He told to get free from the nets of eloquence, and behind them you will find some all-time truths that will make your trading rather easy. The problem with the truths is that they are neither sentimental nor romantic. The truth is reality, pragmatism, and wit. Williams told the traders to learn to be independent in trading.
The structure of the book you should study
The first part of the book describes the reasons for 90% of the traders to fail.
The second chapter describes the simplicity of the structure of the market and its functions. Each market in the world is meant for rationing or distributing a limited amount of a certain good between those who desire it. Every second, on the market there is set the fair price and an absolute balance between buyers and sellers. The market is the first one to feel the breach in the balance, and we are to catch the moment and move along with the market.
In the third chapter, there is a detailed description of the logic of the chaos theory as a model of the highest market organization. It is explained why it is wrong to use the logic of linear statistics in the non-linear market environment.
The fourth chapter describes the key to the right behavior on the market, as well as its main and invisible structure that explains the trader's behavior. Here, we get to know that, as a river does, the market move along the way of the least resistance, and the way, in its turn, is defined by the shape of the river bed. And also, one of the main trader's mistakes was spoken about: this is attempting to change the market, not the direction of the position.

Five levels of trader’s evolution

Starting from the fifth chapter, Williams suggests evolution maps for the development of any trader from a beginner to an expert and a list of instruments for using at each level of preparation. Here, the requirements to the beginner trader are enumerated. Their aim and skills are focused on trying not to lose money, gaining experience. The instruments of a beginner trader are: daily price levels, the volume, MFI, Profitunity windows, and the Air Bag.
Then, Williams specifies the requirements for an advanced beginner. The aim of a such trader is to make a regular profit on one contract. The instruments are: Elliott waves, fractals.
At the third level, the trader becomes competent. At this step, they must maximize the profit from each investment. The instruments here are: the Profitunity Trading Partner and Profitunity Trade Planning. At the third level, you gain the ability to make an instant and exact evaluation of each market.
The fourth level, compared to the previous ones, can be called a quantum leap. At this level, the trader becomes skillful. The aim is to trade not a good or the price but their own set of beliefs. The instruments are: the left side of the brain, heart, right side of the brain (brain telegraph).
On the fifth level, a person gets to the realm of chaos, becoming an expert. The aim is to trade the state of mind. The instruments are your own states of mind (biological software). At this level we realize that our main task is to find out who we are. At this level, trading becomes a stressless game in the best sense of the word. What we could call a coincidence the first three levels is, in fact, the result of our insufficient understanding of the essence of things. The trader feels like they float along the river, making their all wishes come true.
Level one: Beginner trader
According to Bill Williams, the aim of the trader at this step must be studying and reading the market and not collecting ideas of other traders. Of course, the aim "not to lose money gaining experience" is in priority.
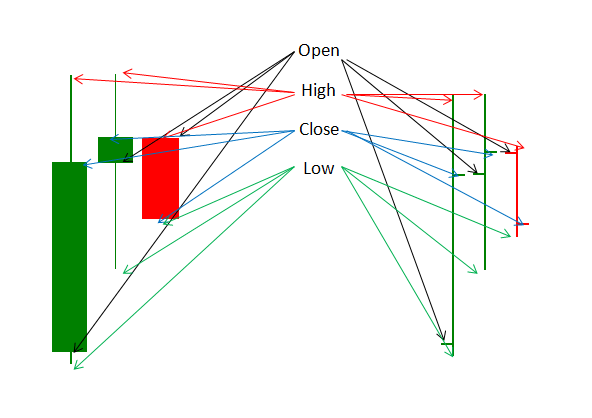
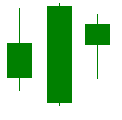
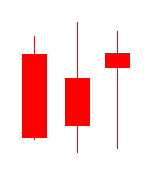
The first element in studying the market is the bar or the candlestick on the diagram of the price movements. OHLC, or open, high, low, and close levels, the volume and time are the information that can tell much more about the market situation than many people think.
- The open price shows where the balance point between the buyers and sellers was at the beginning of trades.
- The high price points at the highest point to which the bulls have lifted the price.
- The low is the lowest price where the bears lost their power and the bulls started taking their place.
- The close price shows where the two sides finally found their balance point.
And the most important things we find out comparing open and close, high and low, close, high, and low.
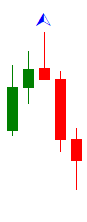
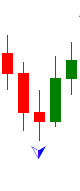
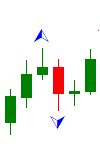
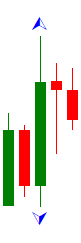
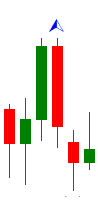
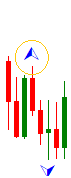
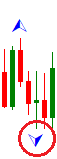
Candlestick informers of moods
Reversal approaching
Sellers attack

Buyers attack. In 80% of cases, the trend changes its direction after 1-5 candlesticks.

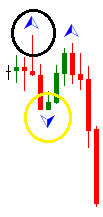
Neutral
The buyers and sellers were equally strong.
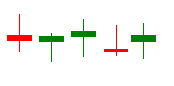
Dominating
Alpinist. Buyers dominate
Vagabonds. Sellers dominate
Tick volume
One of the approaches to understanding the development of the next trends is the understanding and interpreting the changes of tick volumes. Tick volume is the number of price changes in a certain time.
An increase in the volume leads to an increase in the speed of price changes, which precedes trend reversal. Primary changes take place in the heads, the thoughts of the trader while deciding to place orders to buy/sell, placing the orders, processing them by the broker, and their execution. All this is reflected in the changes in the short-term market movements and later leads to a change in the trend. The aim of the trader is to enter the market on the first 10% of the new trend and exit it on the last 10%.


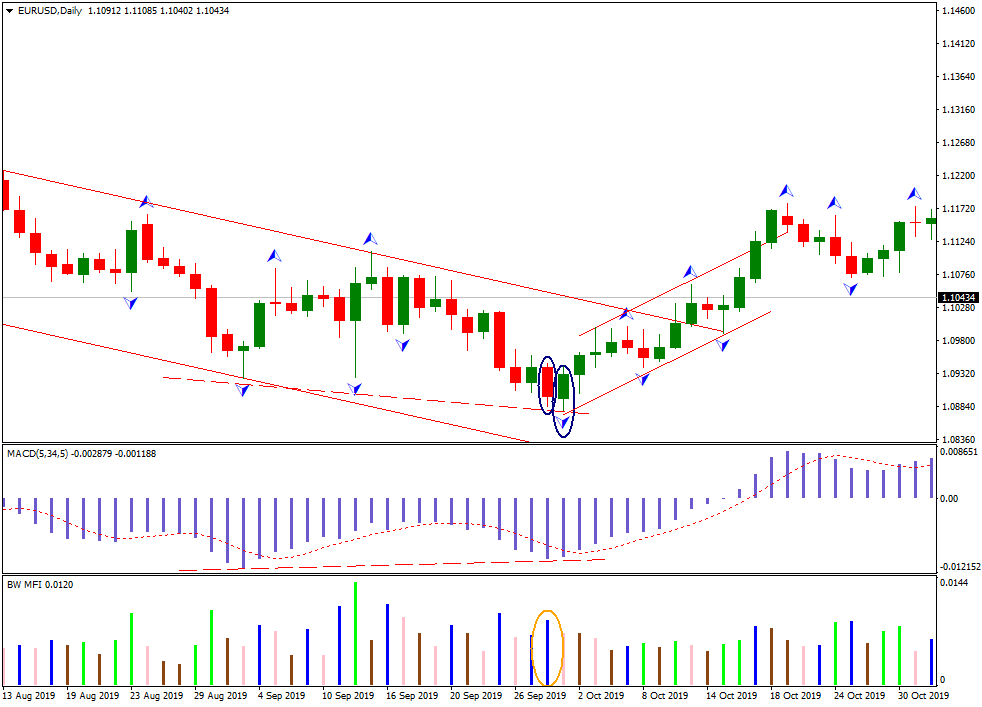
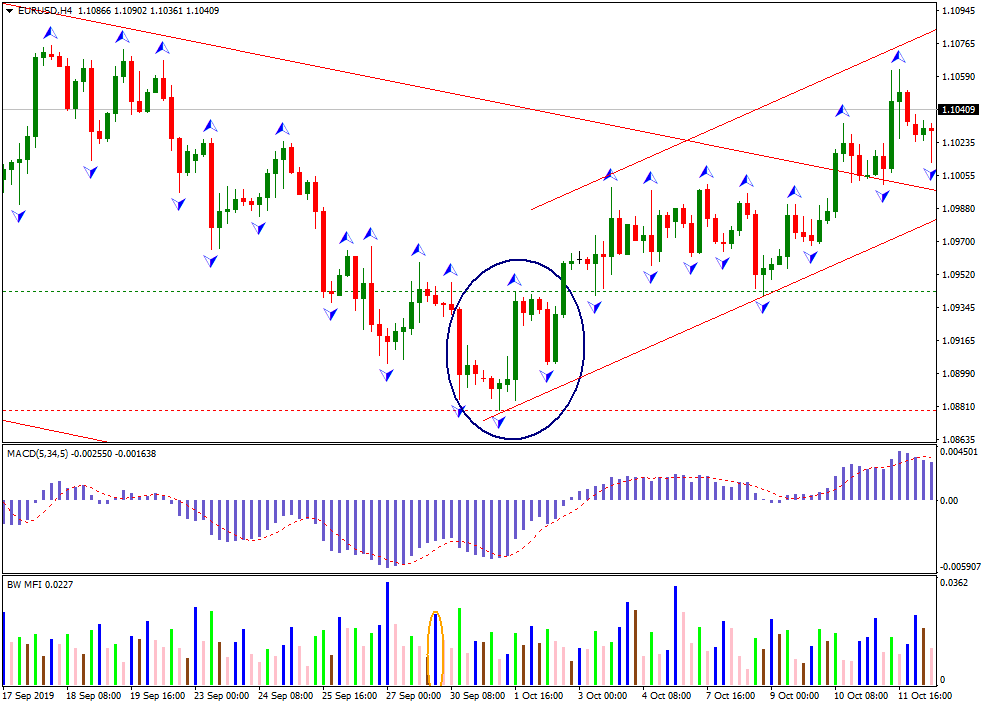
The MFI indicator
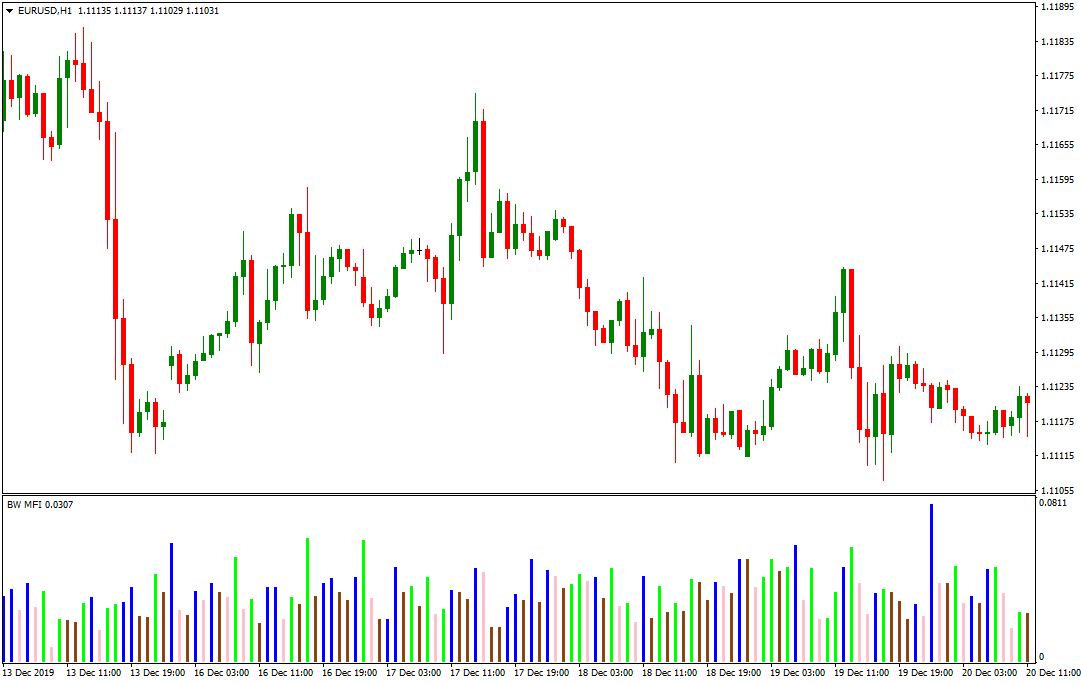
To make easier precise assessment of the effect and future reaction of the market to the changes in the volume, Williams suggested using the MFI (Market Facilitating Indicator).
The MFI is very simple. Setting the time range for watching, we deduct the smallest price from the largest, then divide the result by the volume. As a formula, it looks like:
MFI = Range (High-Low)/Volume
The MFI shows by how many points has the market moved in 1 tick. If the MFI of the current bar is larger than that of the previous bar, this means there is a strong price movement in one tick.
The MFI and volume combination
A change in the volume tells us that the trader should be ready to work before the trend begins, and the MFI indicates how the market reacts at the change in the volume.
Comparing the volume and MFI in four combinations we increase the potential for entering a profitable trade!
Four Profitunity windows
Tick volume/MFI - Class of the signal
- + Tick volume/ + MFI - Green (+ +)
- - Tick volume/ - MFI - Fade (- -)
- - Tick volume/ + MFI - False (- +)
- + Tick volume/ - MFI - Squat (+ -)
Green (+ Tick volume / + MFI). This bar is called Green because it switches on the green light for a new impulse in the trend.
Fade (- Tick volume / - MFI). A Fade bar appears when the market is tired and on a pause. The fading areas are landmarks of a new strong impulse movement.
False (- Tick volume / + MFI). False indicates a pause before a correction.
Squat (+ Tick volume / - MFI). The Squat bar has the highest potential of all for making a profit. This is the highest/lowest bar plus (or minus) one more bar of the same timeframe that ends almost all movements.
Airbag
No driver on the road is insured from an accident. While you can insure yourself by following the rules, manoeuvring, keeping the rules of active and passive safety, and repairing the car in time, it is very difficult to avoid the negative influence of unscrupulous perticipants of traffic. With the market, it is very similar as sometimes the market behaves as a drunk reckless driver, that is why the trader always needs an airbag.
Protecting their positions devotedly, the trader can withstand a row of small losses and remain on the market. According to the Trading Chaos strategy, an airbag, or a protective Stop Loss should be placed one point above/below than the highest/lowest value of the candlestick, previous to the current one.
Level two: Advanced Trader
According to the Theory of Chaos, at this level the trader should:
- See the connection between the MFI and the calculation of Elliott waves
- Use the Profitunity in calculating Elliott waves
- Learn to detect fractals and enter the market on them
- Understand how to use the lever to start trading or cancel market entry
The main objective of the trader at this point is "to take money from the market regularly".
Elliott waves
An Elliott wave is a model of the main market structure while a fractal is the main element of an Elliott wave.
The major set of an Elliott wave cycle consists of an impulse "five" and correcting "three". The waves may be both extended and squeezed both price- and timewise, but the main structures remain constant.
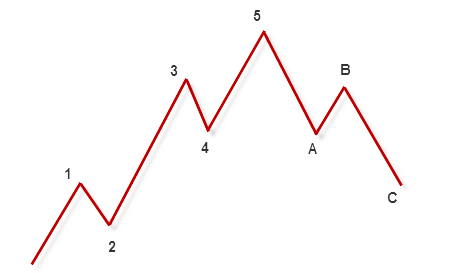
Characteristics of the waves
The formation of the first wave will be preceded by a divergence on the MFI oscillator. Then, we should expect a sharp movement from the base (top).
Five magic bullets killing the trend
To identify the end of the current trend and the beginning of a new one, you should see:
- a divergence
- the target area
- fractals
- a Squat
- changes in the Momentum indicator.
As soon as the first wave ends, a movement in the opposite direction is to be expected. This will be the second wave. The aims of the wave № 2 can be defined on the Fibo scale or by inner wave calculation. Most often, the goals of the second wave are between 38.2% and 61.8% compared to the range of the movement of the first wave.
One of the main characteristics of the wave № 3 is its dynamics. Third waves very often look almost vertical. The wave № 3 is followed by large volume. The best wave to calculate the end of the third wave is to switch to a smaller timeframe and find the five magic bullets.
The mighty wave № 3 is replaced by the correctional wave № 4, which is explained by locking in profit. The correction in the fourth wave can be calculated same as in the wave № 2 but in comparison to the third wave.
The wave № 5 is normally 61.8% of the length of the wave № 3.
Corrections
Corrections can be simple and complicated. In the three-wave correction "a-b-c", the wave "b" contains three waves, while the wave "c" contains five. The wave "a" can contain either three and five waves.
Combining the MFI with Elliott waves
The averaged MFI value is the highest for the waves № 3. In the waves № 1 and № 5, the average MFI value was lower. It was clear that there was a divergence between the price at the end of the wave № 3 and the average MFI or the wave № 5. Though the price at the end of the wave № 5 was higher than at the end of the wave № 3, the average MFI in the wave № 5 was smaller, forming a divergence. This divergence identifies the end of the impulse series and forecasts a trend reversal.
Profitunity-MACD (5/34/5)
The main goals and tasks when using the Profitunity-MACD (5/34/5) are:
- Identify the peak of the wave № 3
- Identify the end of the wave № 4
- Studying the point of the end of the trend and the peak of the wave № 5
- Immediate informing about the direction of the current moving force (momentum), or on which side of the trend the trader should work
Fractal as a signal for action
A fractal model is a sequence of at least five candlesticks where the middle candlestick must have the highest/lowest high/low than the two preceding and subsequent candlesticks.
A fractal up, to buy
A fractal down, to sell
Adjacent fractals, to buy and to sell
A double fractal on one candlestick, to buy and to sell
A fractal of 6 candlesticks, to buy
In an upfractal, the trader must pay attention to the highest value of the candlestick only, in a downfractal - to the lowest value.
A fractal can play several roles. It can be a fractal start, fractal signal, and fractal stop. The role of a fractal depends on where it is situated in the sequence of the market movements.
Definitions
A fractal start is a fractal followed by a fractal in the opposite direction.
A signal fractal is any fractal that follows after a fractal in the opposite direction.
A fractal stop is the most outlying fractal peak out of the two last fractals headed in the opposite direction.
The lever
As soon as we see a fractal start or signal, we get a lever.
How to work with a fractal and lever
Finding a formation of two adjacent fractals heading in the opposite direction, we can see a fractal start and a fractal signal. If the latter is broken out, we move in the direction o the breakout. A fractal stop is on the one but last fractal in the opposite direction.
If the market does not break out the signal fractal but heads away from it, creating a new level for a more profitable trade, the trader should plave a pending order 1 point higher/lower than the extremum of the signal fractal candlestick.
Level 3: Competent trader
The aim is to learn how to read the market without a mistake, to know and understand the things that will allow to maximize the profit from investments.
At this level, the trader can manage several positions simultaneously, changing trade volumes. A trader on the third level knows invest the maximum with a minimal risk and invest the minimum when the risk in high. The trader is competent but yet unable to express their personality on the market.
An example of the five magic bullets of a competent trader
- A convergence/divergence between the waves № 3 and № 5
- The price is inside the target area
- The fractal is at the lowest point
- A Squat bar is on one of the three lowest candlesticks
- The market trend changes its movement
If we see such a picture on the daily chart of a currency pair, we switch to H4 to start trading and look for a fractal start model.
In this situation, 1 point above the specified fractal maximum to buy, a Buy Stop order should be placed, and 1 point lower the minimum of the fractal stop, a protective Stop Loss should be placed. For the primary order, the volume can be 1-2% of the capital. After a breakout happens and the first order triggers, the trader should monitor next fractals to buy forming. The size of the following orders can be increased several times. Simultaneously, the protective order is to be optimized, moving it along the renewed fractal stops.
With such a method of work, the first entry to the trade is a trial, checking whether the trend was identified the right way. Each next entry with increased volume will let you maximize the profit if the trend develops, while moving the Stop Loss you can minimize the losses after a reversal of the trend.
Level 4: Skillful trader
The aim is to study the connection between the characteristic features of experienced traders and the market nature.
The principles of "person-market" communication that lead to losses if interpreted incorrectly:
- 90% of what you hear about the market is a lie
- The market cannot lie
- The market can speak only about itself
The structure of the organism influences trading. There are three body types, each having a unique characteristic. For endomorph, it is mass, for mesomorph - strength, for ectomorph - speed. An endomorph person is chiefly motivated by comfort and looks for easy ways to perform tasks, including in trading. Mesomorph people are quite opposite as they look for "uncomfotable" situations on purpose. They need challenges and struggle, and naturally they are leaders. Ectomorph people prefer feeling worthy. They want to perform tasks that will show others what ectomorphs are capable of.
A person of any type can trade successfully. It is just that if you should account for your body type and your natural apparatus, you will be able to create such trading conditions that will ease your work and eliminate many things that make you feel strained.
A person has not "one" brain but three "conscious elements": left parencephalon, central part of the brain, and right parencephalons. This hints on the idea that there are three personalities living inside a trader.
The aim of the left parencephalon is to analyze, to know what but never know how. The task of the left parencephalon is to analyze but not to facilitate choosing of trading positions or a good place for a trade.
The central part of the brain need much power as it rules our life processes. It is it that allows us seeing silly mistakes in trading but only after we made them.
The right parencephalon is unique not just because it is powerful but also because it can absorb unlimited volume of knowledge. This is the best brain part for a trader.
Traders dominated by the left parencephalon lose more frequently because they are in a constant fear and are always in the wrong place. Those trading with their central brain parts lose because they are reckless. Those trading with their right parencephalon lose because of poor fund management.
Keeping the above mentioned in mind, any beginner trader can analyze themselves and, if needed, correct their old habits, acquiring new, more "successful" ones.
Level 5: Expert trader
The aim is to understand the set of your personal superstitions and your individual trading programs; to facilitate connection with the market; to study the way of integration in the main market structure.
At this level, a person starts to understand what just yesterday was completely unknown to them. They start believing in themselves undoubtfully, foresees all risks and a potential for winning in any case. To move to this level, the following is necessary:
- Life is a special game, in which a person makes something which does not exist more important than that which exists
- The main goal of this game is to understand who we really are
- The only right way to play this game from the position where you know yourself is to realize: all that was - was normal, and this is to be realized earlier than you turn what does not exist in what exists
Psychology and sets of beliefs
On the market, everybody trades in accordance with their sets of beliefs. It does not matter what a trader's set of beliefs is like. If they does not participate in trading, their opinion has no influence on the market.
Your own trading software
In your personal "file" for trading software, there are four programs:
- Self-preservation program
- Greed program
- Program for confidence in trading
- Program for taking pleasure
Though everybody uses them in everyday life and trading, in each case you can use only one, switching between them quickly.
Our individual set of beliefs defines the program with which we live and trade. And the program we use in each moment will define our market behavior.
Self-preservation program
If this program triggers, our main task becomes protection and the feeling of protection. This program has a positive and "right" goal but it is clearly unsuitable for trading. This is the program that makes the trader buy at the very high and sell at the low.
Greed program
When this program is triggered, we are interested in the price, not in the value. This is the bad side. The bright side of this software is the fact that it is the best for studying the market structure, analyzing, and preparing for trading.
Program of confidence in trading
This program triggers confidence and tranquility. This is a perfect software for trading but not as a perfect one for analysis.
Program of taking pleasure
When you launch this program, you are interested in three things:
- Personal attractions
- Plans for the future
- New adventures and emotions
This is the best program for trading. The program created all conditions for having un regardless of the circumstances. With this program, you can easily change your position on the market. A stop or a reversal are never a problem. In the fear program stops and reversals are almost impossible. While "fear" struggles with the market, "taking pleasure" moves along with the market smoothly and synchronously.
Summary
No matter how much detail I have tried to speak about the ideas, methods, and approaches of Bill Williams, nothing can be better than study the primary source. That is why I recommend you reading not only the first book but also the subsequent ones. However, you must remember that if you just read the book and never apply it to trading, you will just read a book. Follow all the steps of the trader's development, gain the tranquility of an expert and enjoy your trading.


