How to Trade by 5-0 Pattern?

14 minutes for reading
5-0 is a relatively fresh pattern of Harmonic Trading. It was described for the first time in Scott M. Carney's book "Harmonic Trading: Volume Two" published in 2007. However, Bryce Gilmore also put his hand on this: he described in detail a pattern of similar price structure in his book, calling it "An out of sequence 1:1". The difference between these two is that Scott M. Carney checked the correctness of the pattern by the Fibonacci grid while Bryce Gilmore used Fibo levels for checking the entry point only.
There is nothing surprising about two authors describing the same pattern in slightly different ways as long as the pattern itself is very similar to an erratic Head and Shoulders or Wolfe Waves. These structures work well in the market, traders like them, which means the 5-0 variety of these two will work equally well. Mind that while the first two structures are rather widespread, the Harmonic Trading pattern is relatively new, so not all traders know to detect it on the chart and, moreover, trade it. This article will, hopefully, explain you the forming principles of the pattern and teach you to detect and trade it.
How does 5-0 form?
The 5-0 pattern consists of 6 points: 0, X, A, C, and D. That is why, perhaps, the author gave it such a weird name, provided that normally patterns consist of five points on the chart.
Visually, the pattern looks like an inverted Head and Shoulders, and both can be called trend reversal patterns. If we compare this one to the Wolfe Waves pattern, they will seem alike at the moment when point 4 forms — there we can buy as well.
A bullish 5-0
From the name you can guess that the pattern gives a signal to buy. Inside the pattern, price both rises and falls noticeably. To certain points, you should add the Fibonacci grid to check whether the pattern goes in compliance with Harmonic Trading rules.
A bullish 5-0 pattern has the following scheme:
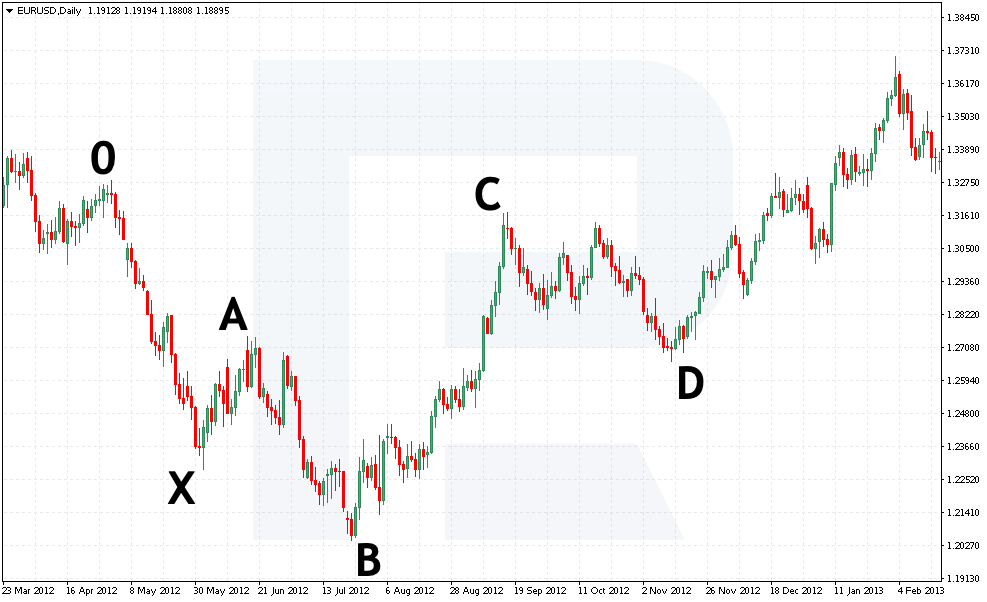
- The price sets off in point 0, where the whole structure of the pattern starts from.
- Upon testing point X, the quotations start growing but the growth does not test the high of point 0. The growth stops at point A.
- After a bounce off point A, the quotations again decline and break through their low. The level at which the declining impulse ends is marked point B.
- After the quotations start growing from point B, the bullish impulse takes the price above point A. This upward swing will be very powerful, ending in point C. Note that this pattern is very similar to the Shark pattern.
- After a bounce off point C, the price falls below point A; the move is expected to end at the level of 0.50 of correction by the Fibo grid. This level is marked point D.
Then you need to check the correctness of your 5-0 by dragging Fibo levels over it. Certain points must not get higher than certain levels. Take the following steps:
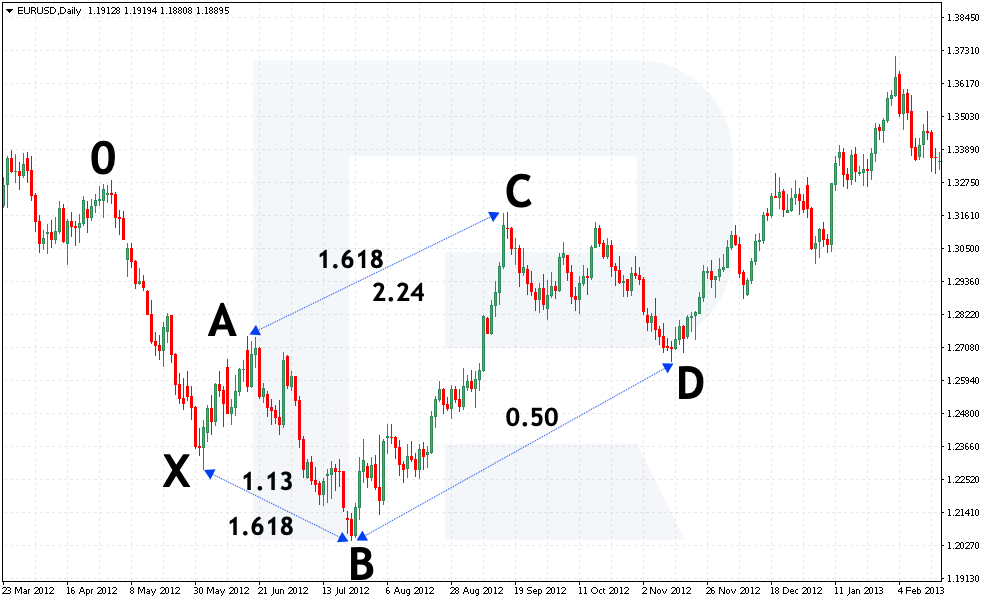
- Drag the Fibo grid from point X to point A. In a correct pattern, point B must get between 1.13-1.618 of the decline. The author allows some fluctuations here yet it is extremely important that point B is below point X.
- Then drag the grid from point A to point B. Point C must get between 1.618-2.224 and rise above point 0. If this does not happen, such a pattern is considered erratic, we leave it alone and start looking for another 5-0. If things are correct, go to the next step.
- Drag the grid again, from point B to point C this time. In a correct pattern, point D (the end of the pattern) is at 0.50 correction level of the decline. The author allows certain fluctuations in the position of point D, considering the whole pattern normal if point D us a bit higher/lower than needed. You can start trading.


Nuances of detecting the pattern
Here, the forming of the Harmonic pattern end, and traders wait for the price to react to the marked level. However, if we take a close look at "An out of sequence 1:1" pattern, which is almost identical to the 5-0 pattern, we will notice that the author marked the AB and CD lines as equal in terms of price and time and recommended buying only if this condition is fulfilled.
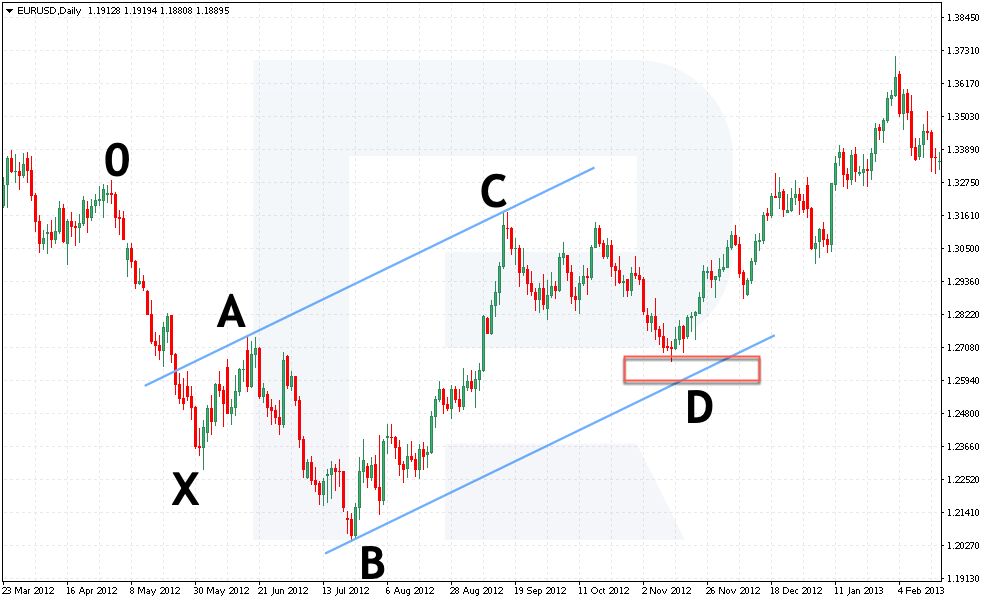
Based on my own experience, I would suggest that you should draw an ascending channel. Draw the first line through points A and C and apply it to point B. If the price test the border of this channel and pushes off it upwards while forming point D, this will be yet another signal that the pattern is correct.
The structure of a bearish 5-0
Clearly, the bearish pattern signals to sell. Basically, this is the same pattern as before only inverted, which means we will be looking for the same points and Fibo levels to confirm the correctness of the pattern, waiting for the price to fall.
A bearish 5-0 pattern looks as follows:

- The price starts growing in point 0 where the whole price structure starts to form.
- Upon testing point X, the price falls. This decline will be short and will end in point A, which must not be below point 0. If such a thing happens, the structure cannot be considered a bearish 5-0 pattern.
- Upon bouncing off point A, the quotations start growing and renew the high, rising above point X. The bullish impulse ends in point B.
- After a bounce off point B, the quotations drop, and this mighty decline will break through point A. Here is well we are likely to see a bullish Shark pattern forming.
- After the decline is over and the price bounce off point C, it rises over point A. This move is expected to end at 0.50 of correction by the Fibo grid. This is marked point D.
To make sure that the pattern is correct, we draw Fibonacci levels. Mind that here as well, points must not get far beyond the levels suggested by the author. Do the following:

- Drag the Fibo grid from point X to point A. Point B must get between 1.13-1.618 of the growth. If this point turns out a bit higher or lower than this range, it is okay, you can proceed to the next steps. It is super important that point B was above point X.
- Then drag the Fibo grid from point A to point B. Point C must get between 1.618-2.224.
- Now drag the grid from point B to point C, and this is the most important part. In a correct pattern, point D turns out at 0.50 correction level of the decline. Again, the author admits certain fluctuations, and if point D is above higher or lower than this level, the pattern is considered normal — you can proceed to opening positions by this pattern.
Where to place the Take Profit in 5-0?
Unfortunately, authors give no clear target levels for trading this pattern. Based on my experience, you can take the XA lengthy as the first and minimal goal.
As the second goal, you can count on the renewal of the local high, i.e. in a bullish pattern, you can expect growth above point C. However, then the price can face resistance as the upper border of the ascending channel. If this level is broken away, you may hold this position for however long.
Where to place the Stop Loss by the pattern?
According to the author, place an SL under the correction level of 0.618 of the BC move. If the price drops below this level, the author recommends to wait until it falls to the next level of correction of 0.886 and lower.
Hence, as suggested above, draw an ascending channel, place an SL below the lower border of the channel. If the price has broken through this area, you should better close your position because there are chances for a deeper decline to 0.886 of BC and lower.
How to trade the 5-0 pattern?
As in the case of other Harmonic patterns, I have shown you all the peculiarities of forming and detecting the pattern and demonstrated entry and exit points. Now you can proceed to opening positions by 5-0.
The main thing to remember is the correct position of point D. It forms near the correction level of 0.50 of the strong BC move. The price must bounce off the channel border.
See below the examples of real charts.


Opening a buying position
To open a buying position, find a graphic structure similar to an inverted Head and Shoulders pattern. Another option is to look for something similar to the Double Bottom pattern already processed by the market where the second top is much lower than the first one, and the price has already gone up.
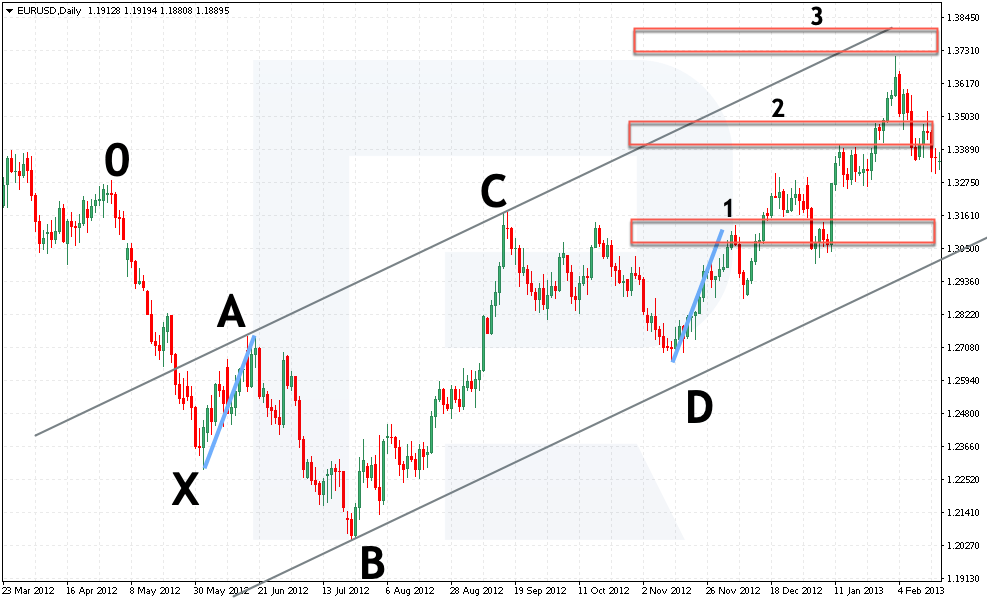
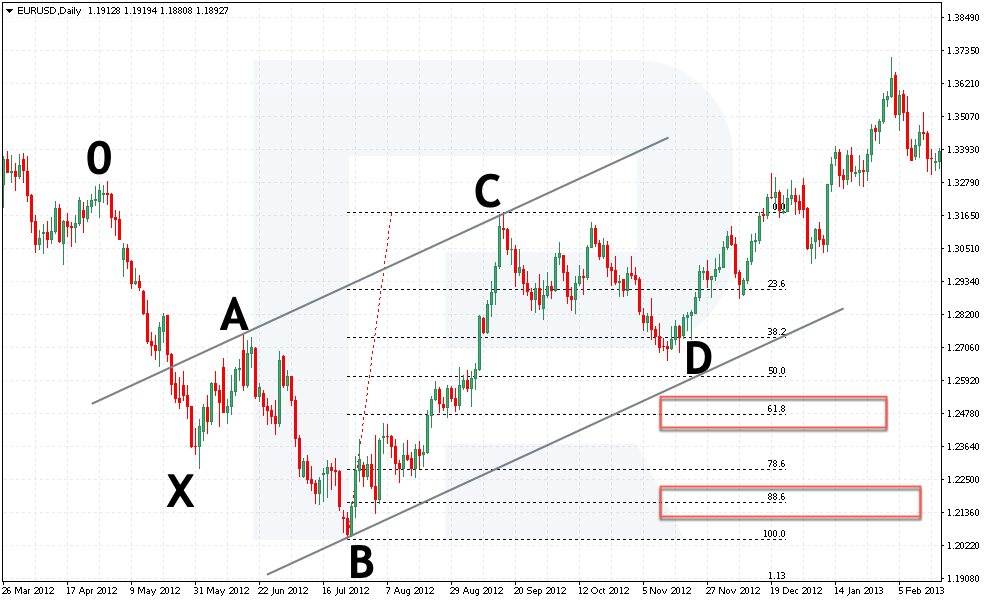
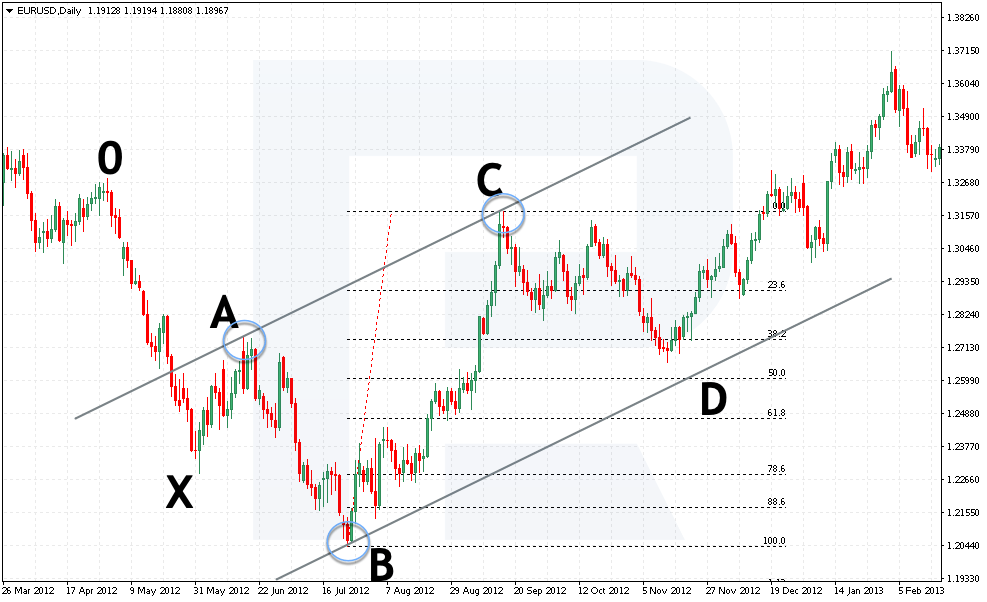
EUR/USD, D1. As we can see, the price pattern is, indeed, similar to an inverted Head and Shoulders pattern. The second Shoulder is extended timewise. You can start checking the alleged 5-0 points by the Fibo grid.
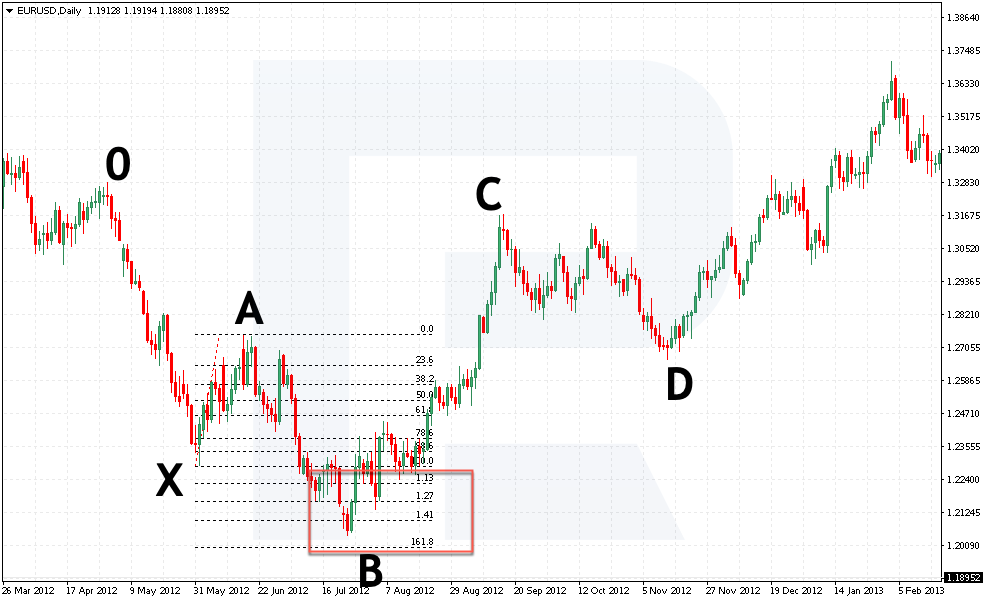
1. Drag the Fibo grid from point X to A. Point B has all but reached 1.618, but this goes by the rules because the point must get between 1.13-1.618.
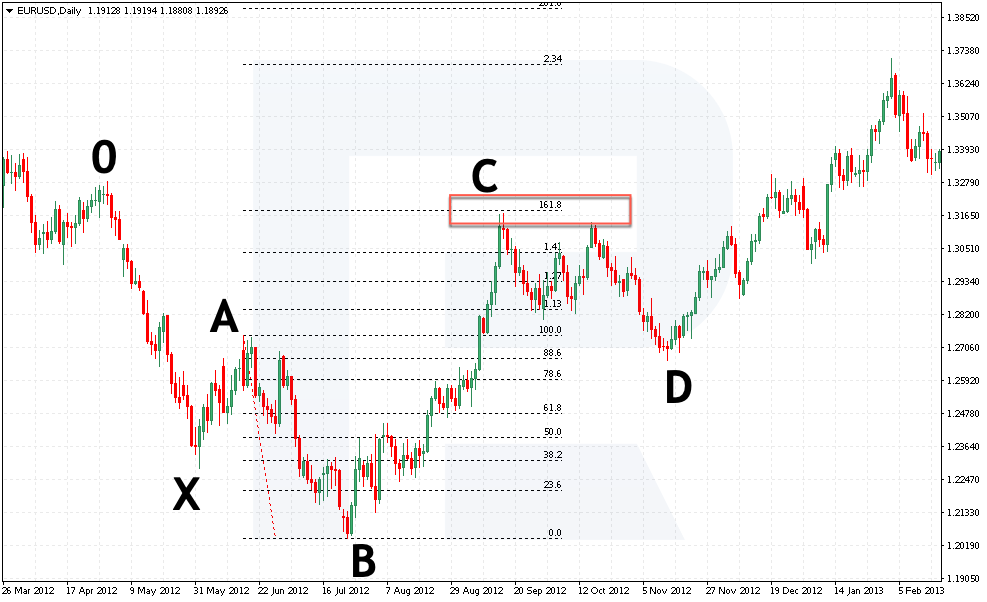
2. Now drag the grid from point A to B. We can see point C test the projection of 1.618 of AB wave, which is also by the rules of a correct pattern, so we go to the next point.
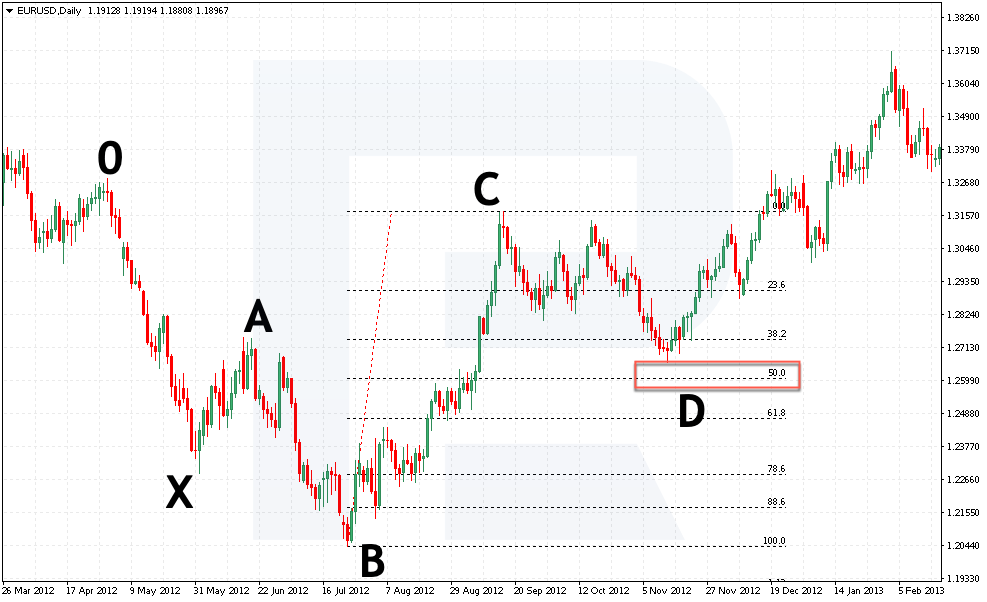
3. Drag the grid from point B to C and wait for the price to reach 0.50 of correction and start pushing upwards.
4. Next, draw an ascending channel. The first border goes through points A and C. The second one applies to point B. If the price remains inside the channel, this will be an additional signal to buy.
In our example, we get the area of 1.2615 where you can open a buying position. Place a Stop Loss below the correction area of 0.618 — we get 1.2470. To confirm the entry point, you can draw a descending trendline and wait for it to be broken away upwards.
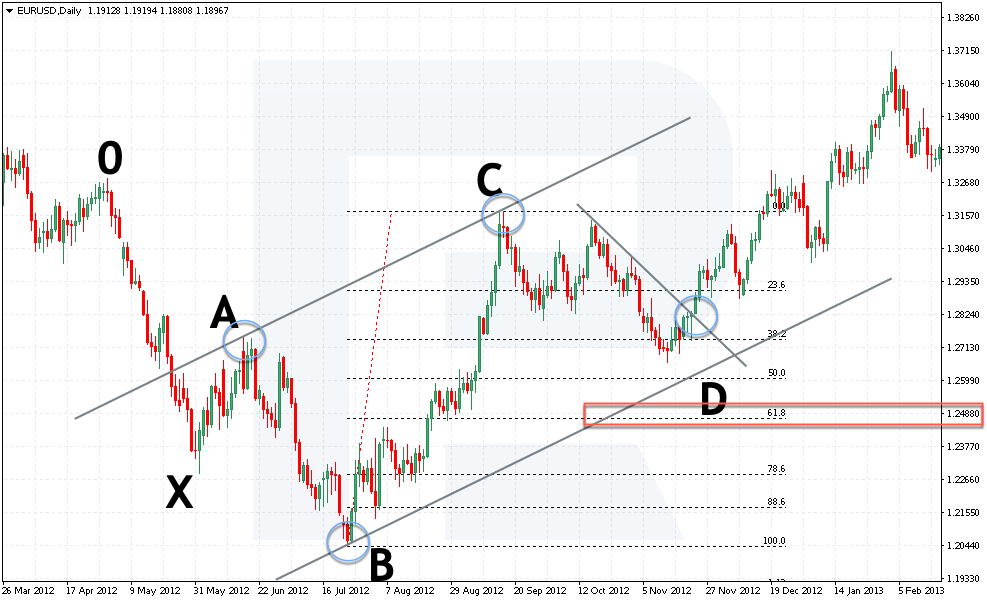
Only after that, open a buying position in EUR/USD. The first goal will be at 1.3110, which is the XA line. The second goal is 1.3195, which is the high of the pattern. Place the third goal based on the nearest resistance levels.


Selling by 5-0
To open a selling position, you just need to find a very erratic Head and Shoulders pattern with the second Shoulder visibly lower than the first one and the Neck heading downwards. This one also looks like a Double Top pattern to a certain extent with the second peak much higher than the first one and the price dropping significantly low while going by the pattern. You can look for the pattern on all timeframes.
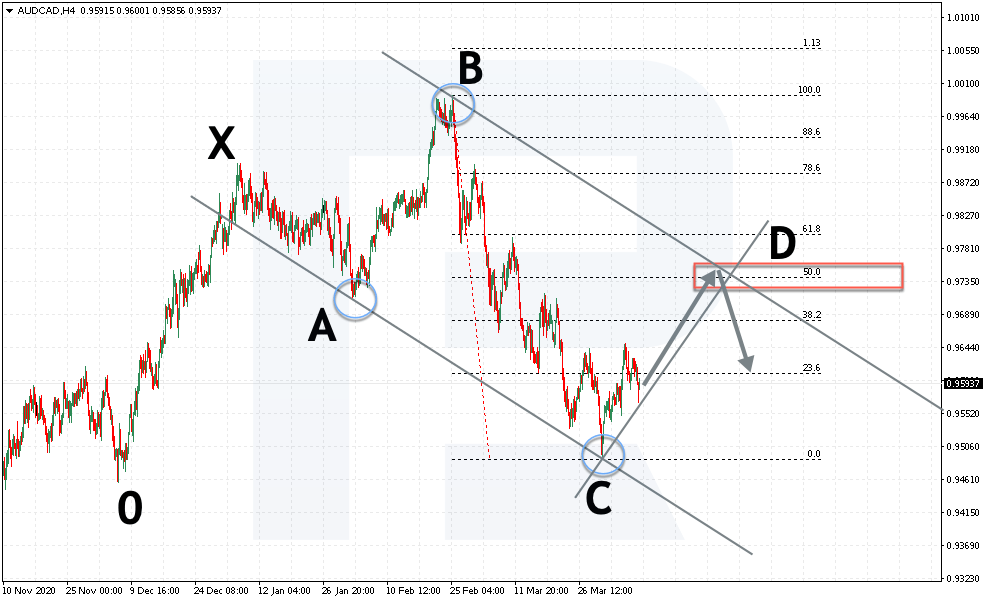
AUD/CAD, H4. You see that it is very similar to a processed Double Bottom pattern. The second peak is higher than the first one, and then the price drops. This is a characteristic behavior for 5-0. Start checking the pattern with Fibo levels. Note that the pattern is just forming, and we can assess all the entry and exit points on site and beforehand.
1. Drag the Fibo grid from point X to point A. As you see, a correction in point B rose a bit higher than 1.41, which is in compliance with the pattern rules — the point must get between 1.13-1.618.

2. Then check for point C to test the projection of 1.618 of the AB wave, which is again characteristic for the pattern. Hence, we switch to the next step.
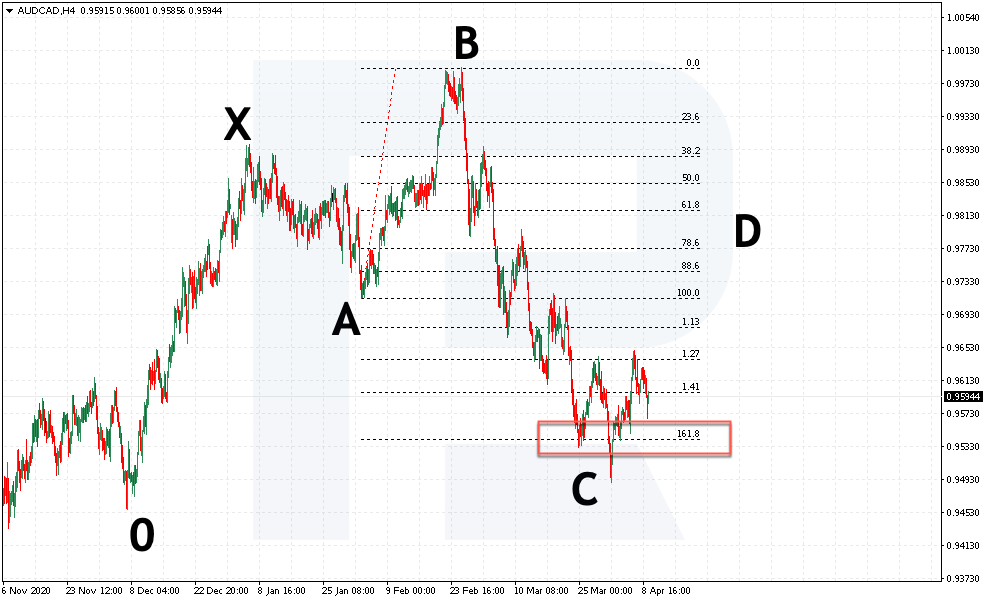
3. Drag the Fibo grid from point B to point C and wait for the price to reach 0.50 of the correction and start pushing downwards.
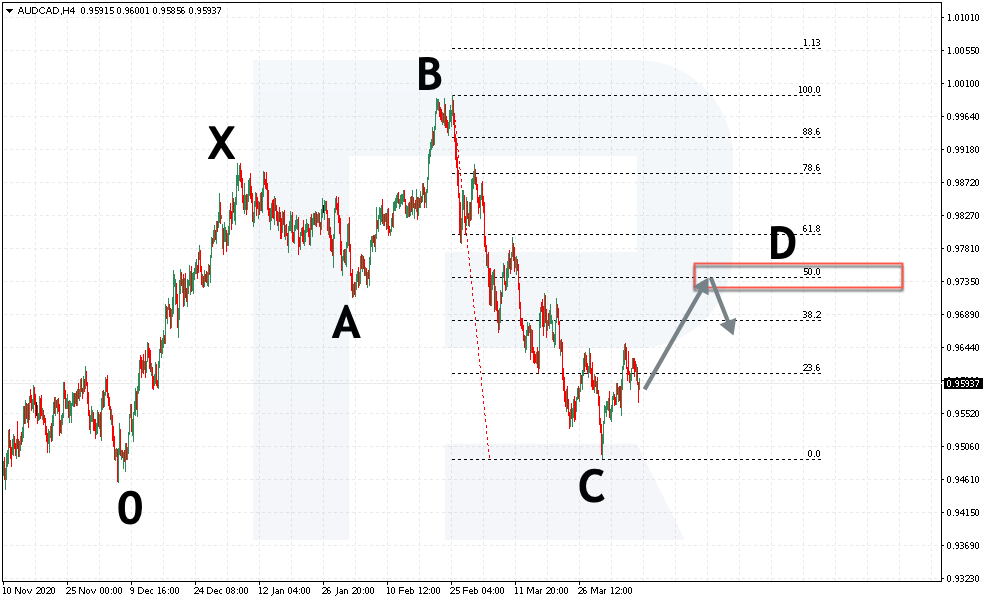
4. Then you can draw the price channel. The first border goes through points B and C. The second one applies to point B.
In our example of the bearish 5-0 pattern we got an area of 0.9740-0.9770 where you can open a selling position. Place an SL above 0.618, i.e. to point 0.9835. To confirm the entry point, you can draw an ascending trendline and wait for it to be broken away. Only then open a selling position.
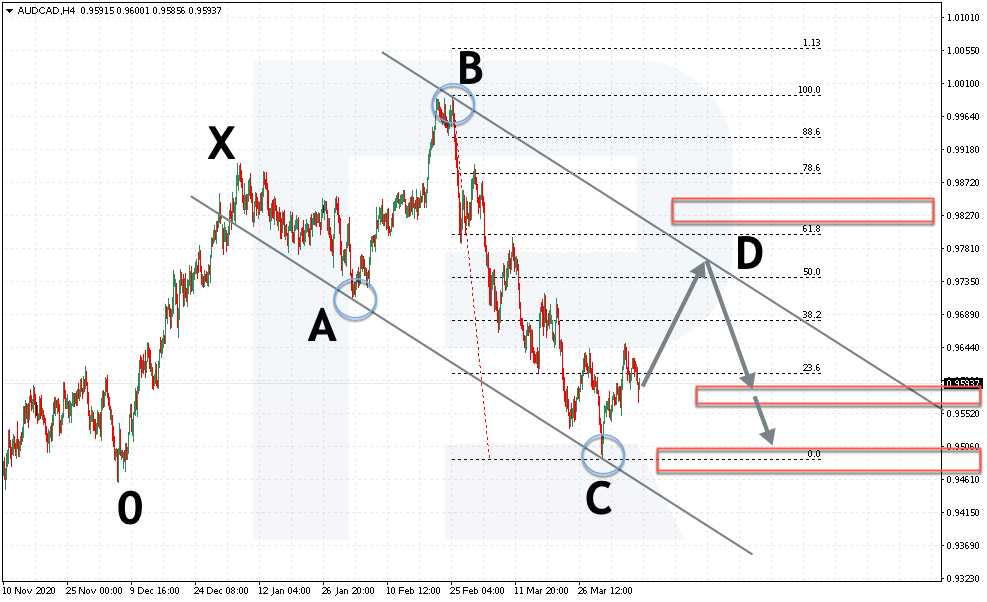
The first goal is at 0.9575, which is the XA line. The second goal is at 0.9490, which is the low of the pattern. As you can see, at the very moment of the pattern formation, you can find its completion, the SL and TP levels.
Closing thoughts
The 5-0 pattern is a yet another unique structure on the price chart, used in trading. With channels, opening positions is super simple. The pattern is presented and described by several authors with minor differences in the description. The pattern is most often a reversal structure, which means you do not only need to look for such a pattern by the current trend as long as it reverses the market.
As I have already mentioned in other articles, Harmonic Trading is a whole trading culture with its peculiar rules and a variety of graphic patterns. Here the trader learns to manage their position by breaking it up in parts to decrease the psychological load; also, they look for market entry confirmations.


