7 Harmonic Patterns That Rule the Trading World

9 minutes for reading
In this article, we will consider the use of harmonic patterns in trading. We will get acquainted with the history of their emergence, and the principles of their formation, and tell you about the most popular patterns.
What are harmonic patterns?
Harmonic patterns are graphical price patterns based on a combination of Fibonacci ratios and Elliott wave elements. The basis for such patterns was laid down in the works of Harold Gartley, a renowned analyst, and technical analysis specialist. His book "Profits in the Stock Market" describes his trading methodology in detail.
The harmonic patterns became widely known and popular at the end of the last century when Gartley's works were further developed by his followers – Scott Carney, Larry Pesavento, and Bryce Gilmore. They have refined the description of already known models, and also identified and described new ones.
Harmonic patterns are versatile: they can be used to trade on different timeframes and financial markets. The most popular are Gartley, Butterfly, 5-0, Crab, ABCD, Bat, and Shark.
Harmonic patterns in trading
Harmonic patterns are not limited to the forex market, as they can also be found in other trading markets such as stocks, futures, ETFs. In trading, harmonic patterns can be used to identify potential reversal points, areas of support and resistance, and entry and exit points.
Harmonic patterns in trading are based on the idea that the market has a cyclic behavior, which can be represented by certain geometric ratios, such as the Fibonacci sequence. These patterns can help traders identify potential trends and reversals, allowing them to make informed trading decisions.
Traders can use harmonic patterns to identify areas of support and resistance. When a harmonic pattern is identified, traders can use other technical analysis tools, such as trend lines, moving averages, or price action analysis, to confirm the pattern and make informed trading decisions.
Harmonic patterns can also be used to identify entry and exit points. For example, traders may use a bullish harmonic pattern to identify an area of support and look for a bullish candlestick pattern or price action signal to confirm the entry point.
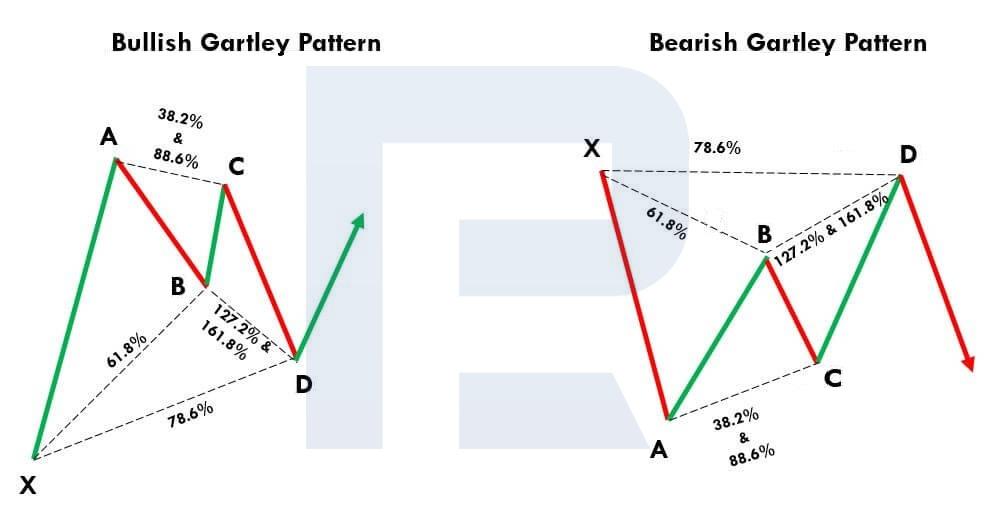
Harmonic Gartley pattern
The Gartley pattern is one of the first harmonic patterns described. It is also called "Gartley's butterfly" because of the similarity in the outlines of price movements, and the Fibonacci lines on the chart resembling the wings of a butterfly.
Stages in the formation of the harmonic Gartley pattern
- XA is the first impulse of the price movement on the chart
- AB is the correction from the first XA movement at approximately 61.8%
- BC can be 38.2%, 50%, 61.8%, 78.6%, 88.6% of the AB wavelength
- CD can be 127.2%, 146%, 150%, and 161.8% of the BC wavelength and ends around the correction level of 78.6% of the XA wavelength
- The D-point is the final point in the pattern, where a reversal of quotes is expected
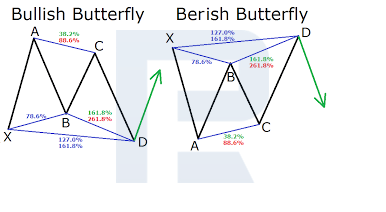
Harmonic Butterfly pattern
The Butterfly pattern, created by Bruce Gilmore, is very similar to the one mentioned above. Therefore, understandably, many traders confuse the two.
Stages in the formation of the harmonic Butterfly pattern
- XA is the first impulse of the price movement on the chart
- AB is the correction from the first XA movement at approximately 78.6%
- BC can range from 38.2% to 88.6% of the AB wavelength
- CD can range from 161.8% to 224% of the BC wavelength and ends at about 127.2% of the XA wavelength
- The D-point is the final point in the pattern, where a reversal of quotes is expected


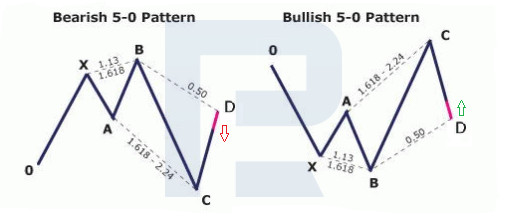
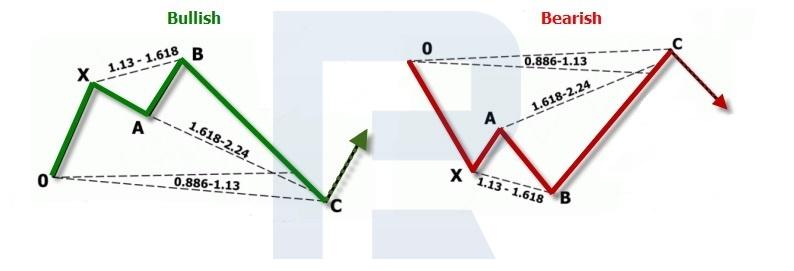
5-0 harmonic pattern
The 5-0 pattern was first described in detail in Scott Carney's book "Harmonic Trading: Volume Two", which was published in 2007. Visually, it resembles the Head & Shoulders and Wolf Waves patterns.
Stages in the formation of the 5-0 harmonic pattern
- OX is the first impulse of the price movement on the chart
- XA is the correction from the first OX movement
- AB can range from 113% to 161.8% of the OX wavelength
- BC is the longest wavelength and can be between 161.8% and 224% of the AB wavelength
- CD is the final leg of the pattern and ends at approximately 50% of the BC wavelength and 88.6-113% of the OX wavelength
- The D-point is the final point in the pattern, where a reversal of quotes is expected
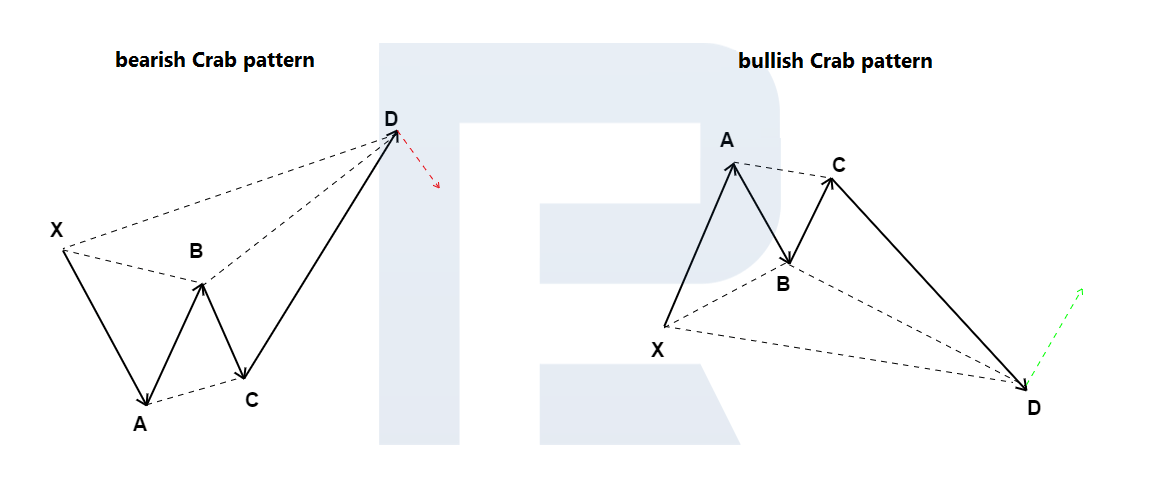
Crab harmonic pattern
The harmonic Crab pattern was introduced to the trading community by Scott Carney in 2000. Its appearance on the price chart signals the end of the current price momentum and an impending reversal.
Stages in the formation of the Crab harmonic pattern
- XA is the first impulse of the price movement on the chart
- AB is the correction from the first XA movement, ranging from 38.2% to 61.8%
- BC can range from 38.2% to 88.6% of the wavelength of AB
- CD, the longest wave, ends at about 161.8% of the XA wavelength and is an extension of 224-361.8% of the BC wavelength
- The D-point is the final point in the pattern, where a reversal of quotes is expected
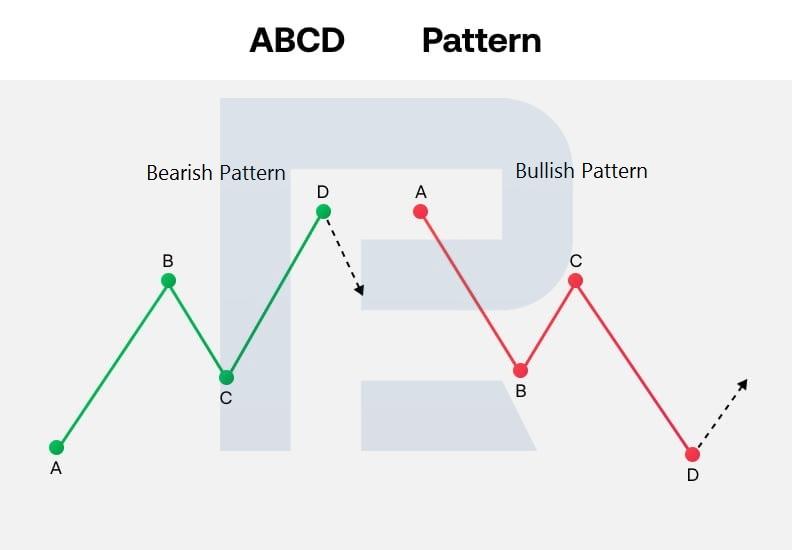
ABCD harmonic pattern
ABCD pattern is one of the most straightforward harmonic patterns and looks like diagonal lightning on a price chart. It is essentially a three-wave correction, after which the price movement towards the main trend can continue.
Stages in the formation of the ABCD harmonic pattern
- AB is the first impulse of the price movement on the chart
- BC is a correction from the first AB movement, ranging from 61.8% to 78.6%
- CD is the final wave, which could be 127.2% to 161.8% of the length of the BC wave, and should be roughly equal to the AB impulse
- The D-point is the final point in the pattern, where a reversal of quotes is expected


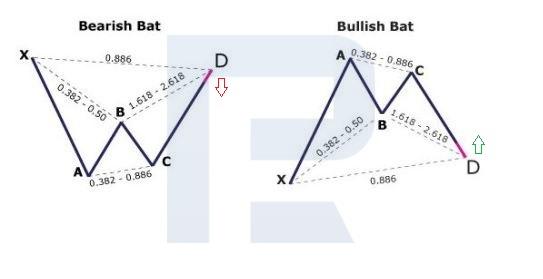
Harmonic Bat pattern
The Bat pattern was introduced by Scott Carney in 2001. It is characterised by a good Stop Loss to Take Profit ratio: usually 1:2 and above.
Stages in the formation of the harmonic Bat pattern
- XA is the first impulse of the price movement on the chart
- AB is the correction from the first XA movement, ranging from 38.2% to 50%
- BC can range from 38.2% to 88.6% of the wavelength of AB
- CD, the final wave, constitutes an extension of 161.8% to 261.8% of the BC wavelength and ends at about the correction level of 88.6% of the XA wavelength
- The D-point is the final point in the pattern, where a reversal of quotes is expected
Shark harmonic pattern
The harmonic Shark pattern was described in 2011 by Scott Carney. Its appearance on the price chart signals a possible trend reversal. The formed pattern visually resembles a shark's fin or its open mouth.
Stages of Shark harmonic pattern formation
- OX is the first impulse of the price movement on the chart
- XA is the correction from the first OX movement
- AB can range from 113% to 161.8% of the OX wavelength
- BC is the longest wavelength, ending at about 113% of the OX wavelength, and can be 161.8-224% of the AB wavelength
- Point C is the final point in the pattern where a reversal is expected
Harmonic patterns in forex
Harmonic patterns in forex are a popular technical analysis tool used to identify potential trading opportunities. These patterns are formed by a series of price movements that follow specific geometric ratios, typically the Fibonacci sequence. Harmonic patterns can help traders to identify potential areas of support and resistance, as well as entry and exit points.
One of the most common harmonic patterns in forex trading is the Gartley pattern. The Gartley pattern is a bullish pattern that can be identified by four distinct price points. These include the X point, which is the start of the pattern, the A point, which represents the first move down from the X point, the B point, which is a retracement of the move from A to X, and the C point, which is the second move down from the B point. The D point is the final point of the pattern, and it represents a retracement of the move from X to A.
Another common harmonic pattern in forex is the Butterfly pattern. The Butterfly pattern is a bullish pattern that can be identified by five distinct price points. These include the X point, which is the start of the pattern, the A point, which represents the first move down from the X point, the B point, which is a retracement of the move from A to X, the C point, which is the second move down from the B point, and the D point, which is the final point of the pattern and represents a retracement of the move from X to A.
It's important to note that while harmonic patterns can be an effective tool for trading forex, they are not infallible. Traders should always use additional analysis tools and risk management strategies to minimize their risk and increase their chances of success.
Harmonic patterns in the stock market
Harmonic patterns in the stock market are similar to those found in the forex market, where they can be used to identify potential trends and reversals. The same geometric ratios, such as the Fibonacci sequence, apply to the stock market as well, allowing traders to use harmonic patterns to identify key levels of support and resistance. By understanding and using harmonic patterns in the stock market, traders can make more informed trading decisions and potentially improve their profitability.
Conclusion
Many traders like to use harmonic patterns when trading. The combination of Fibonacci ratios with elements of Elliott Waves in these patterns helps to identify potential pivot points on the price chart and find trades with a good Stop Loss to Take Profit ratio.
Harmonic patterns are versatile: they can be used in different timeframes and financial markets. Special indicators have been created to automate their detection on the chart. Before using harmonic patterns in real trading, you should test their detection and execution on a demo account.


