Butterfly: How to Trade the Graphic Pattern?

12 minutes for reading
Technical analysis suggests a whole range of patterns. Each author tries to make their pattern unique and describe it in as much detail as possible. At a certain point, there even appeared a whole trend of adding the Fibo grid to already existing patterns to enhance identification. Such price structures are called Harmonic patterns.
Many investors add Fibo levels even to such simple patterns as Head and Shoulders to evaluate the position of Shoulders and whether it complies with the requirements to the pattern. For the Double Top pattern, they have invented the Dragon pattern, in which the author also uses the Fibo grid to assess the correctness of the pattern and whether it will work.
I have a reason to tell you all this. To the Butterfly pattern that I am describing below, the same principle is applied. To check whether the pattern has formed correctly, Fibo levels are used. The main issue is how to do it. Before answering this, let us get into the history and the specifics of the topic.
What is the difference between the Butterfly and Gartley?
The Butterfly pattern is very similar to the Gartley pattern (also called Gartley Butterfly). We already have an article on it. Many traders mix these two up but if you look closely, they are absolutely different.
The Gartley pattern was designed and presented by Harold Gartley in his book "Profit on the Stock Market". At that time, it did not include Fibonacci levels. Later, Harmonic traders added the levels and concluded that the B point of the pattern must be near 0.618 of the correction and point D — at 0.786.
As for Butterfly, point B is near 0.786, while point D is near the projection of 1.27 of the XA wave. This is the main difference between the Butterfly and Gartley patterns. As you can see, it would be a hard job to find this difference without Fibo levels.
How did the Butterfly pattern appear?
Butterfly has two "fathers": Bryce Gilmore and Scott M. Carney.
Bryce Gilmore first described the pattern in his Wave Trader program and was more oriented on the graphic side of the pattern, i.e. he detected the structure just by the chart, without the Fibo grid.
Scott M. Carney strictly tied all patterns up to Fibo and only afterward assessed the pattern itself. About Butterfly, he wrote in his book "Harmonic Trading: Volume One".
There he notes that he has several combinations of the pattern that include Fibo levels; as the most efficient one, he prefers that in which point B is at 0.786 of the XA wave, and the pattern is expected to complete at 1.27 of XA. Other combinations can be neglected.
How does the pattern form?
Butterfly contains five points: X, A, B, C, D. The points appear on the chart after ascending and descending impulses.
The pattern looks like the simplest Double Top or Double Bottom pattern; however, here we use the Fibo grid to identify the pattern and only then open positions. Moreover, while by the Double Bottom we sell, by Butterfly, we look for a signal to buy.
Does Butterfly work against the trend?
The pattern can appear on various timeframes. In the first books on Harmonic Trading, little attention was paid to the market trend, so you could trade the pattern in either direction. However, later, authors started to be more careful about the presence of a trend and its direction because the pattern works much better if it goes by the trend.
Just for your information: Butterfly can work against the trend but most likely, it will be just a correction. If we trade the trend, the price will not just reach the first goal but go far beyond.
The structure of a bullish Butterfly
A bullish pattern gives the trader a signal to buy. Each of the five points of Butterfly coincides with its own Fibo level.
Mind that even if the price reaches the marked level of point D, where we expect the pattern to end, do not rush at opening a buying position. This area is called the "Potential reversal area", which means that the price will not necessarily grow.
The bullish Butterfly pattern forms as follows:
- The price starts going upwards in the first point X. This is where the Butterfly starts forming.
- Upon testing the next point A, the quotations go down but no lower than point X. The place where the decline stops gets the name of point B.
- Upon testing point B, the quotations form an ascending impulse again but do not renew the high. The place where the growth ends is called point C.
- After they test this latter point, the quotations start their final decline which ends in point D. This will be the largest movement of all, and traders prepare to buy from this point.
Then you need to drag the Fibo grid over the chart to check the correctness of the Butterfly pattern. Do the following:
1. Drag the grid from point X to point A. If the pattern is correct, point B will be at 0.786; however, this is not a strict rule. If point B is above or below this level, this is okay, the author of the pattern admits certain deviations.
2. Then drag the grid from point A to point B. The latter must get between 0.382 and 0.886. If this does not happen, the pattern is considered broken, so we have to look for a new structure. If you are lucky, and point B is positioned correctly, go to the next stage.
3. Check the position of the key point D. Again, you will need the Fibo grid, now dragged from X to A: point D must test the projection of 1.27. Also, drag the grid from A to B; here, point D must get between 1.618 and 2.24.
If all the conditions are fulfilled, we can call the bullish Butterfly pattern complete. Open a buying position then.
The structure of a bearish Butterfly pattern
A bearish pattern pushes traders to sell. As you must have understood, bearish Butterflies also use Fibo levels to confirm the correctness of the points. In essence, a bearish Butterfly is an inverted bullish one.
The structure of a bearish Butterfly looks this way:
- The price starts its journey in point X; this will be the beginning of the bearish Butterfly.
- After the decline, upon testing point A, the quotations start growing but never rise above point X. The end of the growth is marked point B.
- Upon bouncing off point B, the quotations move inside a bearish impulse again but do not renew the low. The decline ends in point C.
- After a bounce upwards, the quotations start a bullish movement that ends in point D. This will be the largest swing, and traders prepare to sell from this point.
Then drag the Fibo grid over the chart to check the correctness of the formation. Dot the following:
1. Drag the Fibo grid from point X to point A. In a correct pattern, point B must be at 0.786. If the level coincides with our point, go to step two.
2. Drag the grid from point A to point B. Point B must get between 0.382 and 0.886. If things are okay, go on checking.
3. Make sure point D is positioned correctly: drag the grid from point X to point A. Point D must test the projection of 1.27. Also, drag the grid from B to C: point D must get between 1.618 and 2.24.
With all the conditions fulfilled, the Butterfly is considered complete.
Setting goals for a Butterfly
If a Butterfly goes by the trend, you can simply drag your Stop Loss after the price chart — this technique is called Trailing Stop. In this case, let your profit grow and do not rush at exiting the position.
Theoretically, the first goal of the pattern is at the level of point B because here is the nearest resistance or support level depending on the structure of the pattern.
The second goal is at the level of point C. Finally, the most optimistic one is on the projection of 1.618 from the XA wave. Traders who use Harmonic patterns advise closing positions in parts as soon as these goals are reached.
To control the profit, traders add a trendline: when the market breaks through it, you may close the position. Imagine you open a buying position, and the price goes in our direction. Then as the quotations proceed by the pattern, we draft an ascending trendline that will hint at the time to exit the market. This is a Position Management approach of Harmonic Trading.
Where to place a Stop Loss?
If you decide to buy in point D, traders advise limiting your loss by 1.41 from the XA line. However, if you buy at the breakaway of the trendline, you can place an SL behind the nearest local extreme.
How to trade by the Butterfly pattern?
Now that I have told you about the main nuances of the structure, entry, and exit points of the pattern, we can go to the issue of opening position by Butterfly. The important thing for us is the graphic structure of the pattern with point D that renews the extreme of the pattern. Here are some examples of real charts.
Opening a buying position
To open a buying position, find a graphic pattern that looks like a Double Top with the second top below the first one and a decline below the low. You may use any timeframes but the best option is to find the trend on a larger timeframe and look for the Butterfly itself on smaller ones.
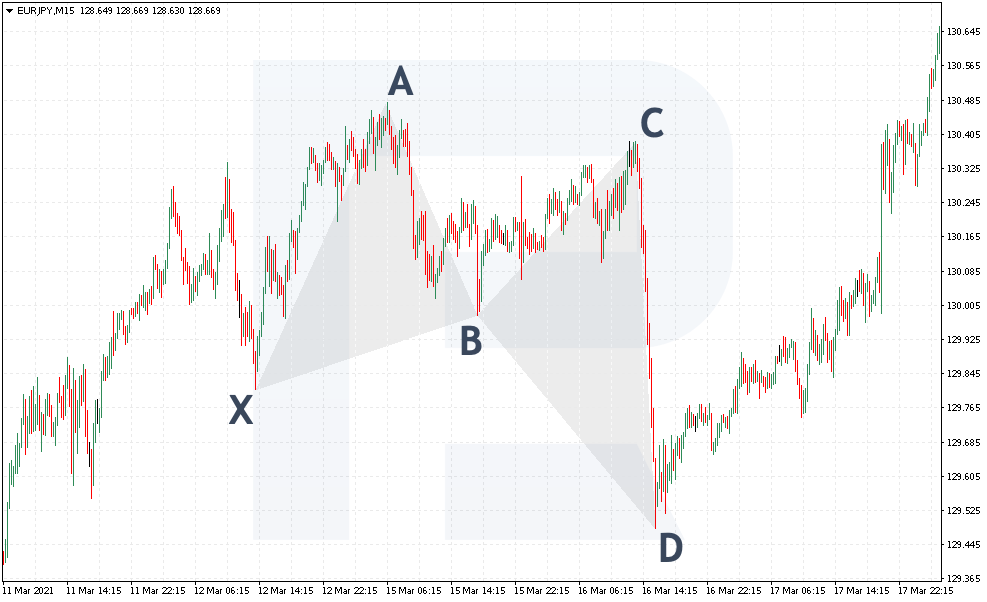
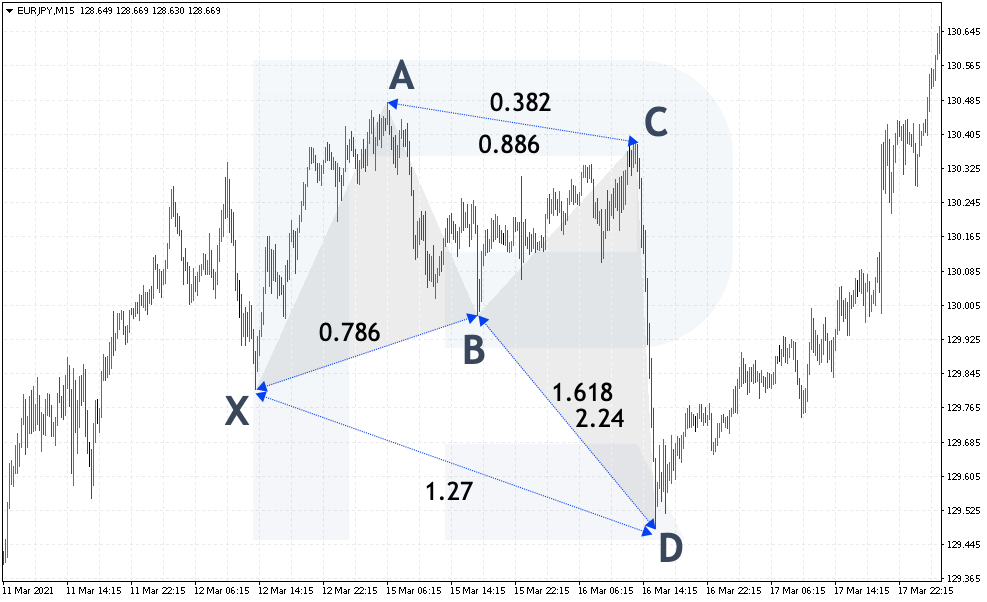
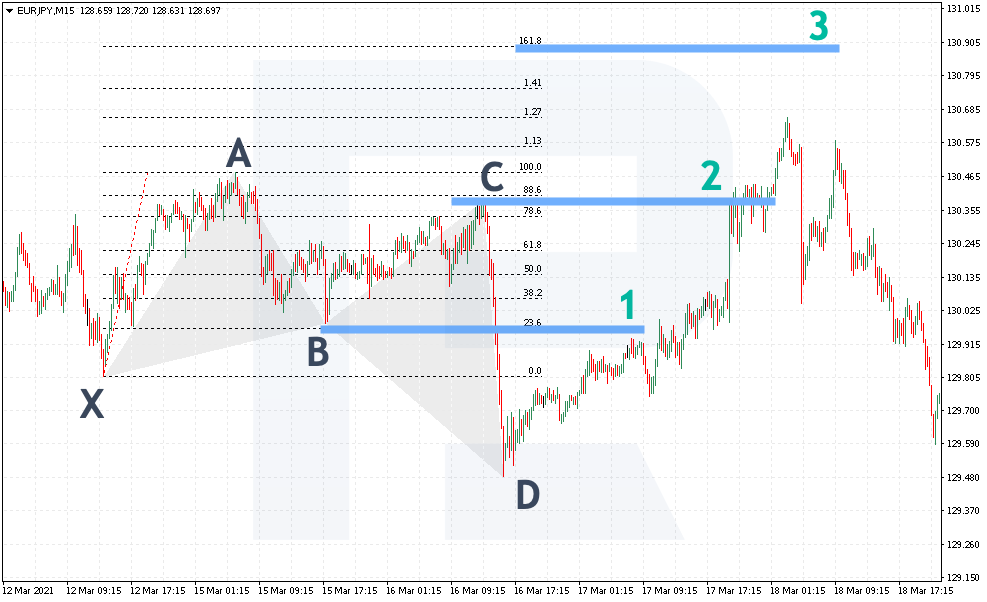
Look at EUR/JPY, M15 chart. The price structure, indeed, looks like a Double Top. The second peak turns out lower than the first one, then a serious decline follows, which is characteristic of a Butterfly. You can start marking the points and checking them with the Fibo grid.
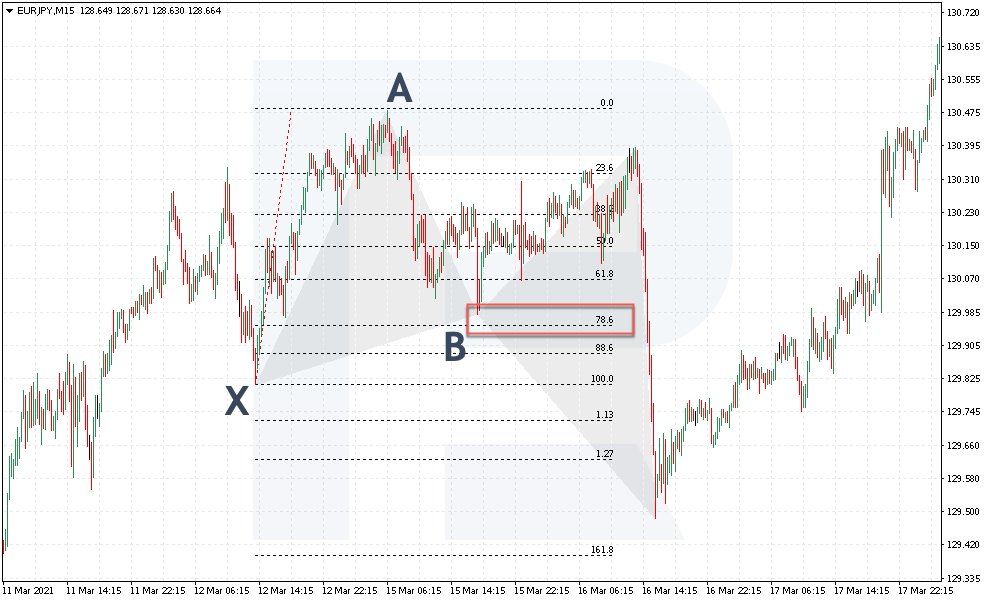
1. Drag the grid from point X to A. As you can see, the correction ended in point B roughly at 78.6.
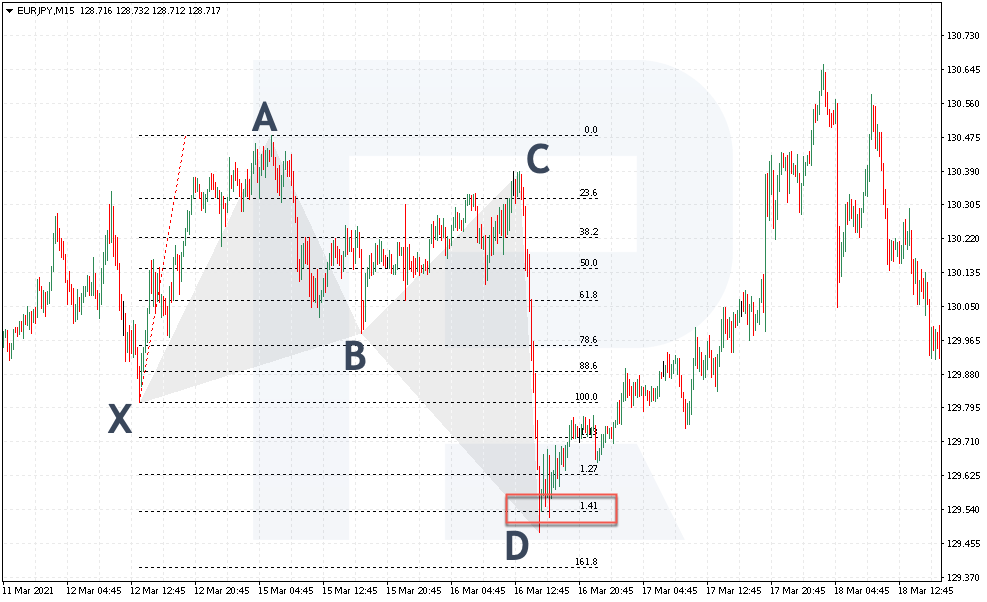
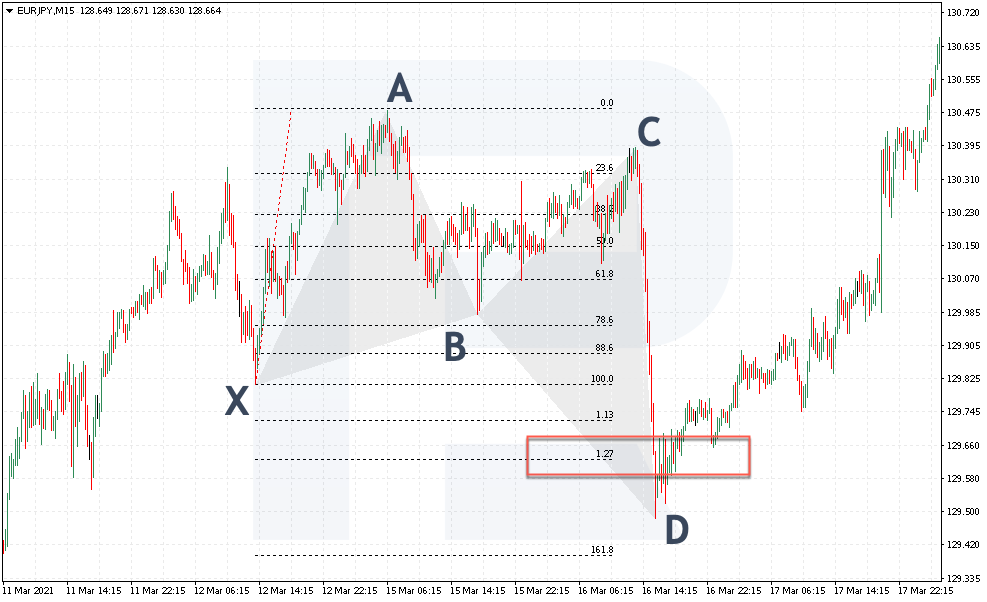
2. Then check for point D to test the projection of 1.27 from the XA wave, which is also a must of the Butterfly pattern.
3. Drag the grid from point B to point C: the price has also tested the projection between 1.618 and 2.24.
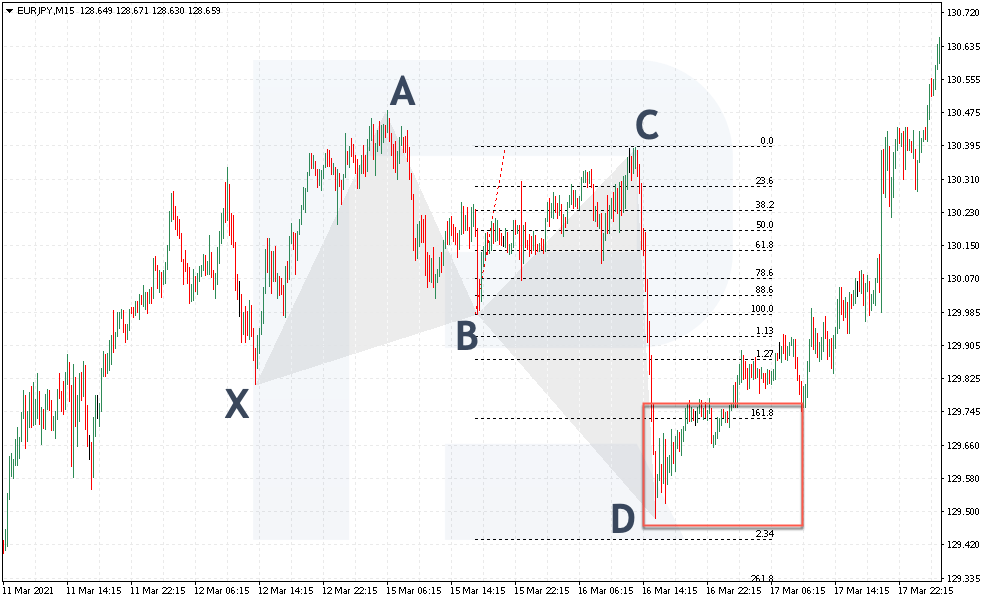
4. Besides, you can add the grid from point A to B. The correction in point C must end between 0.382 and 0.886.
In our example, all the Fibo levels coincide with the points of the pattern, which means you can proceed to looking for the entry point and placing the SL and TP.
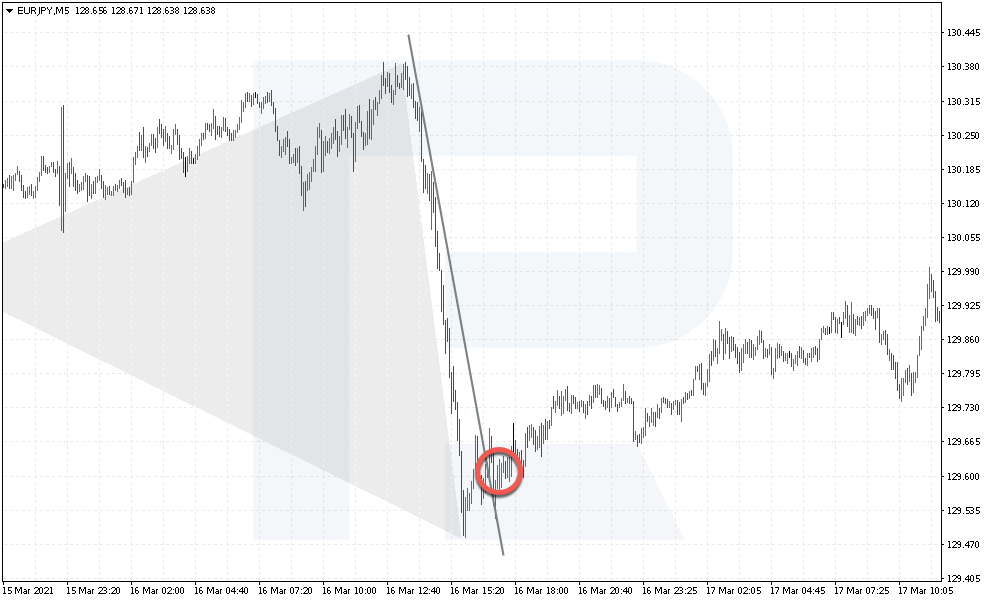
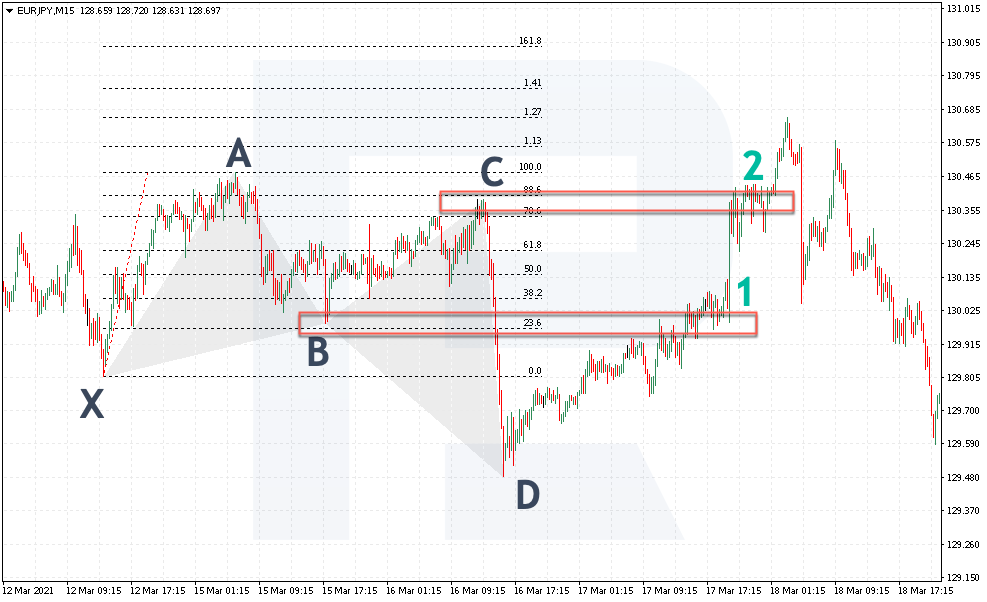
You may open a position when the descending trendline is broken through. EUR/JPY can be bought for 129.80. The first goal is at the level of point B — 129.95; the second goal is at point C — 130.45. The market reached both goals but the price failed to arrive at the farther one.
Opening a selling position
To open a selling position, find a graphic structure similar to the Double Bottom pattern, where the second low is no lower than the first one and the growth has crawled higher than the high. You can look for these patterns on all timeframes.
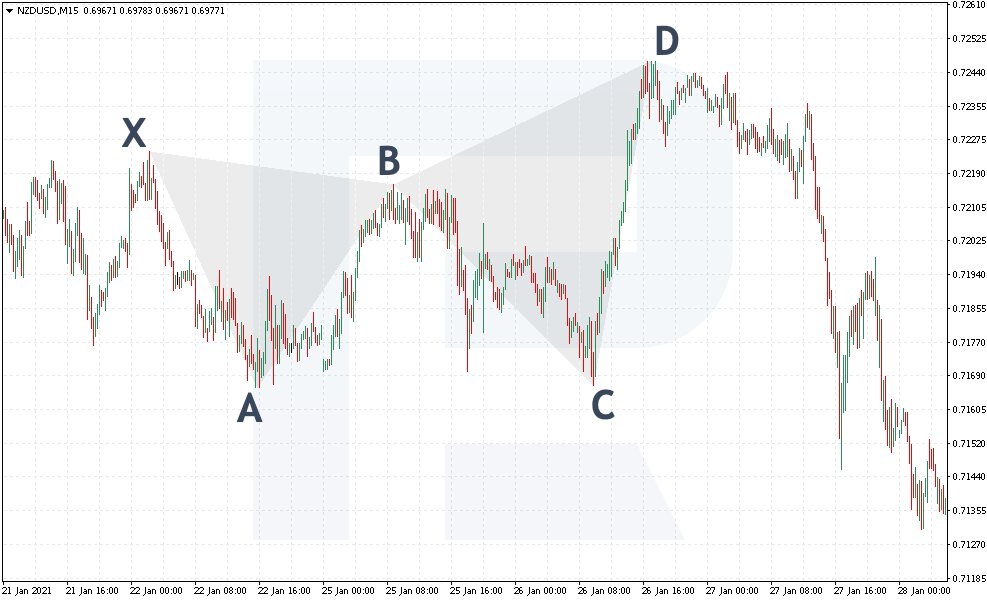
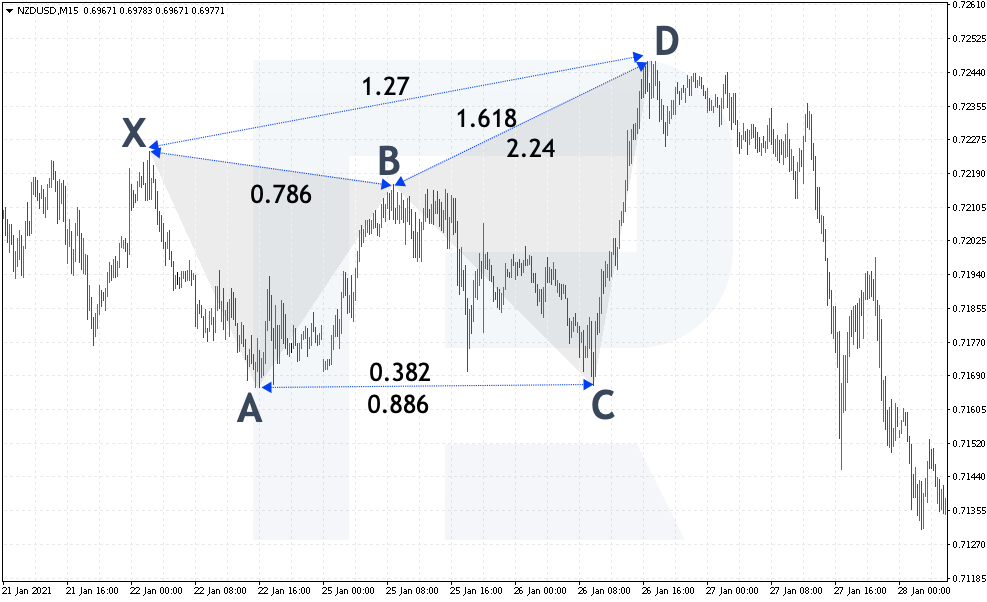
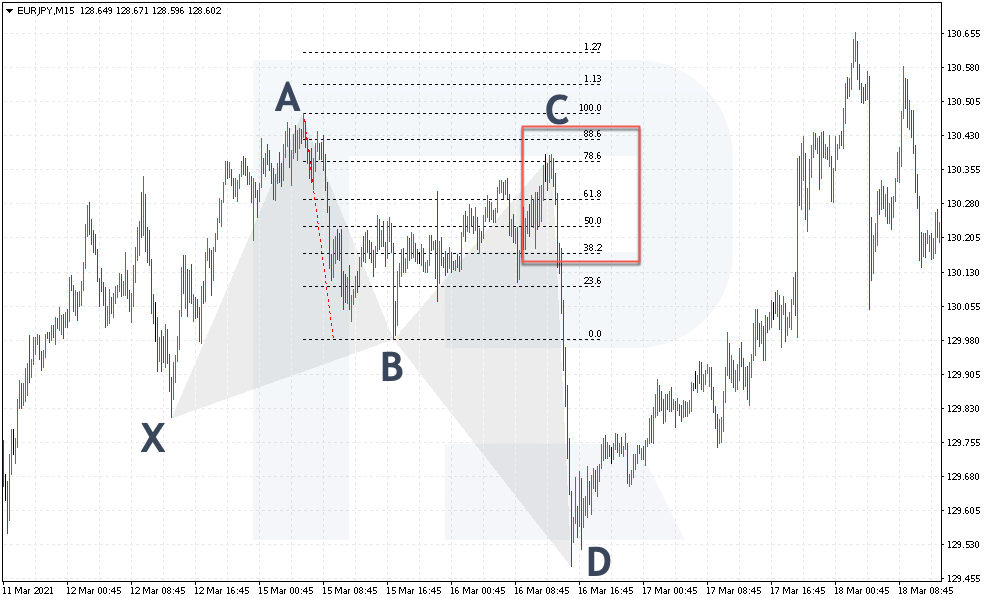
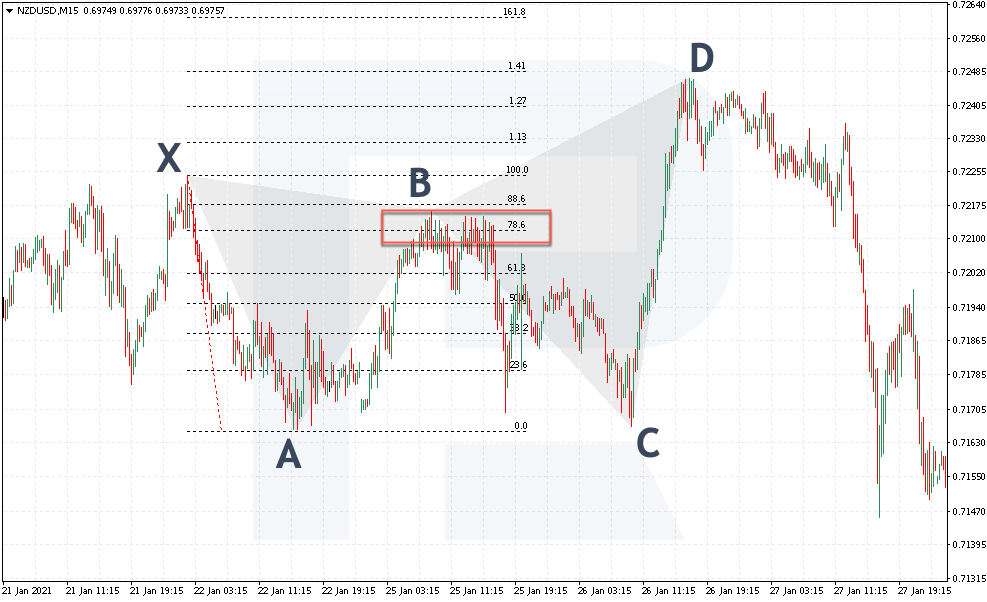
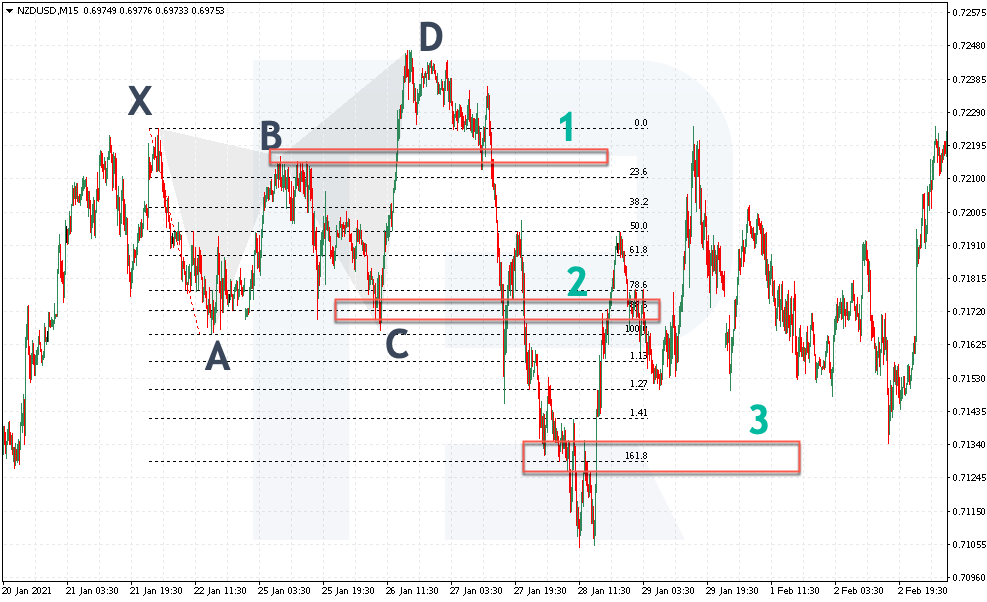
Here is the M15 of NZD/USD. The price structure is very similar to the Double Bottom pattern. The second peak is higher than the first one, then a mighty swing upwards follows, escaping the borders of the pattern — this is a characteristic trait of a Butterfly. Now you can start adding the Fibo grid.
1. Drag the grid from point X to point A. As we see, correction in point B has risen a bit higher than 78.6, which is in accordance with the rules of the pattern.
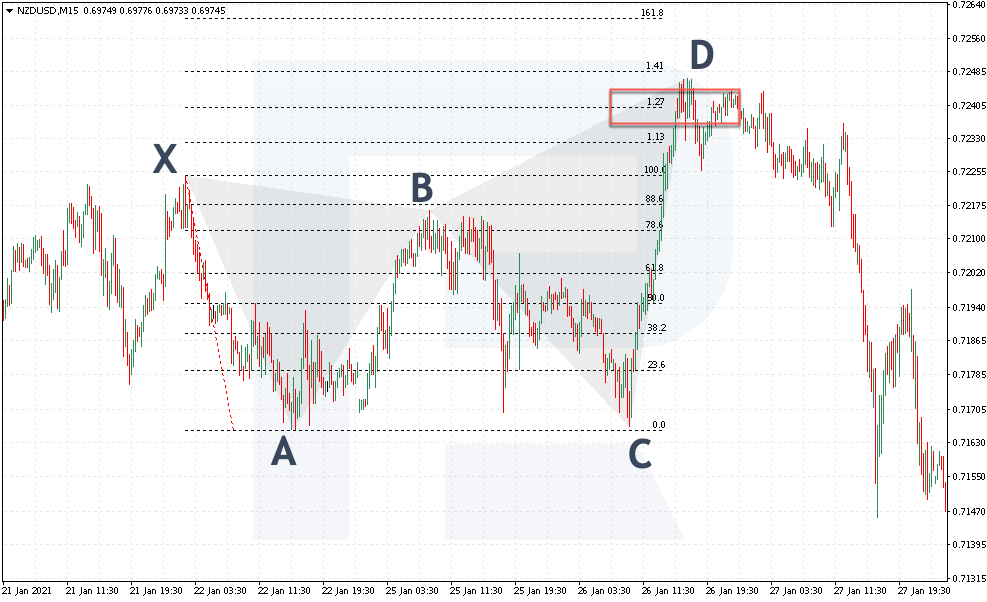
2. Then we see point D test the projection of 1.27 from wave XA, so we proceed to further check.
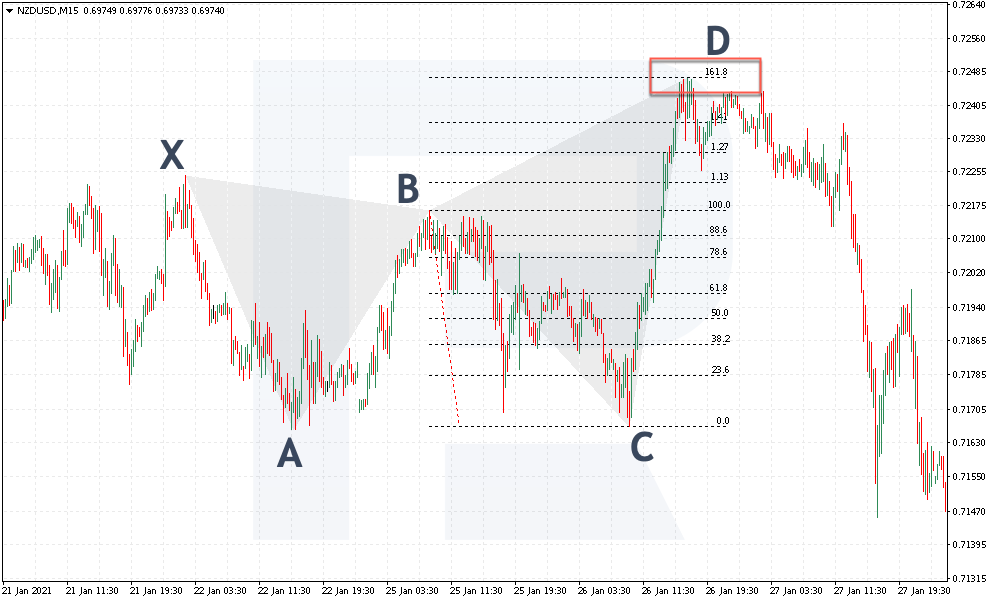
3. Drag the Fibo grid from point B to point C: the price also tests the projection of 1.618 and pushed off it downwards.
4. You may also add the grid from point A to B: here, the correction in point C has dropped a bit lower than 0.886.
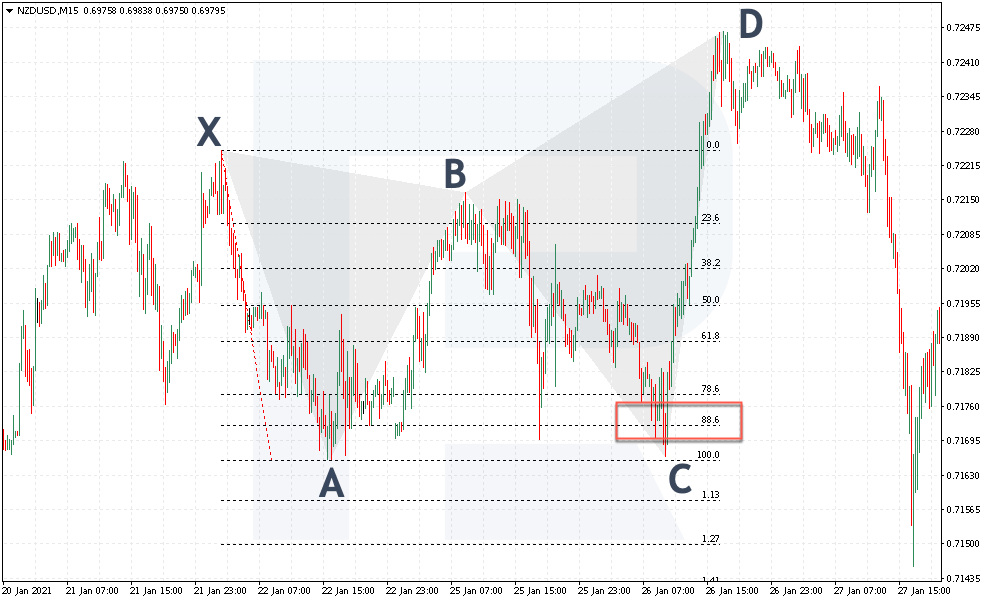
In our example, all the levels coincide with the points, so it is time to switch to looking for entry points and placing the SL and TP.
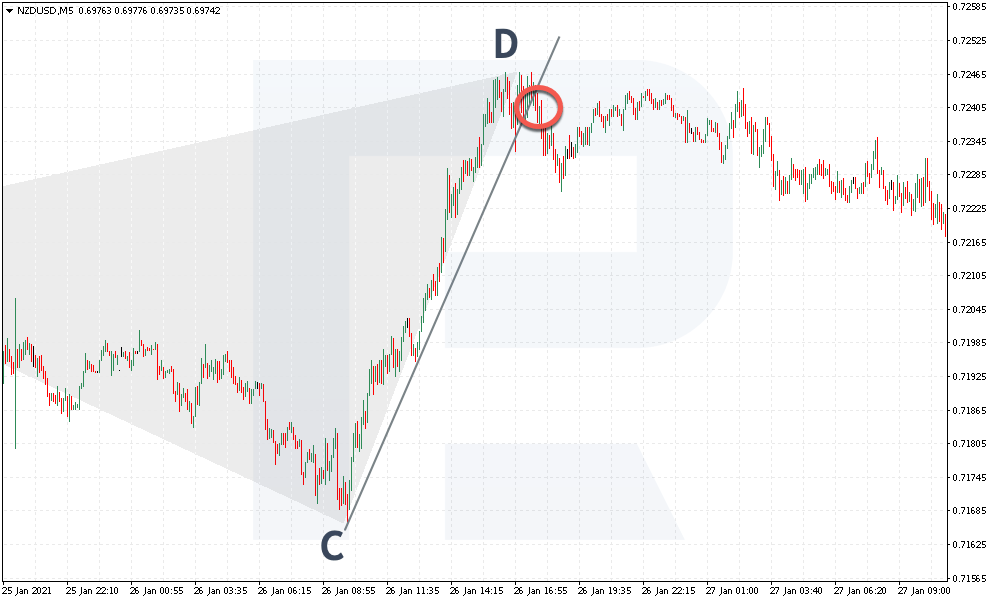
You can open a selling position with a breakaway of the ascending trendline. As you can see, NZD/USD sells at 0.7240. The first goal is at the level of point B — 0.7220; the second goal is at point C — 0.7185. The market has reached these two goals and even the third one at the level of the projection of 1.618 from the XA wave.
Closing thoughts
The Butterfly pattern is a graphic structure that consists of five points. It has clear entry and exit rules.
Harmonic Trading on the whole presumes trading by such patterns, not just describing them. A trader does not only open and closes positions near the levels that they have drawn by the Fibo grid but also learns to manage their trading, draws trendlines to find a good entry point, splits the position into parts for the sake of comfortable work, and uses Trailing Stop.
The Butterfly patterns should be traded by the trend because this way your potential profit will be much higher. Finally, never forget about money management, no matter how well the points coincide with Fibo levels and how harmonically the whole pattern looks.


