How to Trade the Crab Pattern
5 minutes for reading
In this review we will get acquainted with the harmonic Crab pattern. We will consider the stages of its formation on the price chart, and the strategy for its use in trading. We will compare it with the Deep Sea Crab pattern.
What is the Crab pattern?
This harmonic pattern was introduced to the trading community by Scott Carney in 2000. Its structure is very similar to many popular harmonic patterns, including the famous "Gartley’s Butterfly". The difference is in the different Fibonacci ratios: in the hero of our material, the final segment has a longer extension.
The harmonic Crab pattern consists of five points (X, A, B, C and D) and four price swings (XA, AB, BC and CD). The last one is formed by the point D, which is a potential reversal area. Its appearance is considered as a signal to open the positions for buying or selling. The appearance of the pattern on the chart signals the end of the current price impulse and the forthcoming reversal.
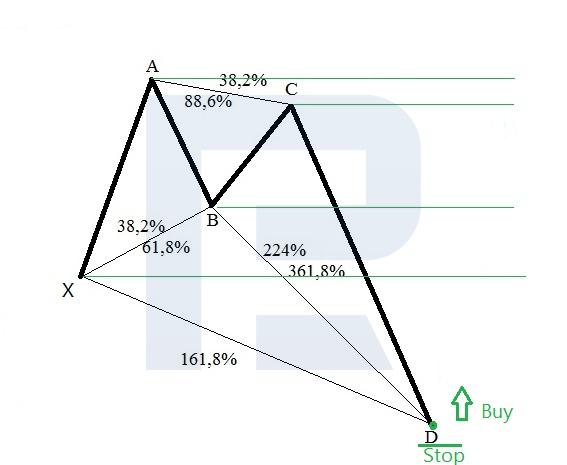
Stages of formation
- XA is the first impulse of the price movement on the chart.
- AB is the correction from the first XA movement, ranging from 38.2% to 61.8%.
- BC - can range from 38.2% to 88.6% of the length of AB.
- CD, the longest wave, ends around the 161.8% retracement level of XA and is an extension of 224-361.8% of BC.
- Point D is the final stage of formation.
A pattern can form on different timeframes. It can often represent a correction area, after the end of which the preceding trend is likely to continue. Relevant for trading in forex, stock, commodities and other financial markets.
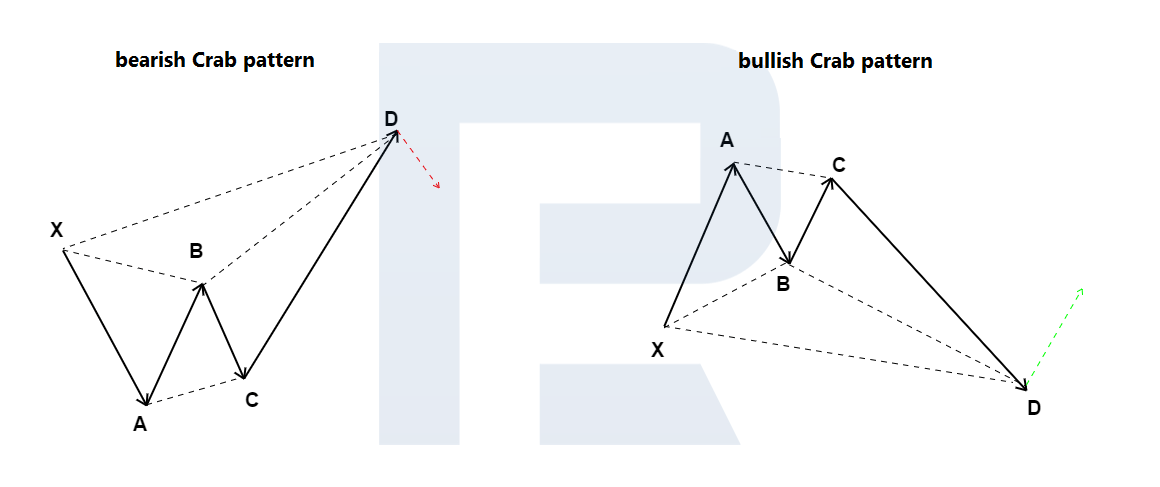
How a bullish Crab pattern is formed
- The first impulse of the XA price movement is upward.
- On the AB section, the price reverses and declines by 38.2-61.8% from XA.
- On the BC section, the price reverses again and rises to 38.2-88.6% of AB.
- On the CD, the price is actively declining and reaches about 161.8% of the XA. This is the longest wave.
- After the formation of the D-point, an upwards reversal and a further rise is expected.
How to trade the bullish Crab pattern
- A buy position can be opened once the D-point has been formed and quotes have shown an upward reversal.
- The Stop Loss is placed just below the pattern low at point D.
- The points X, B, C and the maximum of the model at point A can be used for Take Profit.
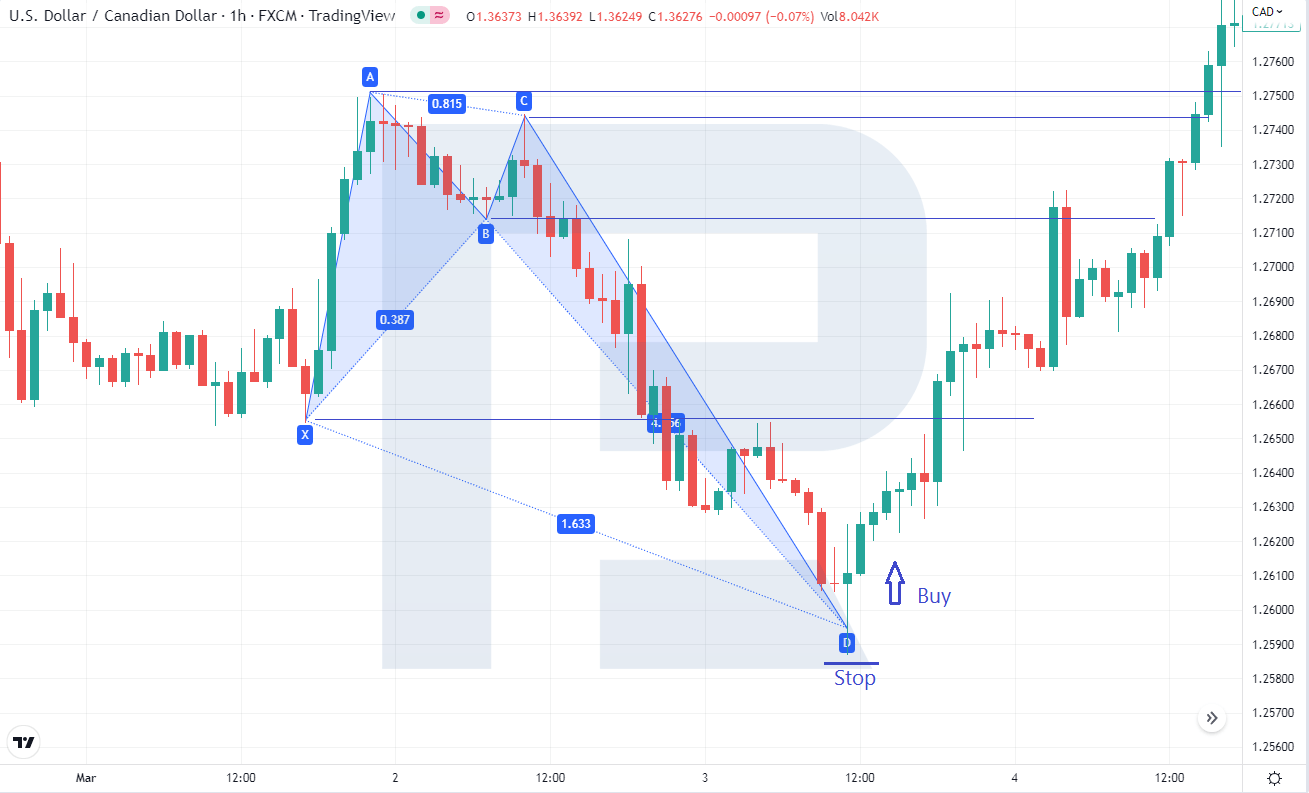
Example of trading the bullish Crab pattern
A pattern has been formed on the H1 chart of the USD/CAD currency pair. After the start of the upward movement of quotations from point D, it is possible to open a buy position. Stop Loss is set just below point D, the landmarks for profit taking are points X, B, C and the maximum at point A.
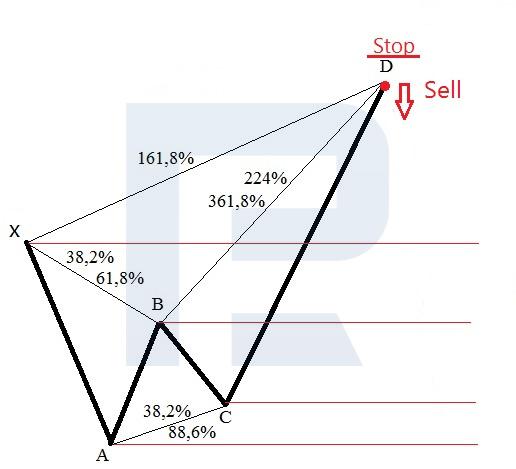
How a bearish Crab pattern is formed
- The first momentum of the XA price movement is downward.
- On the AB section, the price reverses and rises 38.2-61.8% from XA.
- On the BC section, the price reverses again and descends to 38.2-88.6% of AB.
- On the CD section, the price is actively rising and reaches about 161.8% of XA. This is the longest wave.
- After the formation of the D-point, a downwards reversal and further price declines are expected.
How to trade a bearish Crab pattern
- A sell position can be opened after the D-point has been formed and quotes have reversed downwards.
- Stop Loss is set just above the high at point D.
- For Take Profit, you can aim at points X, B, C, and the model low at point A.
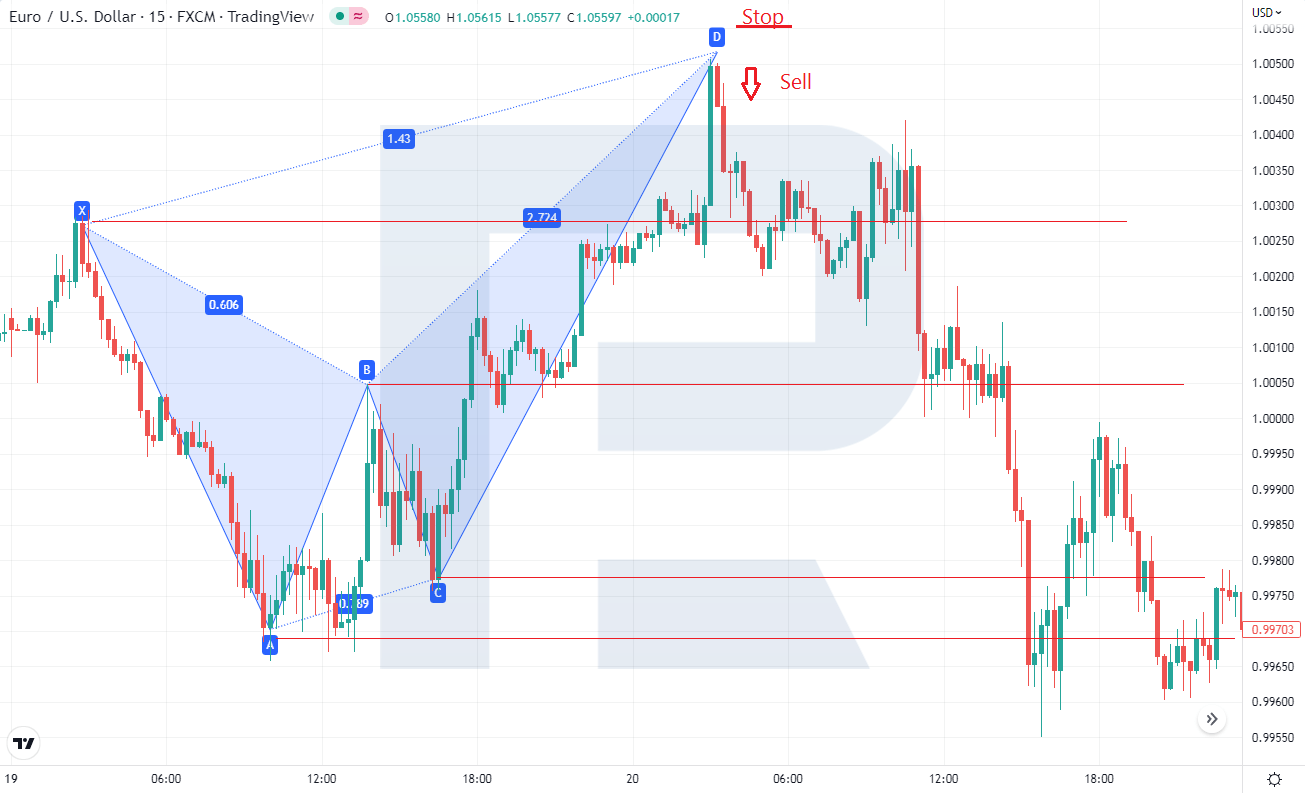
Example of trading a bearish Crab pattern
A pattern has formed on the M15 chart of the EUR/USD currency pair. After a downwards reversal from point D, it is possible to open a sell position. Stop Loss is set just above point D, the landmarks for profit taking are points X, B, C, and the minimum at point A.
What is the Deep Sea Crab pattern?
The Deep Sea Crab is a variation of the pattern to which our analysis is dedicated today. They are almost identical in terms of formation and structure, but differ in the length of the AB segment. In the Crab pattern, the AB length is between 38.2% and 61.8% of XA, while in the Deep-Sea Crab, it is at 88.6% of XA. The rules for trading are the same.
Conclusion
The Crab pattern is based on certain Fibonacci ratios. Its appearance on the price chart signals a possible reversal of the direction of quotations. Trading based on this model is appropriate for different timeframes and financial markets. Before applying it to real trading, you should test finding and working out the pattern on a demo account.


