How to Trade With the ABCD Pattern

5 minutes for reading
Warning: Invalid argument supplied for foreach() in /web/blogs/sites/blog.roboforex.com/wp-content/plugins/wp_glossary/includes/class-wpg-linkify.php on line 353
Warning: Invalid argument supplied for foreach() in /web/blogs/sites/blog.roboforex.com/wp-content/plugins/wp_glossary/includes/class-wpg-linkify.php on line 353
In this review, we will get acquainted with the ABCD harmonic pattern. We will take a look at how it is formed, and how it can be used in trading. We will tell you what tools you will need to find it on the chart.
What is the ABCD pattern in trading?
ABCD is one of the simplest harmonic patterns. It has only four points (A, B, C, and D) and three price swings (AB, BC, and CD). It looks like a diagonal lightning bolt on the price chart. The last point, D, is formed in the model, which is a potential reversal zone. Its appearance is considered a signal to open buy or sell positions.
The ABCD trading pattern in trading is a three-wave correction, after which the price movement towards the main trend can continue.
Stages of pattern formation
- AB is the first movement impulse in the pattern
- BC is a 61.8-78.6% Fibonacci retracement of AB
- CD is the final wave. It is an expansion of 127.2-161.8% Fibonacci from the BC segment and should be roughly equal to the AB impulse
- D is the last point of the pattern, and once it has been formed, the quotes are expected to reverse
The ABCD pattern is relevant for the Forex, stock, commodities, and other financial markets. It gives signals for both buy and sell trading. It is suitable for trading in all market conditions (range, uptrends, and downtrends) and in different time frames.
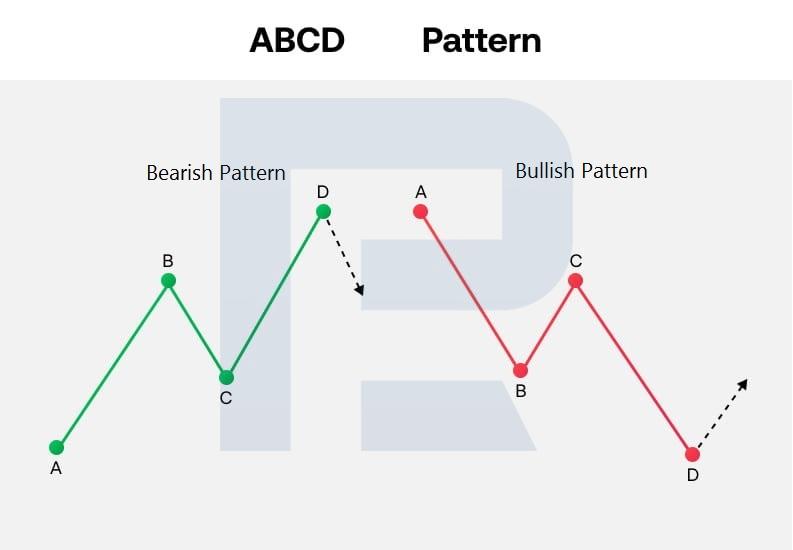
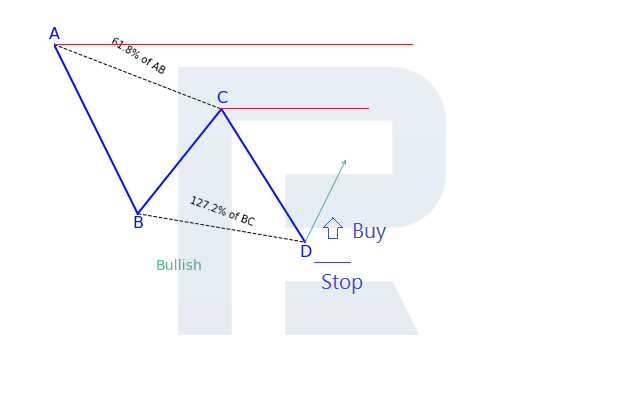
How an ABCD bullish pattern is formed
- The first impulse of the AB price movement is downwards
- In the BC section, the price reverses and rises to 61.8-78.6% of AB
- On the final stretch CD, the price reverses downwards and reaches 127.2-161.8% of the BC wave. The CD segment should be approximately equal to the first AB impulse
- Once the pattern is formed, quotes are expected to rise from point D
Rules for trading the bullish ABCD pattern
- A buy position can be opened once the D-point has been formed and quotations have started to reverse upwards
- The Stop Loss should be placed just below the pattern low at point D
- Take Profit can be based on the C point or the maximum value of the pattern at A
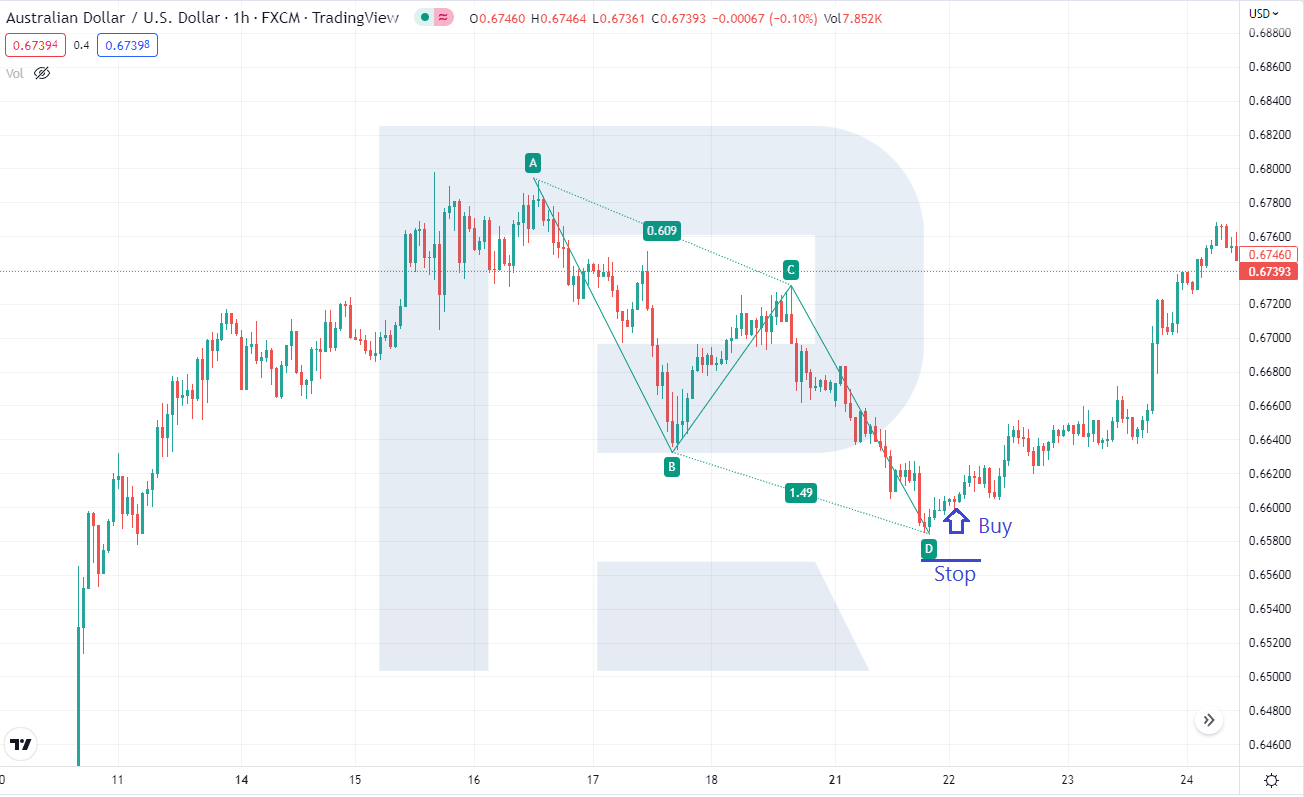
Example of trading the bullish ABCD pattern
A harmonic pattern has been formed on the H1 chart of the AUD/USD currency pair. Once the price starts moving up from point D, a buy position can be opened. Stop Loss is set just below point D, and the landmarks for profit-taking are points C, A, and above if there is a strong upward movement.
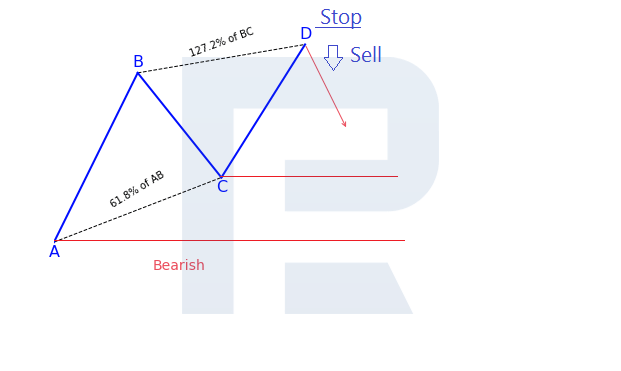
How a bearish ABCD pattern is formed
- The first wave of AB is ascending
- On the BC section, the price reverses and declines to 61.8-78.6% of AB
- On the last impulse CD, the price reverses upwards and reaches 127.2-161.8% of wave BC The CD leg should be roughly equal to the first AB wave
- Once the pattern is formed, a downward reversal at D is expected
ABCD bearish pattern trading rules
- A sell position can be opened after the D-point is formed and quotes have reversed downwards
- Stop Loss is set just above the high of the pattern at point D
- Take Profit can be based on the C point or the minimum value of the pattern at point A
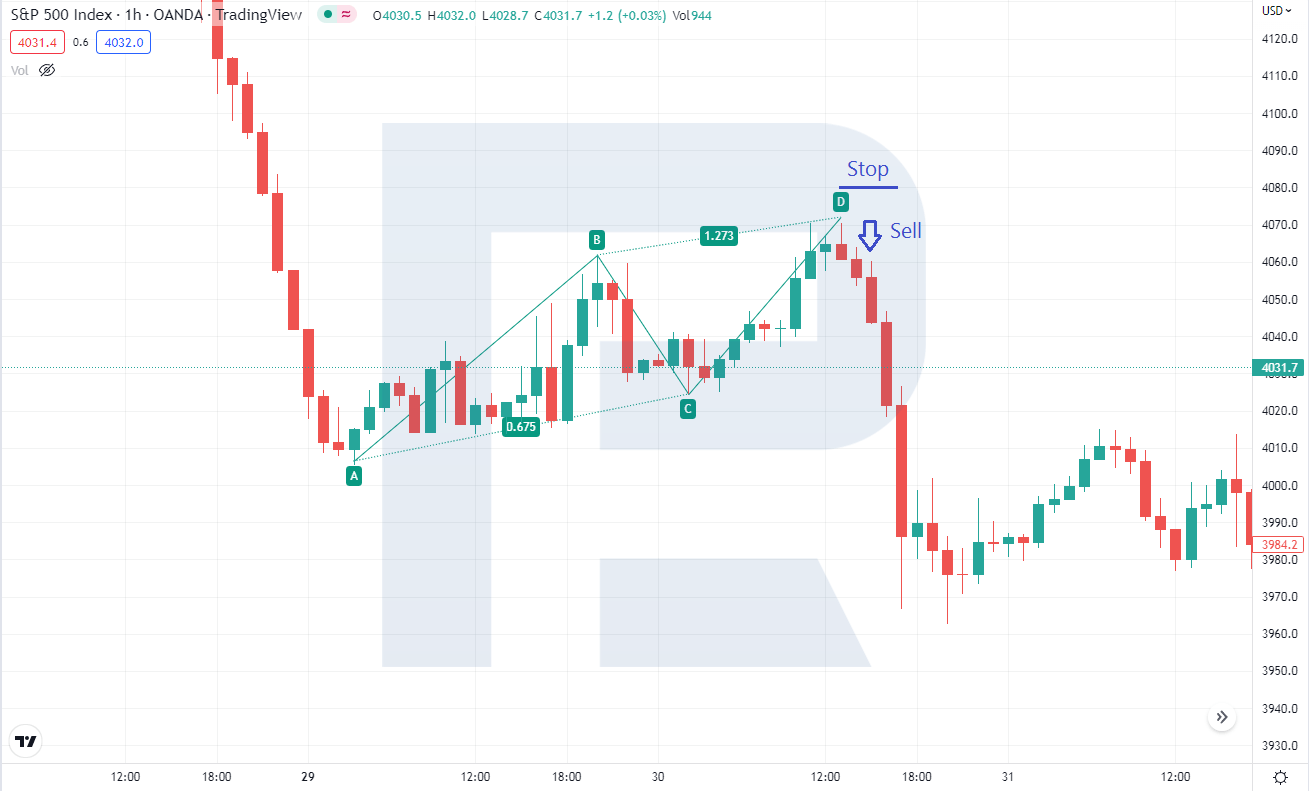
Example of trading with a bearish ABCD pattern
A bearish ABCD pattern has formed on the H1 chart of the S&P 500 index (US 500). A sell position can be opened after a downward reversal of the prices from point D. Stop Loss is set just above point D, and Take Profit is set at points C, A, and below if the price has a strong downtrend.
Tools for pattern recognition
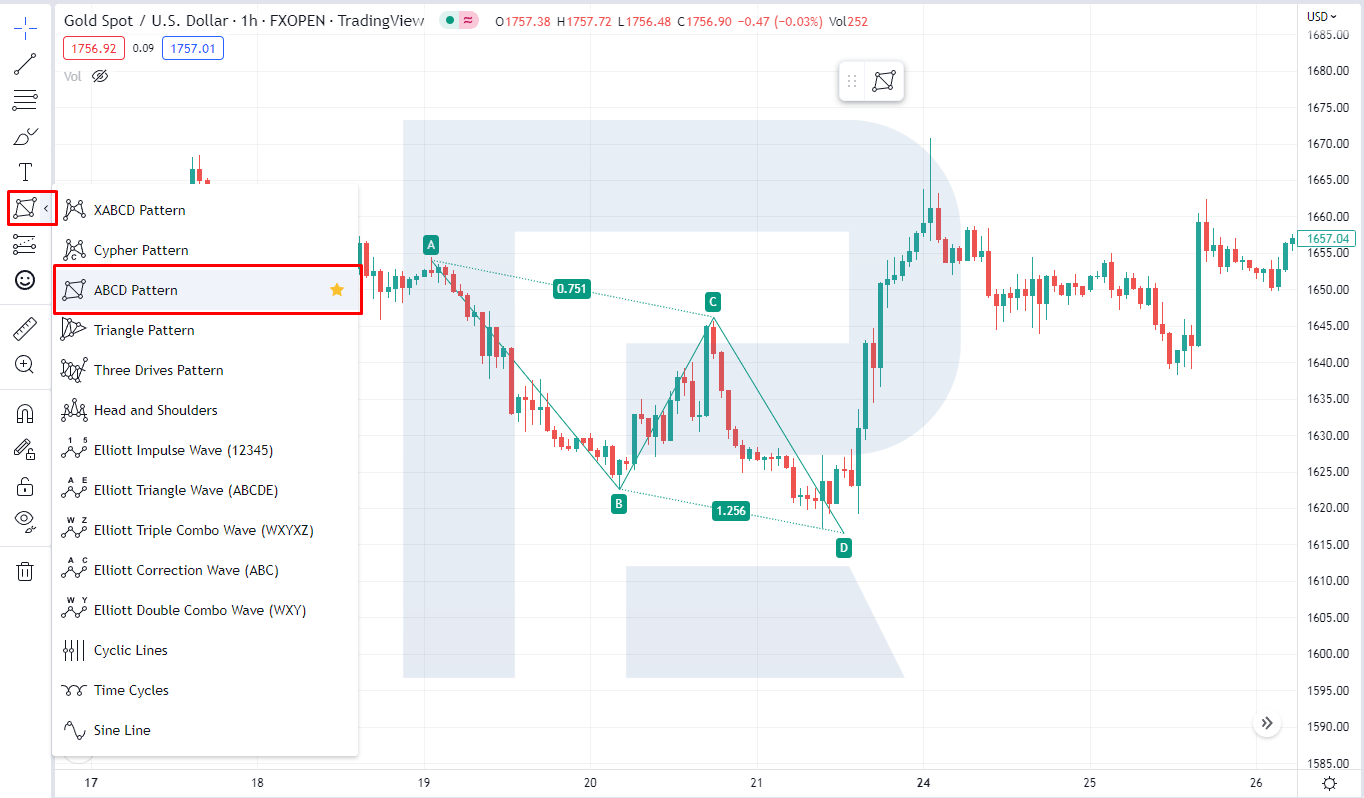
Once you understand what the ABCD pattern is in trading, you can learn how to find it on the charts yourself. The easiest way is with the help of special tools – indicators or chart assistants, such as ZUP and Autochartist.
Before using them, you should test them to see how well they find and draw patterns. When using graphical assistants, it is enough to specify the key points of the pattern, and they will draw the rest on their own and show the Fibonacci ratios, which you should use as a reference to find the patterns you are interested in. For example, this tool can be found on TradingView.com.
Conclusion
The ABCD pattern is a fairly simple harmonic pattern based on Fibonacci ratios. Trading on it is relevant for different financial markets. You can find it on the charts on your own, or with the help of special chart assistants and indicators. It should be tested on a demo account before being used in real trading.