What is Market Sentiment in Forex, and How It is Used in Trading

8 minutes for reading
In this overview, I will get you acquainted with such a notion as market sentiment in Forex. It helps confirm the current trend and warns you of its probable end.
What is market sentiment?
The market sentiment means the prevailing mood of most market participants at a certain moment. The word “sentiment” is of French origin and means “feeling, mood”. Market sentiment shows what market participants are currently keen on – buying a financial instrument (a group of assets) or selling it.
In other words, market sentiment is the current balance of traders’, investors’, and other market players’ optimism and pessimism about a certain financial market or asset. This is some sort of collective emotion based on certain expectations. The expectations are formed, as a rule, by the news and various fundamental factors.
For example, if market participants are sure that the stock market will be growing, they start buying shares actively and thus support the bullish trend. On the contrary, if most players are sure that the stock price will be falling, and a bearish trend will appear – they will start selling assets that they expect to decline soon. As a result, market supply will become excessive, making the price drop.
Forex market sentiment shows what most market participants prefer to do now: buy or sell currencies. Traders use such expressions as “buy bucks” - this means traders are ready to buy the USD against other currencies, or “sell bucks” - which means traders are ready to sell the USD against other currencies.
Market sentiment and expectations are influenced by several factors. Factors that support the currency rate form positive sentiment (moods to buy). Factors that drive the currency down form negative market sentiment (moods to sell). Check below the factors that influence Forex market sentiment.
What factors influence Forex market sentiment?
Market sentiment is mostly influenced by so-called fundamental factors. They include various financial, economic, and political events that influence directly currency rates. Such factors are studied by fundamental analysis. Here are the most important of such factors:
- Monetary policy of Central banks: cycles of increasing and decreasing the main interest rate can form long-term uptrends and downtrends in the national currency. If market players expect the rate to grow, the market sentiment will be bullish: market players will be ready to buy. If a decrease in the interest rate is expected, things go vice versa.
- Economic factors: if the news about the country’s economy is positive (GDP, employment, production, etc.), market sentiment about the currency improves.
- Political factors: elections, government resignations, scandals, sanctions, etc. can form negative market sentiment towards a currency.
- Rumors and expectations: they include political and economic factors but in the form of rumors and expectations.
- Force majeure: natural disasters, man-made disasters, terror acts, epidemics. All this can form serious negative sentiment towards a currency.
The influence of fundamental factors on Forex market sentiment can be short-term (several minutes to several days) or long-term (several weeks, months, years). For example, information about the growth of unemployment last month can have a short-term negative effect on market sentiment, while an announcement of the CB head about the necessity to increase interest rates can form a long-term positive sentiment to a currency.
Indicators for assessing Forex market sentiment
To detect the current market sentiment, various indicators can be used. They try to evaluate market sentiment and express it in digits or graphically. By them, one can conclude on the current positions and opinions of traders and how they can influence price moves.
Here are three popular indicators for assessing Forex sentiment.
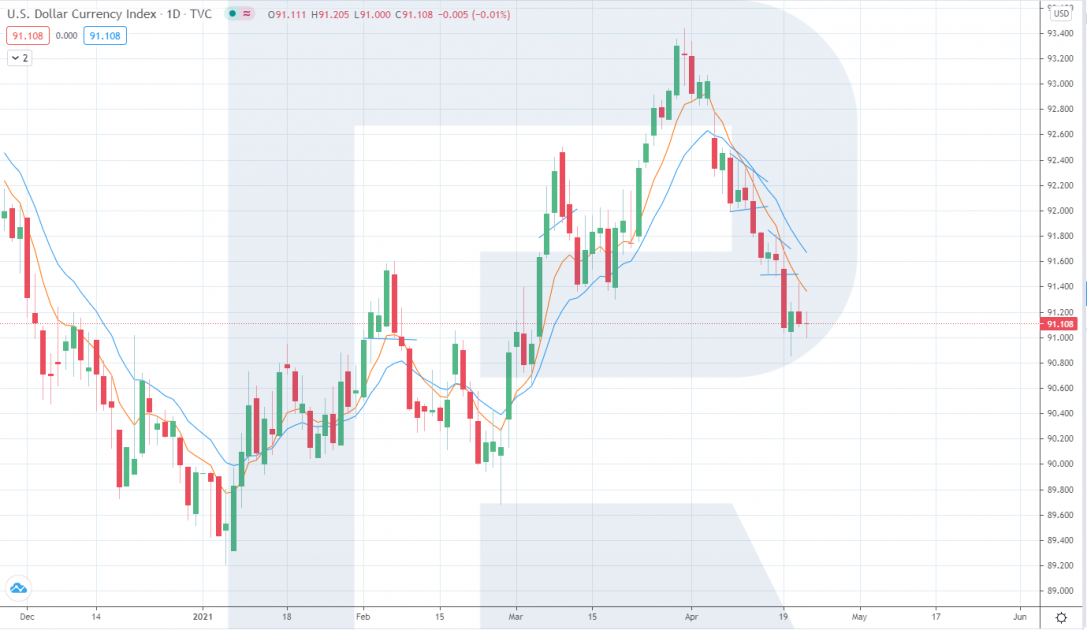
DXY
The DXY (US dollar index) is the main index that shows the current market sentiment towards the leading world’s currency. The direction in which the index goes (the current trend) reflects the actual market balance. The growth of the index means positive market sentiment and the growth of the USD against major currencies, while the decline of the index means negative sentiment and weakening of the major currency.
The DXY is traded in exchanges as futures and options. By tech analysis, you can analyze the chart of the index and detect the current sentiment towards the USD: positive, negative, or neutral. You can find the DXY chart on various informational resources such as tradingview.com.
COT reports on currency futures
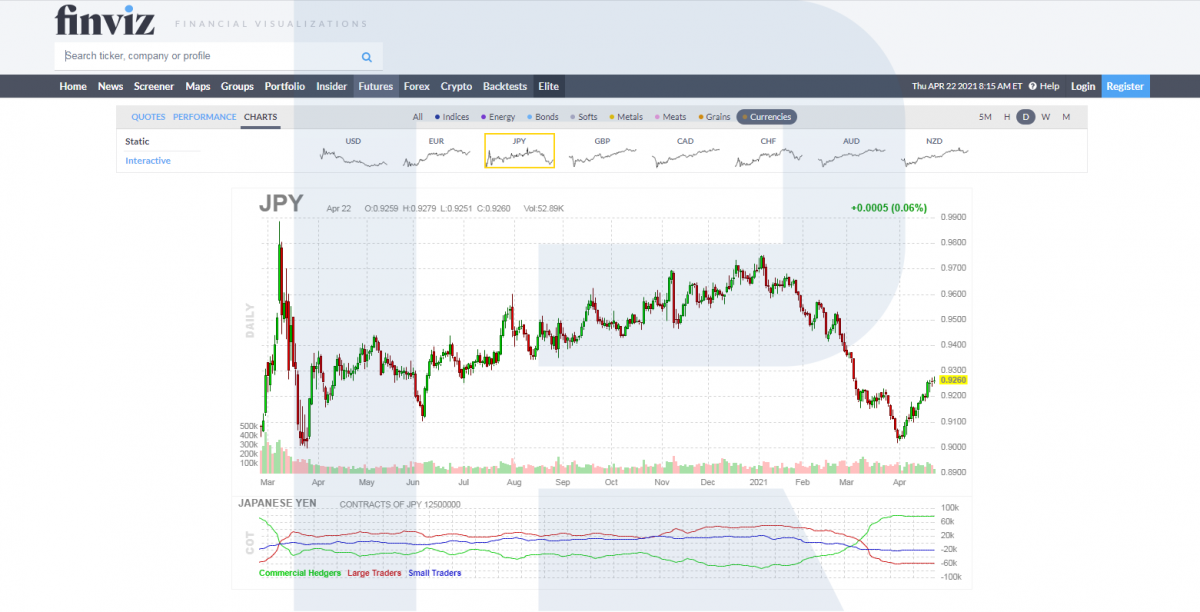
A COT (Commitments of Traders) report is a weekly publication showing aggregate positions of various players of futures markets. The COT is published every Friday by the US CFTC. Though this data refers to futures, they correlate strongly with the Forex market.
COT show clean long and short positions in futures on currencies (and other assets) of three groups of traders:
- Commercial Hedgers are large companies and entities that use the futures market to hedge their risks in the currency and spot markets. They influence the general sentiment moderately.
- Large Traders are major institutional investors, hedge funds, and other organizations trading in the futures market in order to invest and make profits. The sentiment of this group is more important.
- Small Traders: most of this category consists of private market players or small companies. Their influence on the market is scarce.
You can track the market sentiment of currency futures by the COT on various analytical resources, such as finviz.com. Under the charts of currency futures, you can find a diagram where the three groups of traders enumerated above are represented by three lines. When the lines are positive, buying positions prevail, while when the lines are in the negative area, this means selling positions dominate.
Moving Averages
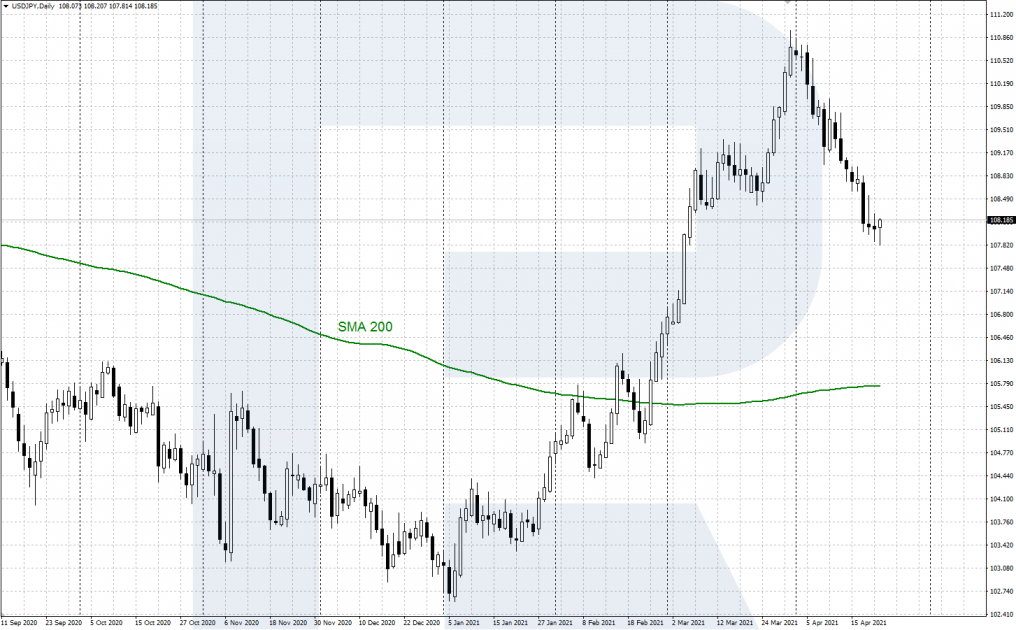
Another popular and demonstrative instrument for assessing the sentiment is the Moving Averages. They show the average value of the chosen currency pair in a certain period. If the price rises above the average, this means the current sentiment is positive; if it drops below the average, the sentiment is negative.
To assess short-term sentiment, use the MA with a short period (from 5 to 50), for long-term sentiments – the MA with a larger period (100, 200). For example, when the price crosses the 200-days SMA from below, this means the sentiment is becoming positive, and an uptrend might be starting. And vice versa, if the quotations drop below the 200-days SMA, this means negative sentiment and promises a downtrend.
Using Forex sentiment in trading
I would single out systems of using market sentiment in trading. The first strategy presumes using the sentiment for confirming the current market trend, i.e. it helps you choose the main direction n which you will trade. The second strategy presumes the use of signals for the end of the current trend and the beginning of a correction or even a reversal.
Confirming the current trend
You can use the indicators described above. When the indicators are not too close to their extremes, they can help you confirm the current trend:
- The DXY demonstrates an uptrend (positive sentiment towards the dollar) or a downtrend (negative sentiment towards the dollar).
- The diagram based on the COT shows when Large Traders start changing their position: if they go negative, this confirms a downtrend, and if they go positive – an uptrend.
- When the D1 chart crosses the 200-days SMA upwards, this confirms an uptrend, and if it crosses it downwards, this means a downtrend.
- News: positive news supports uptrends, and negative news supports downtrends.
Example:
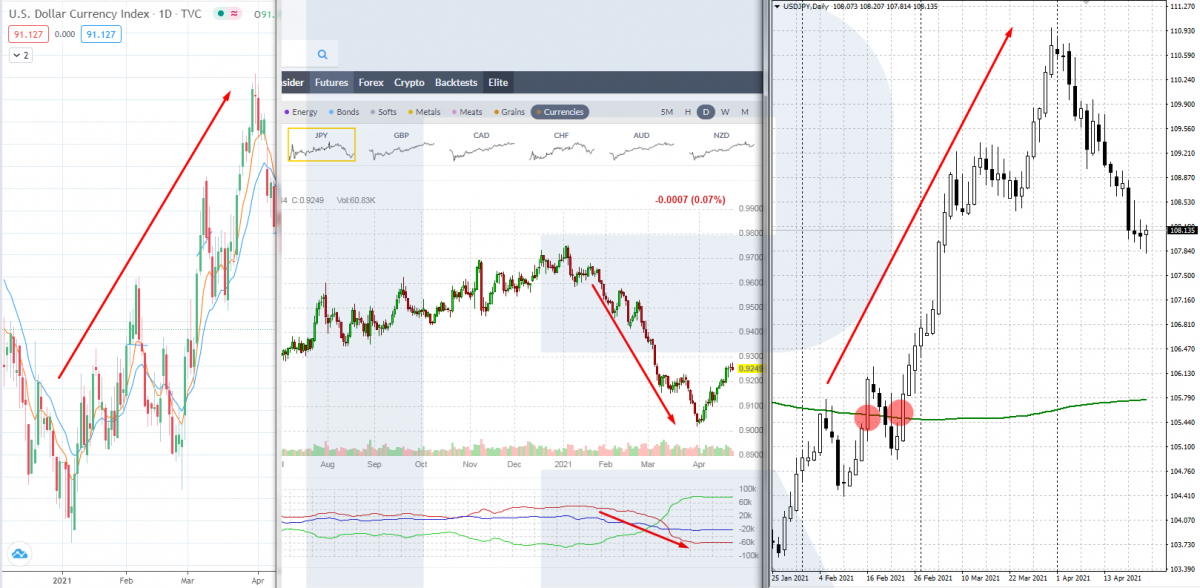
Take a D1 of USD/JPY:
- The chart has risen above the 200-days SMA.
- The DXY demonstrates an ascending move.
- The COT lines on the JPY futures are not at the extreme, the lines of Large Traders set off downwards (sell the yen against the dollar).
- The news is positive, stock markets are growing – this supports the growth of USD/JPY.
All in all, the indicators of the sentiment support an uptrend in the pair; use tech analysis to find entry points for buying positions.
Signals of possible corrections and reversals
When the indicators reach their extremes, or their signals change for the opposite ones, this warns you of a probable correction or reversal:
- The DXY changes direction; reversal patterns might form.
- The COT diagram demonstrates extremes, the lines of Large Traders and Commercial Hedgers demonstrate a serious divergence.
- The price chart opens quite far away from the 200-days SMA, after which it starts the opposite move, closing faster MAs (such as 7, 14).
- News: positive news provokes a positive correction, and negative do correspondingly.
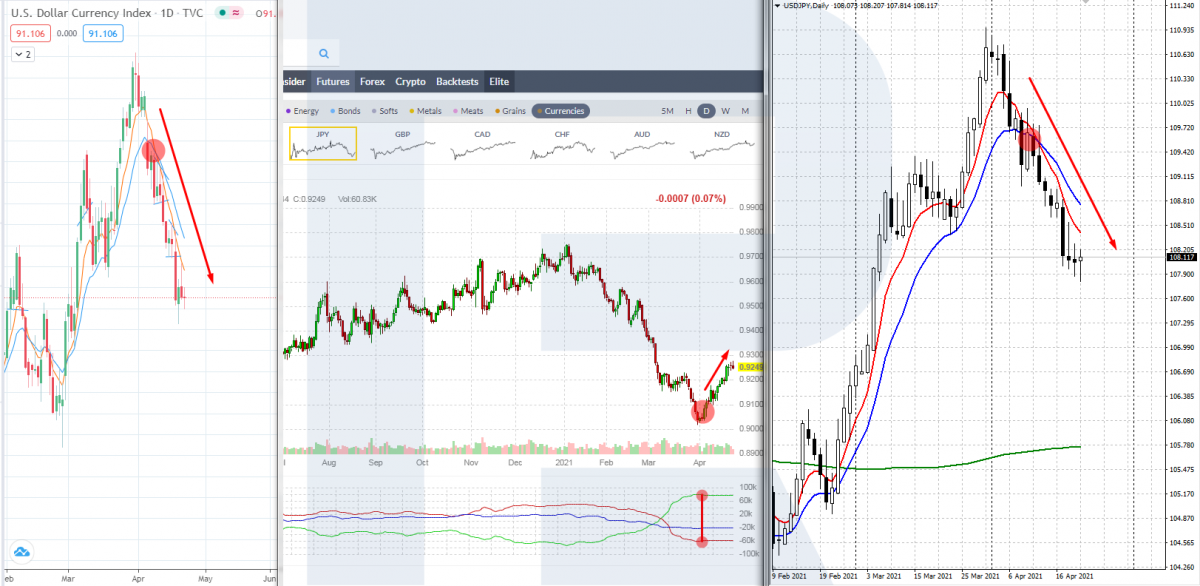
Example:
After a strong ascending impulse on the D1 of USD/JPY, there appeared signals for a possible correction or a reversal downwards:
- The chart of the pair is far away from the 200-days SMA, then crosses the faster MAs (7,14) from above.
- The DXY has reversed downwards.
- The COT lines of the yen futures show the year’s extremes, the lines of Large Traders and Commercial Hedgers have diverged maximally.
- The news is neutral.
The indicators signal that USD/JPY has begun a descending correction. Abstain from buying; you can even use tech analysis to find entry points for short-term sales.
Closing thoughts
Forex market sentiment reflects the prevailing mood of the currency market. By various indicators, you can assess who is dominating the market – bulls (believing in the growth of the currency) or bears (count on its decline). Forex market sentiment is a useful supplement to the rules of fundamental and technical analysis.


