How to Trade Hanging Man and Inverted Hammer?

6 minutes for reading
This overview is devoted to two reversal patterns from candlestick analysis — the Hanging Man and Inverted Hammer. Appearing on the chart, the patterns might precede a correction or reversal.
How do the patterns form?
The Hanging Man and Inverted Hammer are candlestick analysis patterns. Candlestick analysis began in Japan, and Steve Nison, famous trader and analyst, became its active apologet. Being informative and very visual, candlestick analysis is fairly popular among traders.
How the Hanging Man forms
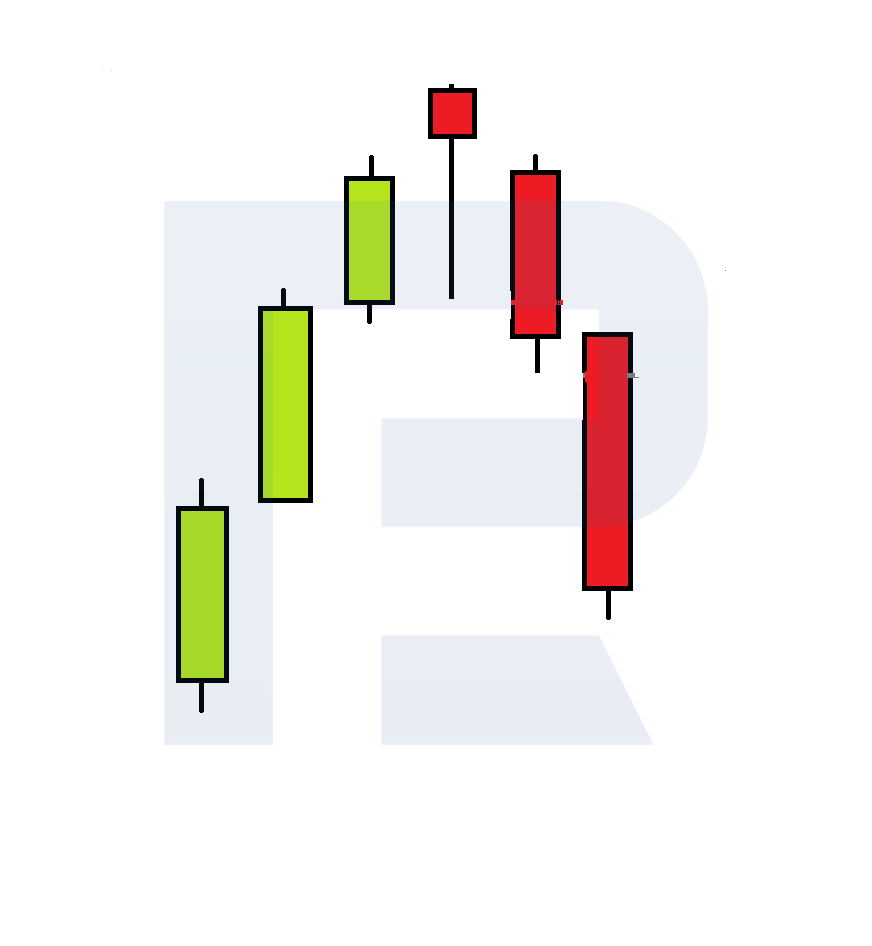
The Hanging Man reversal pattern forms at the price's highs after an ascending movent. The pattern looks like a candlestick with a small body (the color does not matter) with a small upper shadow or none at all — and an extremely long lower shadow, at least double the size of the body. The Japanese must, indeed, have seen the figure of a hanged person in this pattern and thus gave it such a grave name.
The idea of the Hanging Man is as follows. At some point, a massive sale of the asset happens; then buyers try to get the quotations back to the highs, which is indicated by the long lower shadow. A dubious moment comes: bears are active and ready to counter-attack but bulls still have the vigor and hope to win the battle.
The clue to who will win is the manner in which the candlestick following the Hanging Man closes. If this is a bearish candlestick with the close price below the Hanging Man's body, this means the reversal pattern has formed fully, so we may count on further falling. Otherwise, if bulls manage to close the day in their own favor, the pattern is not considered confirmed: the reversal signal is canceled, and the uptrend is likely to continue.
How the Inverted Hammer forms
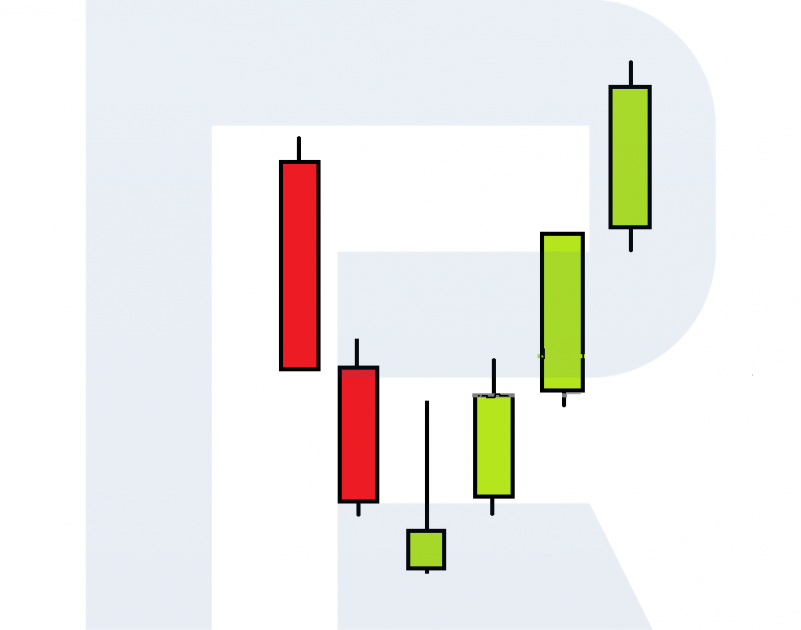
The Inverted Hammer reversal pattern is a mirror reflection of the Hanging Man. It appears at the lows of the price chart in a downtrend. The pattern is a candlestick with a modest body (the color does not matter), with a small lower shadow or no shadow at all — and a very long upper shadow, at least twice as long as the body. It resembles a hammer with its handle looking up, which, naturally, gave the pattern its name.
The pattern works the following way. In a downtrend, active buying bursts out at some point, which is confirmed by the long upper shadow of the candlestick. The market becomes uncertain: bulls try to capture the initiative and reverse the movement upwards while bears are still strong, hoping to get them by their horns.
The efficacy of the pattern is also assessed by the candlestick the follows the Inverted Hammer. If it is bullish, with the closing price above the body of the Inverted Hammer, this means the reversal pattern is complete, and bulls are likely to succeed in drawing the price upwards. However, when a bearish candlestick appears, the pattern is considered invalid, so the downtrend might continue.
Trading the Hanging Man and Inverted Hammer
The Hanging Man and Inverted Hammer are quite universal patterns suitable for various market types: stock, commodity markets, Forex, etc. They are applicable to charts with any timeframe but H4, D1, and W1 prove to work most efficiently. To make performance better, it is recommended to use the patterns alongside trading indicators and support/resistance levels.
The Hanging Man: sales
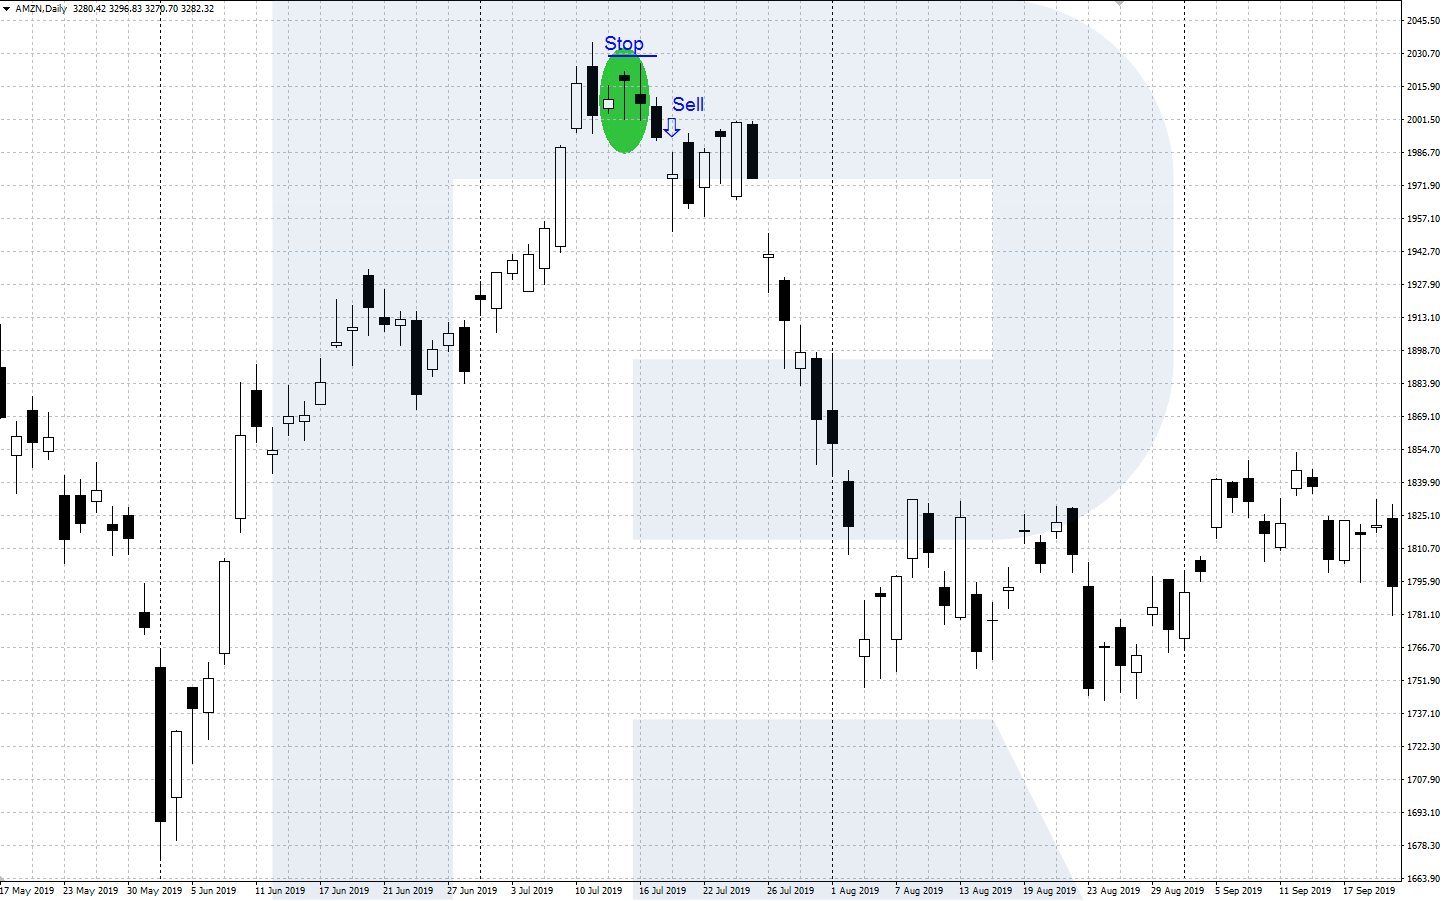
The algorithm of trading is as follows:
- In an uptrend, at the price's high a candlestick with a small body and a long lower shadow forms — this is the Hanging Man.
- Wait for the pattern to get confirmed: the next candlestick must be black, with the Close price below the Hanging Man's body.
- Open a selling position with a Stop Loss at the pattern's high. Take the profit when the price reaches an important support level or when the downtrend starts coming to its end.
The Inverted Hammer: buying
The algorithm of trading looks as follows:
- In a downtrend, at the low of the chart, a candlestick with a small body and a long upper shadow has formed — this is the Inverted Hammer.
- Wait for the pattern to be confirmed: the next candlestick must be bullish, with the close price below the body of the Inverted Hammer.
- Open a buying position with an SL behind the low of the chart. Take the profit when the price reaches a strong resistance area or when the ascending impulse starts winding up.

Bottom line
The inverted patterns called Hanging Man and Inverted Hammer form at the local extremes of the chart in an up or downtrend. Their appearance means an upcoming correction or a reversal. They become more efficient when used alongside tech analysis patterns, support/resistance levels, trading indicators. Before trading for real, backtest the efficacy of the patterns.
Learn about other candlestick patterns in this article:


