How to Use Aroon Indicator in Forex?

5 minutes for reading
This overview is devoted to an oscillator called Aroon. If helps detect the current trend and find entry points to the market.
Description of Aroon
Aroon is a trading indicator that belongs to the group of normalised oscillators. It was designed by a trader of Indian origin Tushar Chande in 1995 for assessing the market trend, whether it is strong or weak.
As long as Chande was born in India, the name of the indicator belongs to Indian mythology: in Sanskrit, Aroon means Charioteer of the Sun God or Light of the Morning Dawn.
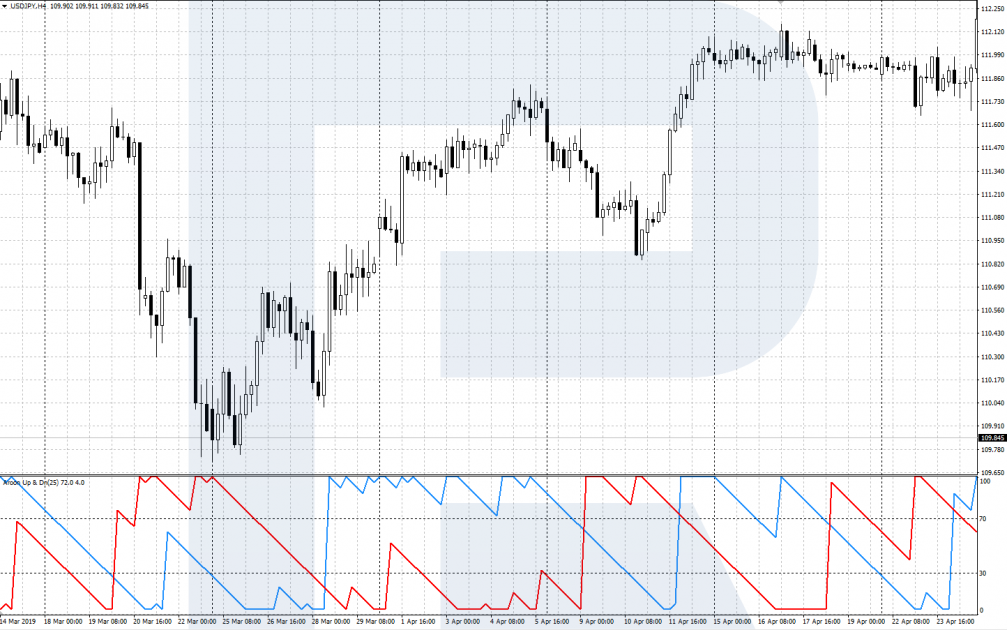
Aroon contains of two main lines: Aroon-Up and Aroon-Down.
- The Aroon-Up line is blue; it assesses from 0 to 100% the ratio of the number of periods (weeks, days, or hours, depending on the chosen timeframe) that have passed since the high appeared on the chart — and the period of the indicator. The less time passes since the last high appeared on the chart, the higher the Aroon-Up line goes.
- The Aroon-Down line (red color) assesses from 0 to 100% the ratio of the number of periods (weeks, days, or hours, depending on the chosen timeframe) that have passed since the low appeared on the chart — and the period of the indicator. The less time passes since the last low appeared on the chart, the higher the Aroon-Down line goes.
The indicator is calculated in a separate window under the price chart. Through levels 30% and 70%, lines are drawn that help detect the current trend. If Aroon-Up goes above 70%, and Aroon-Down drops below 30%, this means the trend is ascending, bulls are dominating.
And vice versa: when Aroon-Up is below 30% and Aroon-Down rises above 70%, the trend is descending, and bears are in control.
Installing and setting up the indicator
To add Aroon to the popular trading terminal MetaTrader 4, ,download the file of the indicator (using the link at the end of the article) and copy it to the Indicators folder. Via the Main Menu, open File/Open data catalogue/MQL 4/Indicators and copy the file of the indicator to this folder. Then restart the terminal.
If the process goes correct, Aroon will appear on the list of user indicator, and you will be able to install it to the chart of the required financial instrument via the Main Menu: Insert/Indicators/User/Aroon. Otherwise, left-click it by the mouth and drag to the chart from Navigator.
The lines are calculated as follows:
Aroon-Up = (P - Nmax) / P * 100%
Aroon-Down = (P - Nmin) / P * 100%
Where:
P is the period of the indicator;
Nmax is the number of periods (candlesticks) since the last high;
Nmin is the number of periods (candlesticks) since the last low.
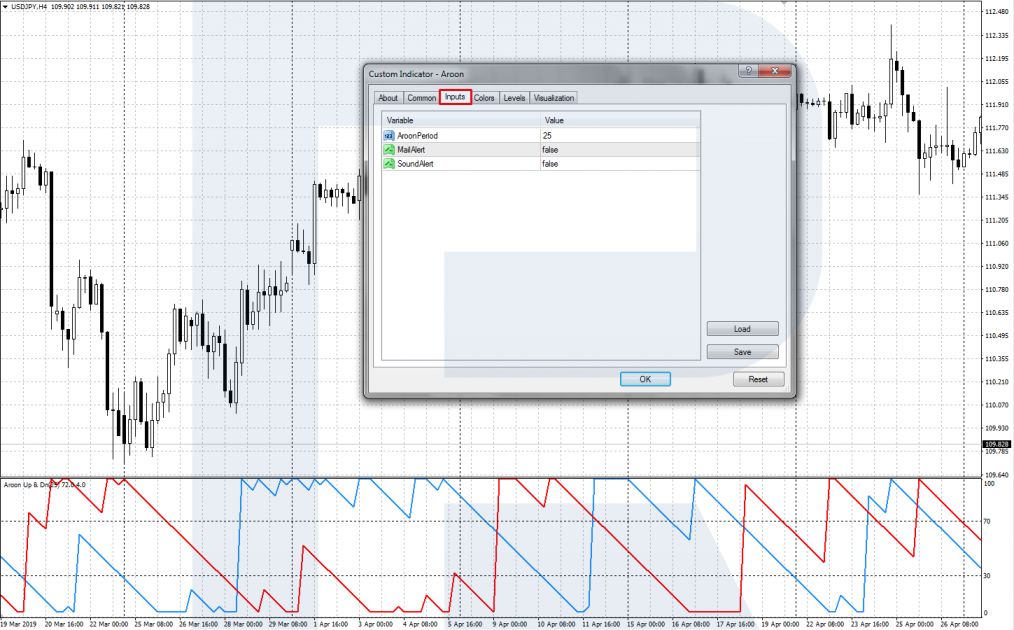
Setting up the Aroon indicator, you can customize the following parameters in Input Parameters:
- AroonPeeiod is the period of the indicator, 14 by default. For longer time frames, the author recommends 25.
- MailAlert informs you by mail about Aroon-Up and Aroon-Down crossing one the other. "False": the alert is off; " True": the alert is on.
- SoundAlert notifies you of Aroon-Up and Aroon-Down crossing by a sound. "False": the alert is off. " True": the alert is on.
Also, in levels, set the levels recommended by the author for detecting the current trend: 70% and 30%.
Trading with Aroon
Aroon is used in trading to define the current trend, but it can also give its own signals.
Defining the trend
The position of the lines in relation to each other and the signal levels help determine the actual trend.
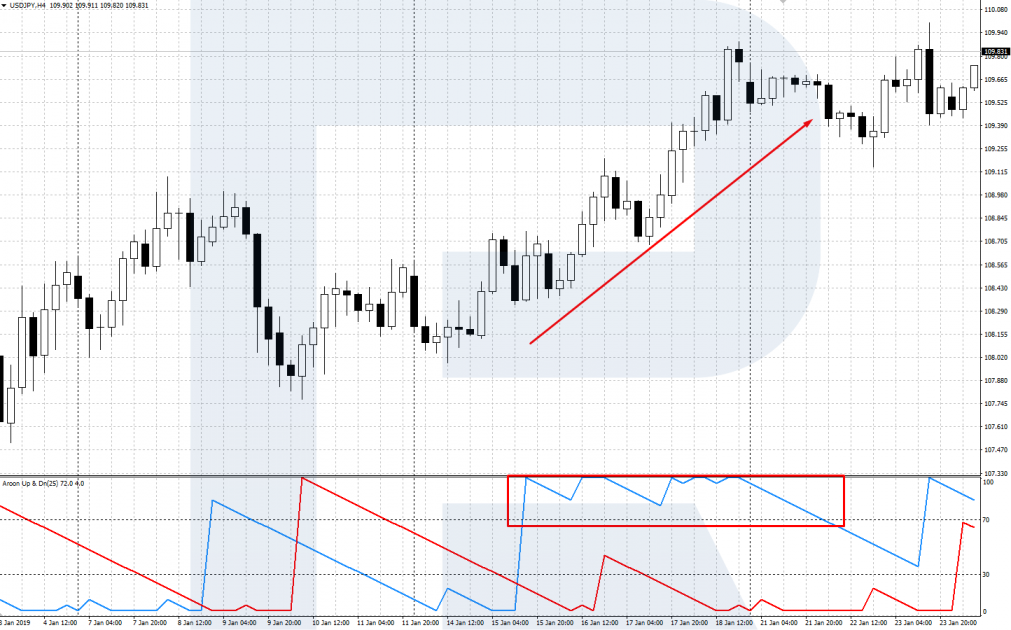
Uptrend
In an uptrend, the ascending trend line Aroon-Up (blue) rises above 70% and remains in this area, sometimes reaching 100%. The Aroon-Down line (red) drops below 30% and remains there, demonstrating 0% from time to time. In an uptrend, it is recommended to find entry points to buys.
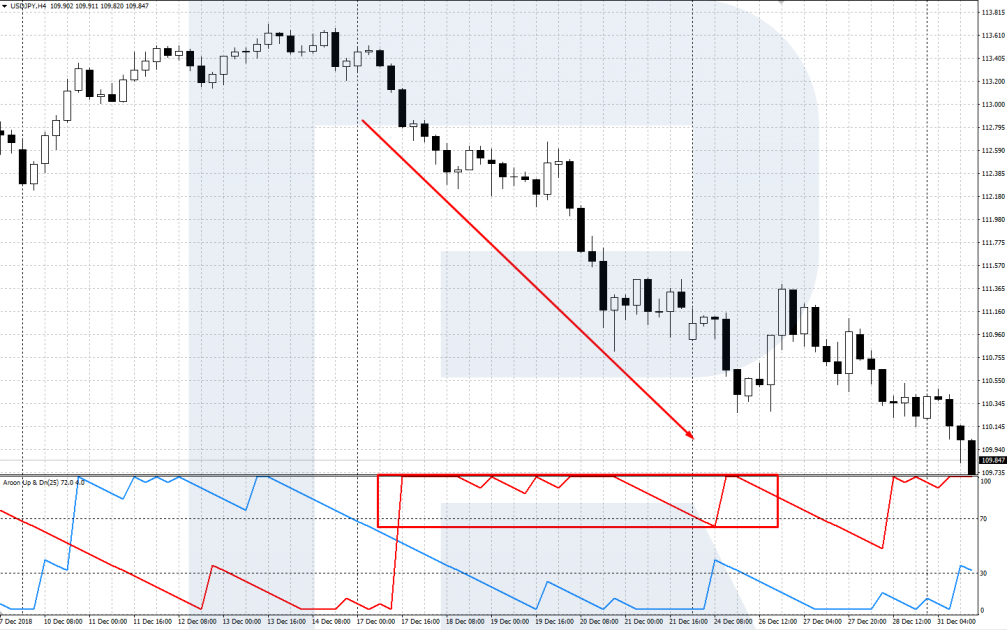
Downtrend
In a downtrend, Aroon-Down (red line) rises above 70% and remains there in a strong descending trend, sometimes showing 100%. Aroon-Up (blue line), on the contrary, drops under 30% and rests there, sometimes showing 0%. In a downtrend, look for opportunities to sell.
Crossing of indicator lines
The main trading signal of the indicator is the crossing of Aroon-Up and Aroon-Down between 30% and 70%.
Signal to buy
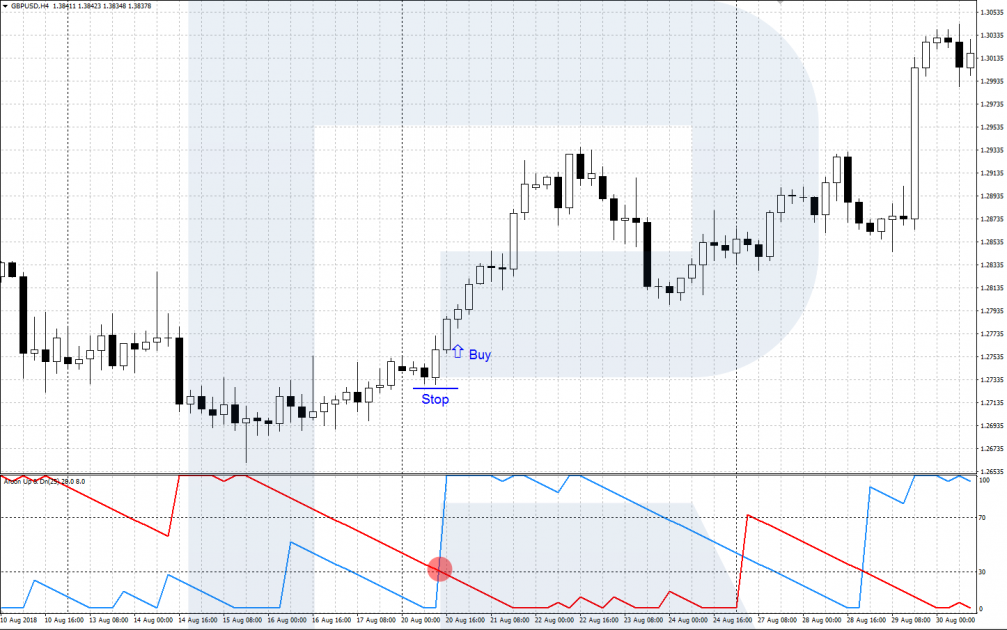
A signal to buy forms when Aroon-Up (blue) escapes from under 30% and crosses the Aroon-Down (red) line, descending from above. An ascending movement begins. Place a Stop Loss behind the local low and take the Profit when the price reaches an important resistance level or when the lines cross vice versa.
Signal to sell
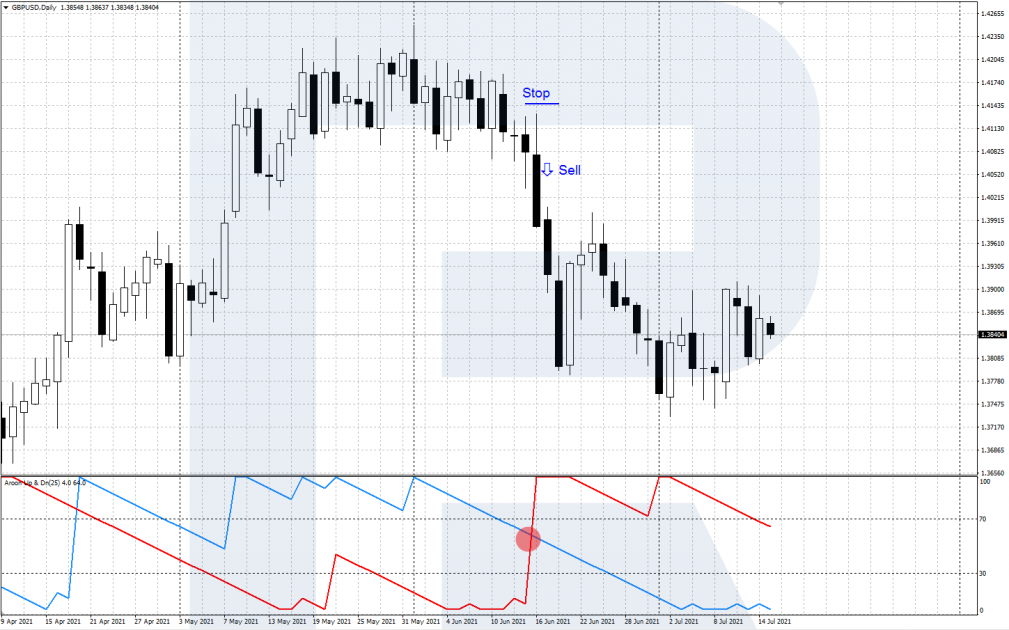
A signal to sell appears when Aroon-Down (red line) escapes from the 30% area and crosses from below the descending Aroon-Up (blue line). This indicates a downtrend. Place an SL behind the local high and take the Profit when the price reaches an important support level or when the lines cross vice versa.
Closing thoughts
The Aroon indicator, created by an Indian trader Tushar Chande, helps detect the prevailing market trend. Also, it gives its own trading signals that should be used alongside classic methods of tech analysis, price patterns, Price Action for more reliability. Before you start trading for real, practice on a demo account.


