What Bond Market Tells Us
9 minutes for reading
On 21 September, the US Federal Reserve System had a meeting at which they decided to lift the interest rate by 0.75% to 3.25%. This was not an unexpected event: after the latest inflation report, it became clear that the Fed would take aggressive measures.
Some more important information market participants got from the comments of the Fed’s head Jerome Powell on the next actions of the regulator. From his speech, it became clear that by the end of 2022, the interest rate might grow by 1.25% more.
Clearly, stock indices reacted to the event by a decline. When the cost of crediting grows and the Federal Reserve System carries out the QT policy, it becomes extremely hard for businesses to keep growth of earnings positive. As a result, stocks of companies are likely to continue negative dynamics until the QT cycle ends.
What to do in such circumstances? Which financial instruments do market players keep an eye on? To put it short, take a look at bonds.
Why does growth of interest rate affect stock indices adversely
Let us study this issue on the example of the S&P 500 index. It should be said from the start that the correlation of the index and the interest rate is not 100%: the quotes of the S&P 500 used to grow even when the rate was also growing.
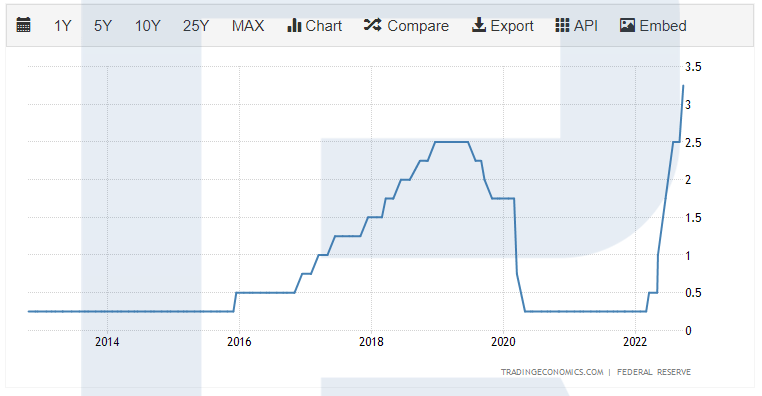
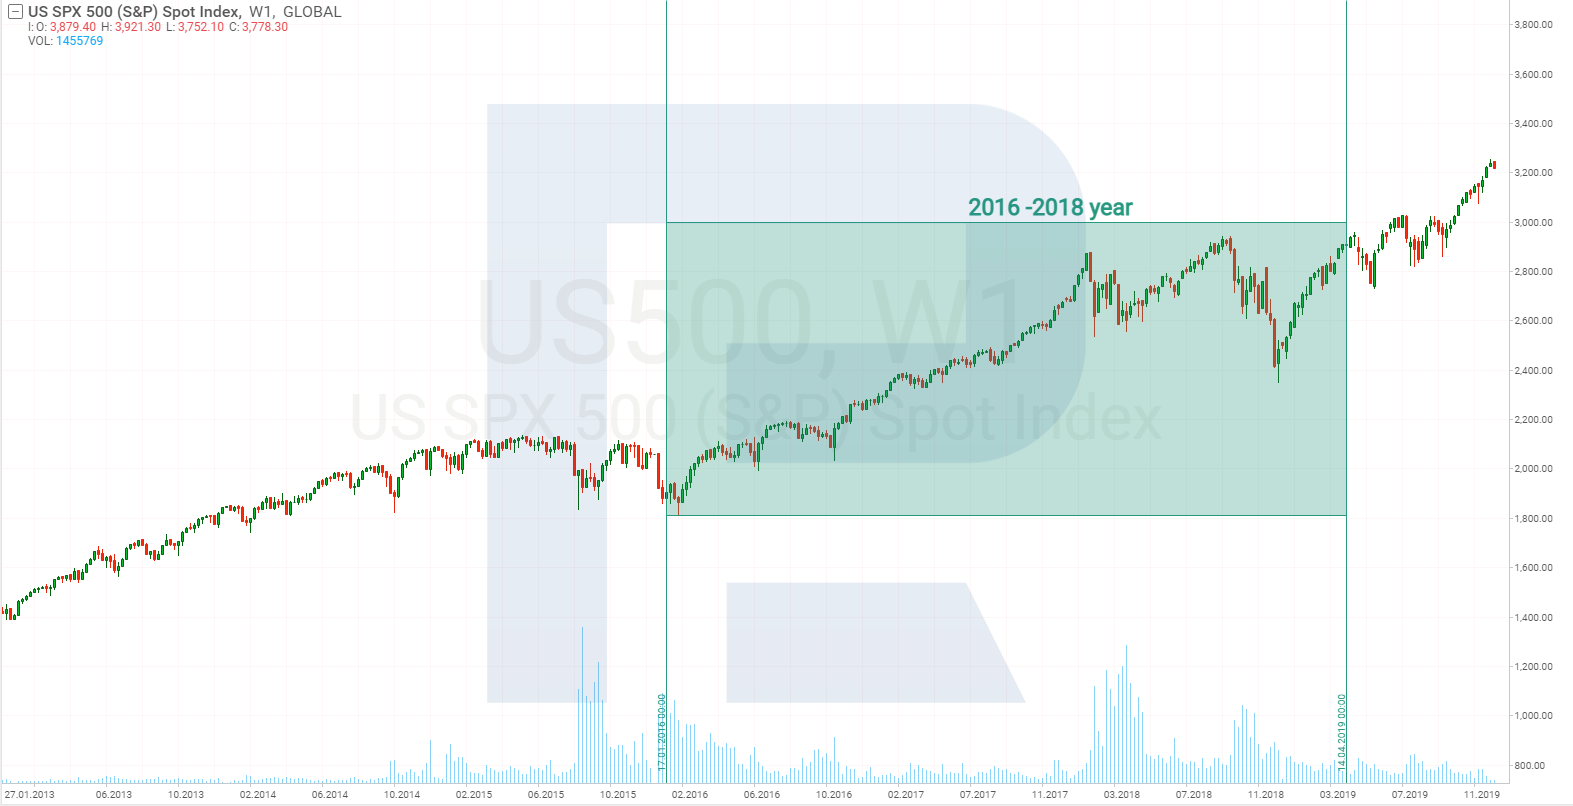
The stock index normally falls at the turning points when the Fed starts a cycle of toughening the credit and monetary policy. At such moment, loans for business become more expensive, and business needs time to adapt to new conditions.
However, when the Fed increases the rate at every meeting, and the size of each increase is hard to forecast, business cannot plan expenses for a longer time. Companies have no idea of how big the interest rate will be in a year, and under which interest they may attract finance.
Moreover, the growth of the interest rate depletes the purchasing power of consumers, which, in turn, negatively affects the consumer demand. This, again, drops the income of companies, in the end provoking a decrease in their stock prices.
When the Fed signals the end of the cycle of increasing the interest rate, businesses and consumers start assessing their spending and income, looking for ways to save up and ways to increase earnings. In other words, at such moments, companies secure their position in the market and study perspectives for growth.
As for now, there is no understanding of how long the cycle will take and how much the interest rate may grow. The situation becomes even more complicated because of the necessity to care for such a parameter as Quantitative Easing (QE) vs Quantitative Tightening (QT).
How QE and QT influence stock markets
Let us find out what are Quantitative Easing and Quantitative Tightening and how these two types of monetary policy influence the stock market.
Quantitative Easing
The Central Bank buys bonds, provoking increased demand for them. When the demand is high, the interest on bonds is minimal. In the end, companies get cheap money that they can use for development.
And now imagine that a company sold some bonds and made 1 million USD on this. This money can be spent on wages for employees, new production powers, etc.
In other words, the company creates demand for goods and services of other enterprises. During QE, earnings of companies start to grow, quarterly reports are strong, and investors buy stocks.
Quantitative Tightening
QT deteriorates financial performance of companies because the CB asks for payments for the bonds bought previously and significantly cuts down on the sums meant for buying new debts. As a result, companies have to drive money out of turnover or take new loans to pay back earlier ones.
And as long as the main buyer of bonds – the CB – has seriously decreased the volumes of new bonds bought, the interest on bonds starts growing. This makes companies cut down on the expenses on modernisation, research, and employees. As earlier the CB had no special requirements to the issuers of bonds, unreliable companies could easily make debts. So, in QT they might claim default and even go bankrupt.
On the one hand, this cleans out the market so that only the strongest companies survive; on the other hand, the number of companies that create demand for goods and services decreases, which negatively affect earnings of other issuers.
Currently, the market is at the beginning of a QT cycle alongside further growth of the interest rate, which is naturally quite a hard time for businesses.
What market participants are interested in
For market players, it is extremely important to know the final size of the interest rate and the length of the QT cycle. For now, the interest ate is forecast to reach 4.6% in 2023. As you know, previously the high of 4.4% was forecast for 2022.
A decrease in balance, i.e. the QT, started in May and is still on, but the very sales of bonds by the CB began in September. Previously, the Fed was more delicate. It stopped pouring new money in the system, still buying bonds but in smaller volumes, taking money from the coupon income from the already held securities and from old bonds being paid off.
Expectations of investors and profitability of bonds
If during QT the return on bonds grows, why not consider investing in bonds and making a coupon income? Moreover, if their price grows, one could make money on selling bonds as well.
Unfortunately, the best time for work with bonds was the beginning of the QT cycle. Currently, market players are busy trying to forecast when and where the growth of the interest rate will end. After that, their expectations will include economic stimulation and a decrease in the rate.
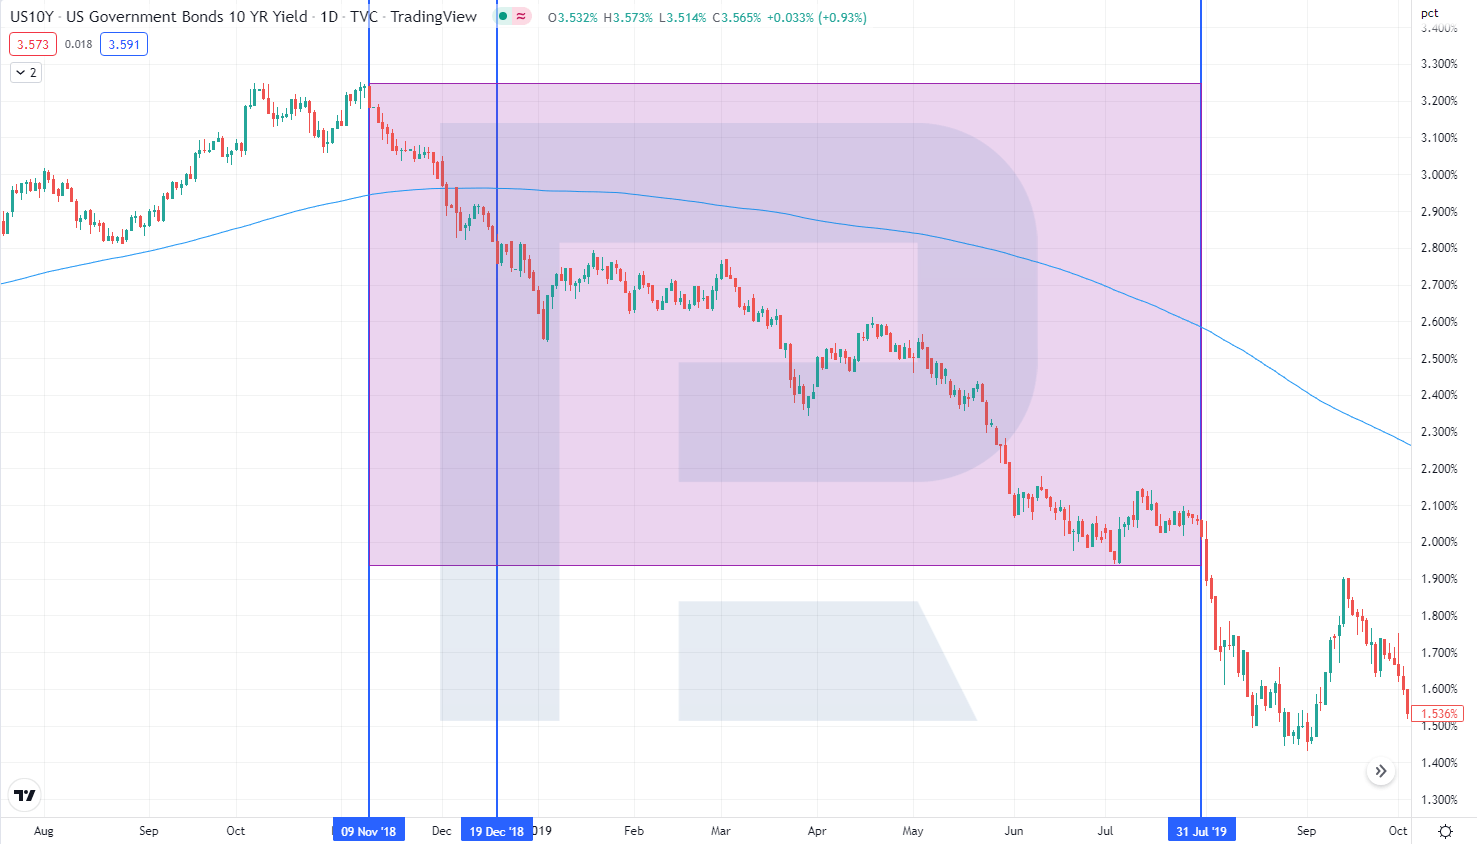
This season is nowhere close; let us see, however, when in the past the market started accounting for the decrease in the interest rate. As an example, let us take 10-year treasury bonds. The latest increase in the rate happened in December 2018, and it started declining in July 2019.
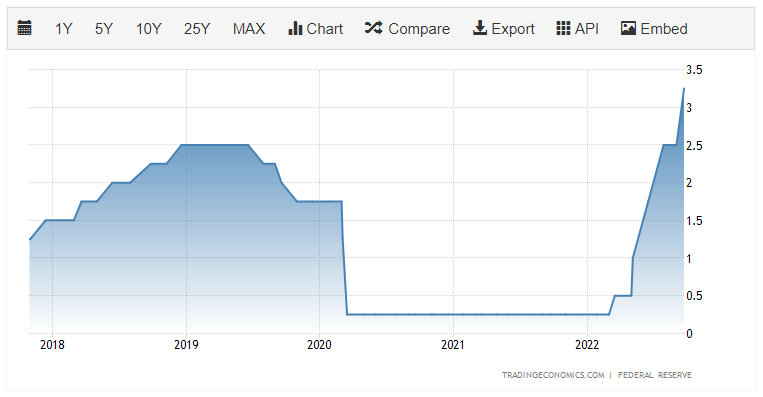
Bonds reached the highest profitability in November 2018, and then it started declining. This means, market players started acting 9 months before the Fed’s decision.
As was said above, the interest rate is forecast to reach the high in 2023 but the exact month remains unknown. However, after one or two more meetings of the regulator the forecasts will become more exact; hence, it is time to get prepared for changes in the monetary policy.
What might happen when the end of the QT cycle will become known? Firstly, the S&P 500 will most probably stop the decline, reaching the bottom from which it will start growing. Secondly, the return on bonds will start falling, analysts say.
Why return on bonds might fall
Most probably, investors will try to take maximum profits from bonds, i.e. the demand for them will grow. And when the demand grows, the return on bonds normally falls.
Here is a simple example. The same hypothetical company needs to attract 1 million USD by selling bonds. Based on market conditions, it offers investors 4% annually. Trades start, and the management sees that there are too many potential buyers, and decreases the rate. Why pay more if the company can loan money under smaller interest because the number of those willing to let the money exceeds expectations.
Out of all said above, two investing ideas emerge: the first one is to invest in the S&P 500 and the second one is to invest in instruments connected with return on bonds.
ETF on US treasury bonds
The world’s most liquid bonds are US treasury bonds. In the stock market, there are ETFs that track the investing results of the index consisting of treasury bonds.
Such ETFs are iShares 1-3 Year Treasury Bond ETF (NASDAQ: SHY), iShares 3-7 Year Treasury Bond ETF (NASDAQ: IEI), iShares 10-20 Year Treasury Bond ETF (NYSE: TLH), iShares 20+ Year Treasury Bond ETF (NASDAQ: TLT), and more.
What is the peculiarity of such instruments? For example, investing in iShares 10-20 Year Treasury Bond ETF, an investor receives monthly coupon income in the form of dividends. The latest payment of the fund happened on 5 September and amounted to 0.28 USD per stock.
The stock price of the fund has an inverted correlation with the bond yield, which is quite obvious on the chart below.
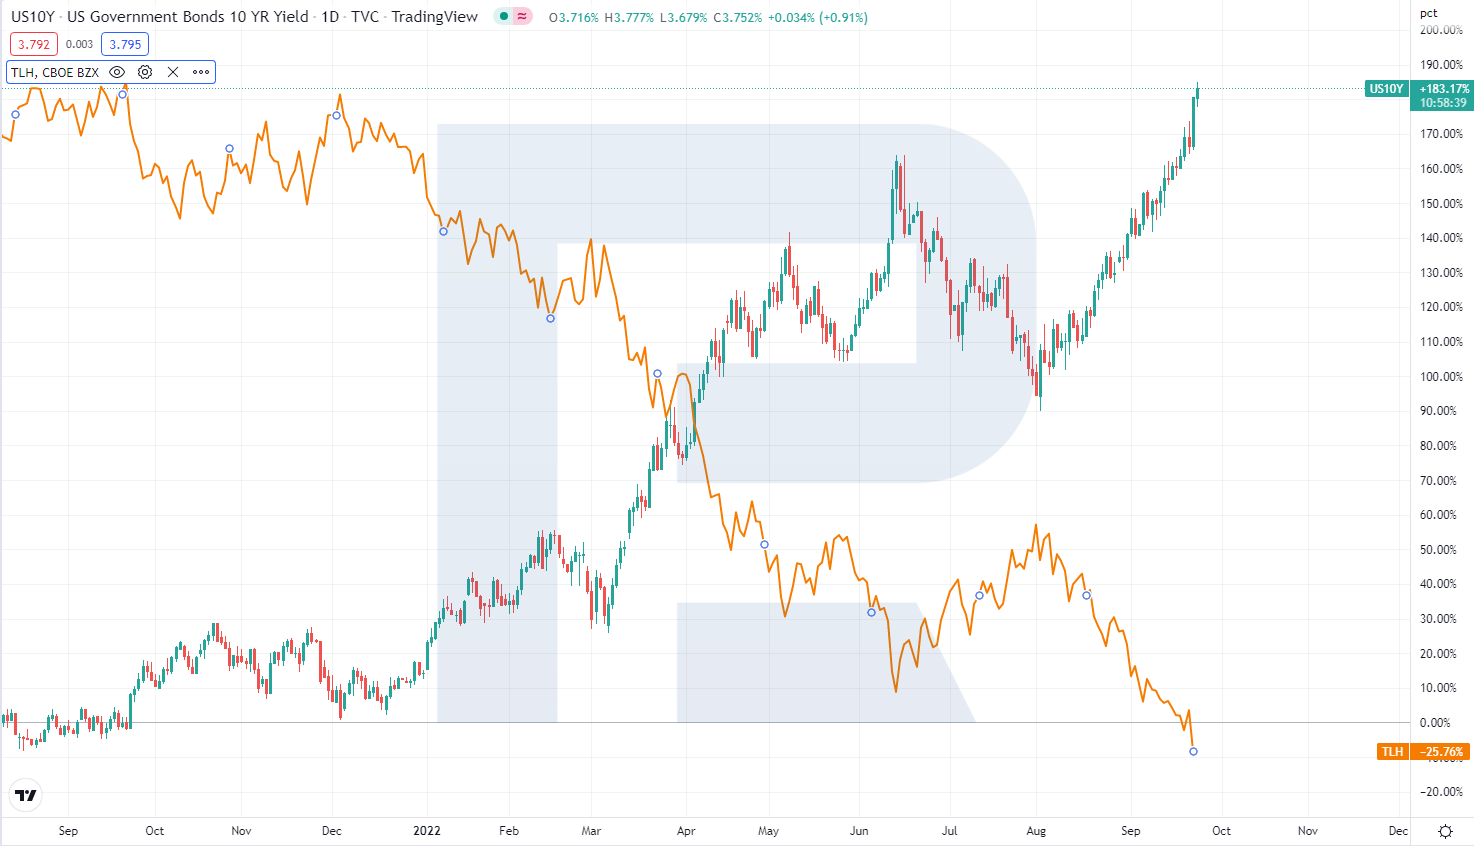
If the return on bonds starts to fall, the price of the stocks above will be growing. Now we have to decide about the hardest part: namely, as to when the QT cycle ends.
And while the interest rate is growing, ProShares Short 7-10 Year Treasury ETF (NYSE: TBX) looks worth attention because it correlates with the return on bonds. However, first take a look at the profitability chart of 10 year treasury bonds (US10Y) and the interest rate values.
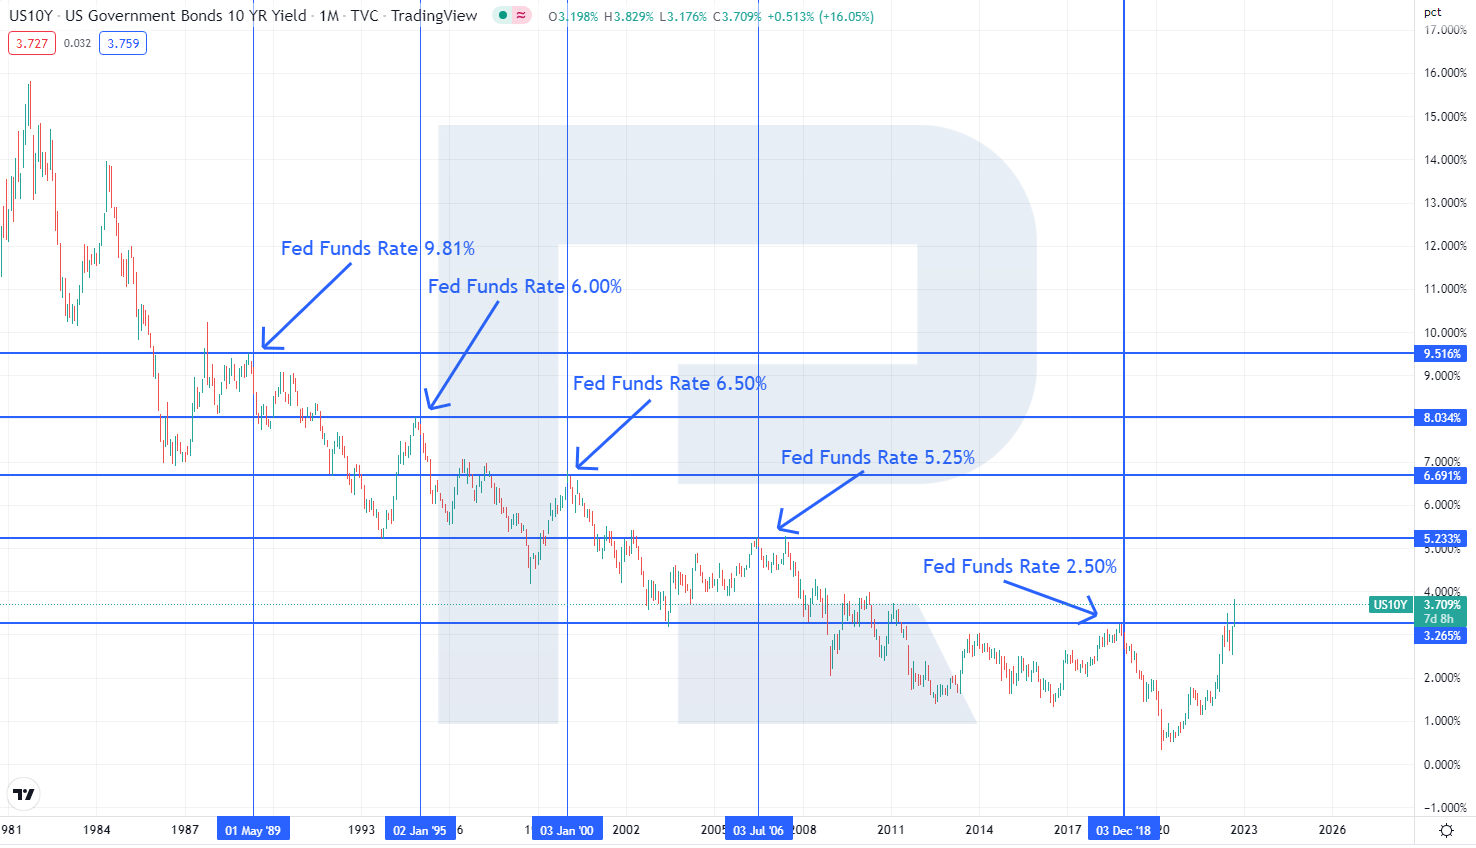
On the chart, you see the interest rate high over a certain timeframe and the bonds yield over the same time. As an example let us take the moments when the rate reached the high and then started falling.
Out of 5 cases, only in 1989 the interest rate was higher than the return on bonds. If the interest rate is forecast to reach the high of 4.6% in 2023, the profitability of US10Y might rise from the current 3.72% to 4.6%. And as long as ProShares Short 7-10 Year Treasury shares correlate with US10Y, they also have a potential for growth.
Bottom line
Market participants live on expectations, hence volatility grows sharply when real results do not meet forecasts. All eyes are now glued to the credit and monetary policy because the depression of indices depends on it.
No one knows when the turning point happens. But when it does, it is important to understand which instruments are worth attention first hand.


