What is a Stock Market Index and How to Trade It?
6 minutes for reading
Many beginner traders on Forex think that it is only possible to trade currency pairs. There are many more trading instruments than it seems at first glance. In trading terminals, all the time appear new instruments, which might be underestimated by new market players.
Currently, a trader can always select an instrument that perfectly suits their tastes and preferences: those might be currency pairs, CFDs, futures, or indices. Today, we are going to speak about indices and how to use them in trading.
What is a stock market index?
A stock market index is an index of the average price of a certain set of instruments, such as stocks of different companies, united in one group. Indices are calculated by various rating agencies and organizations by various formulae, such as a simple average price, weighted average price, etc. However, there is no need to learn the formulae as you will not have to calculate the indices yourself.
Popular indices
Each exchange features its own set of indices for trading, the most popular ones being:
- The Dow Jones index. This index unites the stocks of 30 biggest companies. By the way, this one is among the first indices that have been calculated and used in trading.
- The next popular one is the S&P 500 (Standard&Poor's) index. As might be guessed from the name, there are 500 companies in this index. It suits beginner traders perfectly because it has excellent liquidity and volatility. What is more, the S&P 500 reacts to the movements of individual companies rather calmly as there are so many stocks used in the formula.
- The NASDAQ 100 index unites the stocks of 100 largest companies traded on the exchange with the same name.
On European exchanges, the most popular indices would be:
- The DAX 30 index. It features the 30 largest companies in Germany.
- CAC 40 is a French index, uniting 40 of the biggest French companies.
- FTSE 100 is a British index, calculated for 100 companies with the biggest capitalization.
Asian market:
- Nikkei 225 is an index of the Tokyo stock exchange, calculated for 225 companies.
- Shanghai Composite is an index of the Shanghai exchange.
Trading indices
The chart of an index does not differ from the chart of any other trading instrument, though many traders keep searching for some peculiarities. In reality, indices are no more difficult to trade than, say, CFDs or currency pairs. Indices can be analyzed by virtually any indicator, technical or candlestick analysis. Fundamental data is also worth paying attention to, but in the case of trading indices, you will have to track different sources and analyze lots of information.
There is nothing supernatural to it, fundamental analysis simply requires a somewhat specific approach to the data. The growth of indices means that the stocks of the companies it contains also grow and strengthen, while if the index declines, the companies are not doing very well.
Using tech (graphic) Fibo analysis
Indices, as well as other instruments, sometimes form certain patterns of graphic analysis on the charts, and such patterns may be used for entering the market. Only, you have to pay attention to the working hours of the exchange which your index is traded on. Keeping in mind that the exchange does not work 24/7, gaps are likely to form on the chart, and they can sort of correct the formation process of the patterns.
In the case of intraday trading, such gaps play no critical role; the best timeframes would be from M5 to M30. This will let you carry out your analysis on a large number of candlesticks almost without gaps. The easiest patterns to define are the Flag, Pennant, Head and Shoulders, and their inverted versions. Stock indices sometimes react very abruptly on the news, that is why beginners should abstain from trading during the first 30 minutes of work of the exchange.
Trading support and resistance levels
The next popular option of trading indices is following bounces off the key support and resistance levels. There are several variants of trading support and resistance levels, but we shall discuss a complex approach using reversal candlestick patterns, such as the Hammer, Hanging Man, Inverted Hammer, Shooting Star, Doji, and Engulfing.
Bounces off the levels may be searched for on any timeframe, and the gaps emerging at the opening of the session will not have any critical influence. However, the risks of mid-term trading should be kept in mind. A Stop Loss that gets into a gap will be closed at the worst possible price.
The entrance points of the S&P 500 index
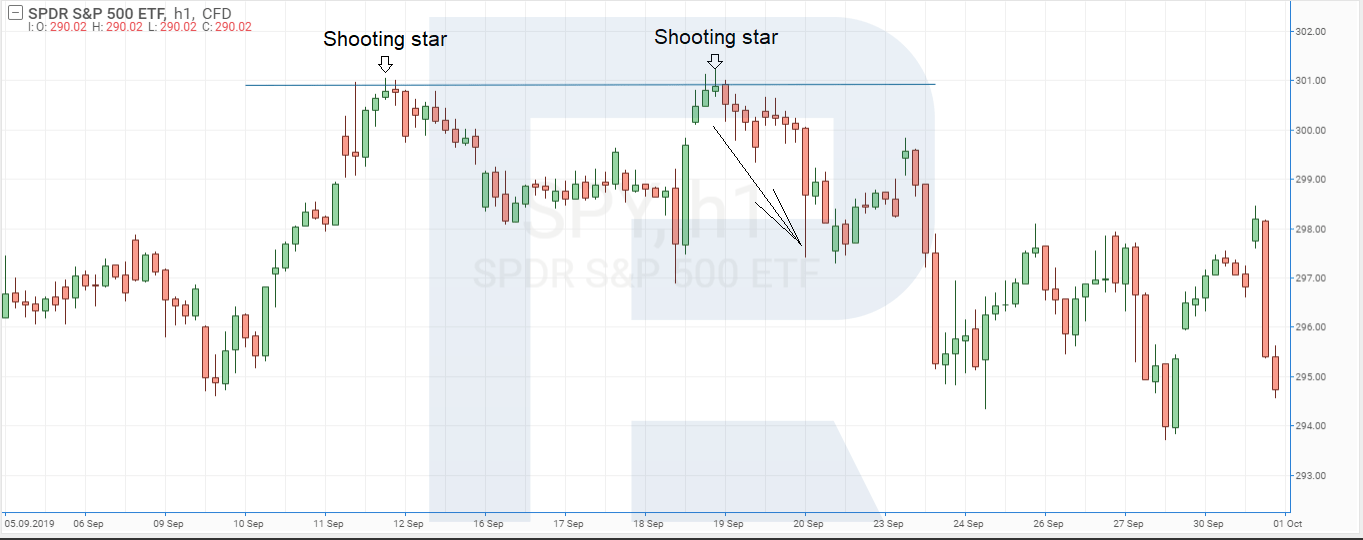
On H1, we can see the S&P 500 index (the ticker in the terminal is SPY). Let us draw the support and resistance lines. The bigger has been the price near a certain value historically, the stronger this level is considered and the higher the probability of a bounce (a breakaway is not excluded either). The price neared the key resistance level and formed a reversal pattern Shooting Star for the first time; then the signal was executed and the index went down, letting the trader earn several points.

Sometime later the price approached this level again and upon testing it formed a Shooting Star again. The trader managed to execute a selling trade again according to the rules of trading candlestick patterns (the Stop Loss was put behind the maximum of the signal candlestick). In this case, the risk to the potential profit ratio was below 1:4 again.
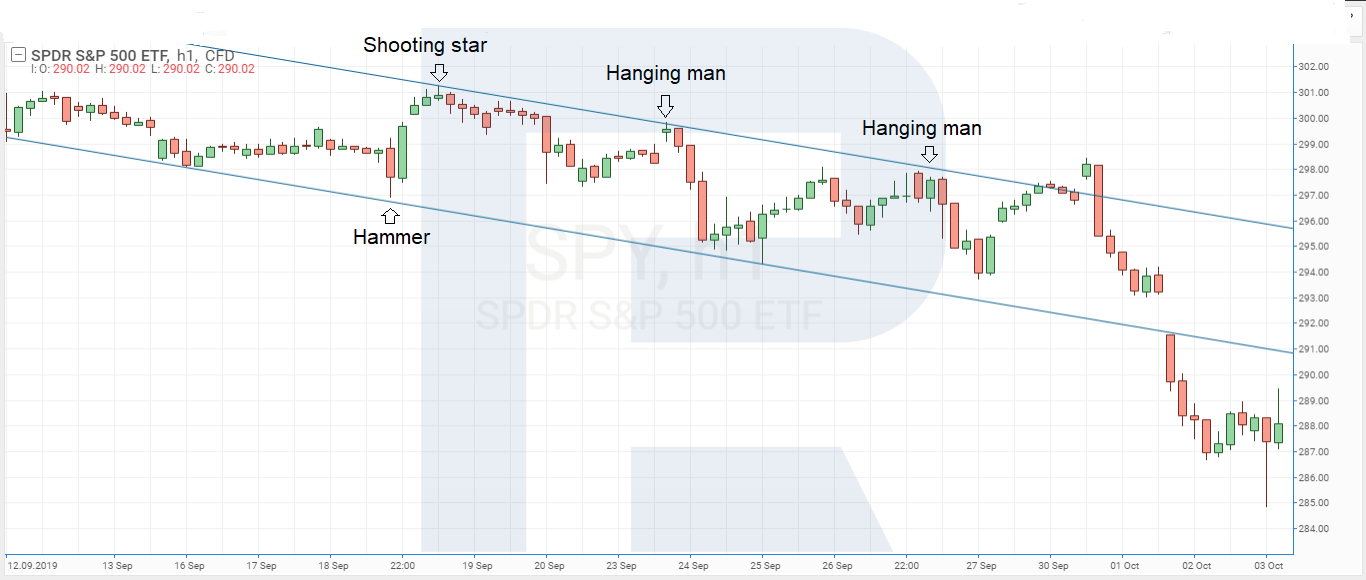
This trading strategy can be somewhat modified: we can use channels, if they are present on the chart, instead of the horizontal support and resistance lines. In such a case, buying should be executed from the lower border, while selling — from the upper border of the channel. Keeping in mind the fact that indices normally move in one direction for a long time, trading the trend is recommended. Positions counter the trend will make less profit and are riskier.
Summary
In this article, we have discussed several popular indices and some trading options. It is rather hard to describe all trading strategies applicable to indices in one article. Indices have certain peculiarities, but analysis and comparison will be enough for a trader to make up their mind about a suitable instrument.
Thanks to indices, the assortment of trading instruments has extended significantly. What is more, thanks to the development of companies and the constant (though modest) growth of the stocks, most indices are moving in an uptrend. Trading the trend may be more profitable in the perspective than trading counter it.