How to Trade the "Moving Averages Based on Fibonacci Numbers" Strategy

4 minutes for reading
In this article, we will look at a medium-term indicator trading strategy using multiple moving averages based on Fibonacci numbers. We will find out which indicators to set and talk about the rules for making trades.
You can visit the RoboForex Market Analysis webpage for the latest forex forecasts.
How the strategy works
Fibonacci numbers originated with the famous Italian mathematician Leonardo of Pisa, who was better known as Fibonacci. He investigated an infinite mathematical sequence that was later named after him. In it, each successive number is equal to the sum of the previous two numbers: 0, 1, 1, 2, 3, 5, 8, 13, 21, 34, 55, 89, 144, and so on.
Dividing the previous number in the sequence by the next number gives 0.618. Dividing the previous number in the sequence by the next number through one produces 0.382. The golden ratio is based on this relationship. With the advent of exchange trading, the Fibonacci sequence began to be used in trading. Various tools based on Fibonacci numbers can be found in almost any trading platform.
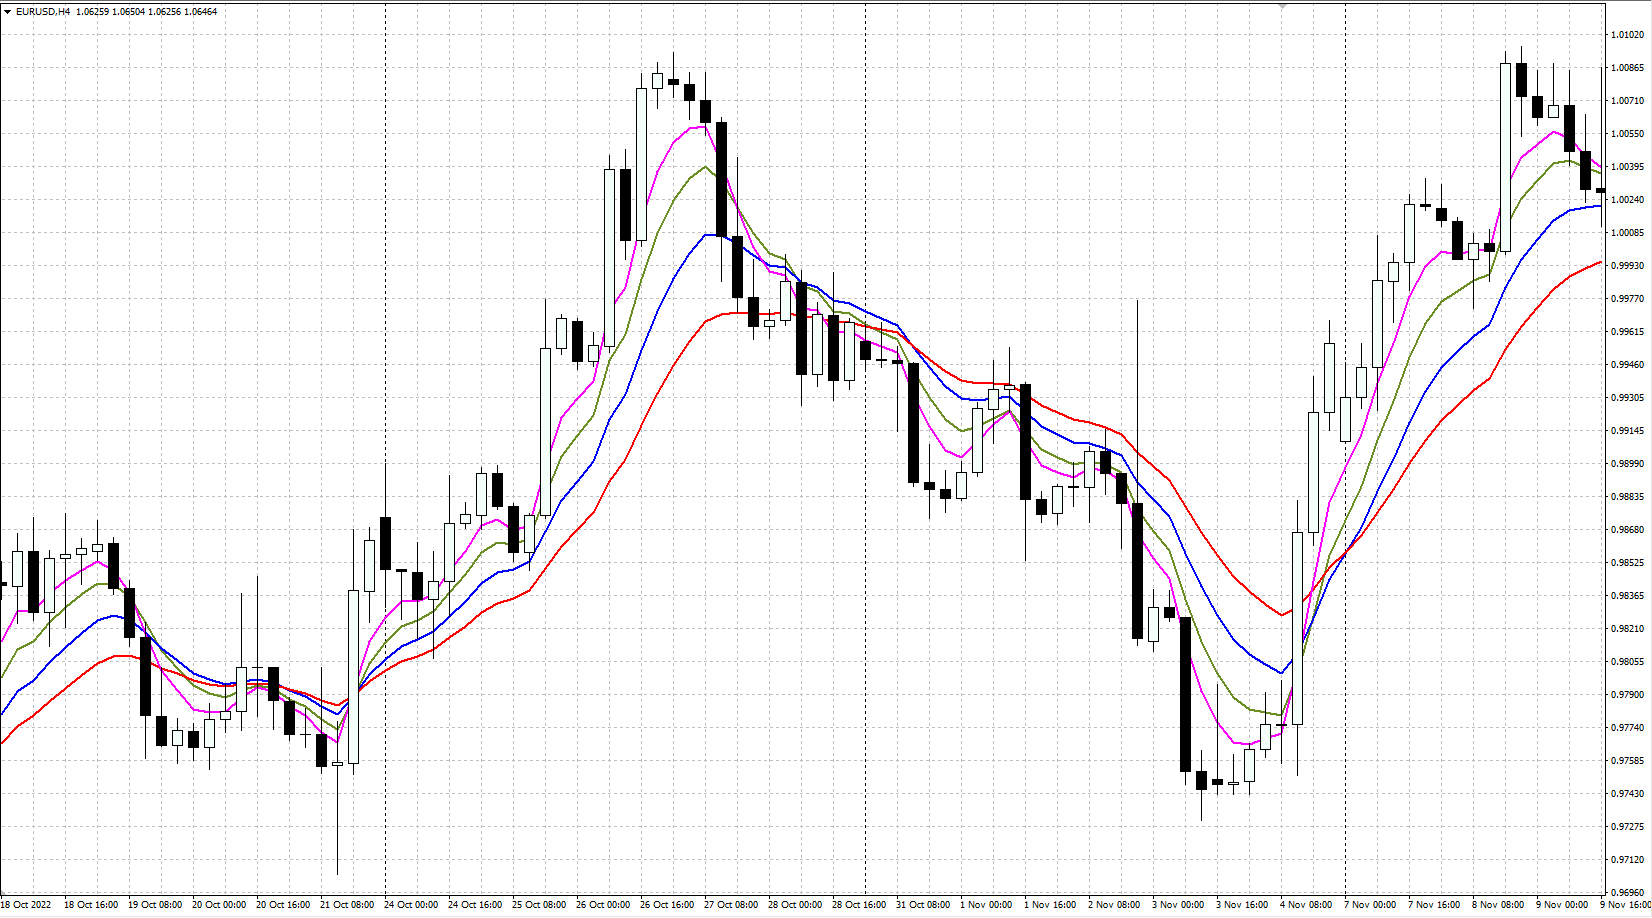
This strategy uses the intersection of four exponential moving averages (EMAs) with periods corresponding to the Fibonacci numbers (5, 8, 13, 21) to find trading signals. Moving averages have long established themselves as a simple and effective tool for trend analysis.
When all four moving averages are moving horizontally and intertwined, this is a sign that the market is in a sideways corridor and there is no clear trend. When the price is rising and indicator lines begin to diverge and move upwards, this signals the beginning of an uptrend. When the price decreases and the indicators diverge moving downwards, it indicates the beginning of a downtrend.

How to install the Moving Average indicator
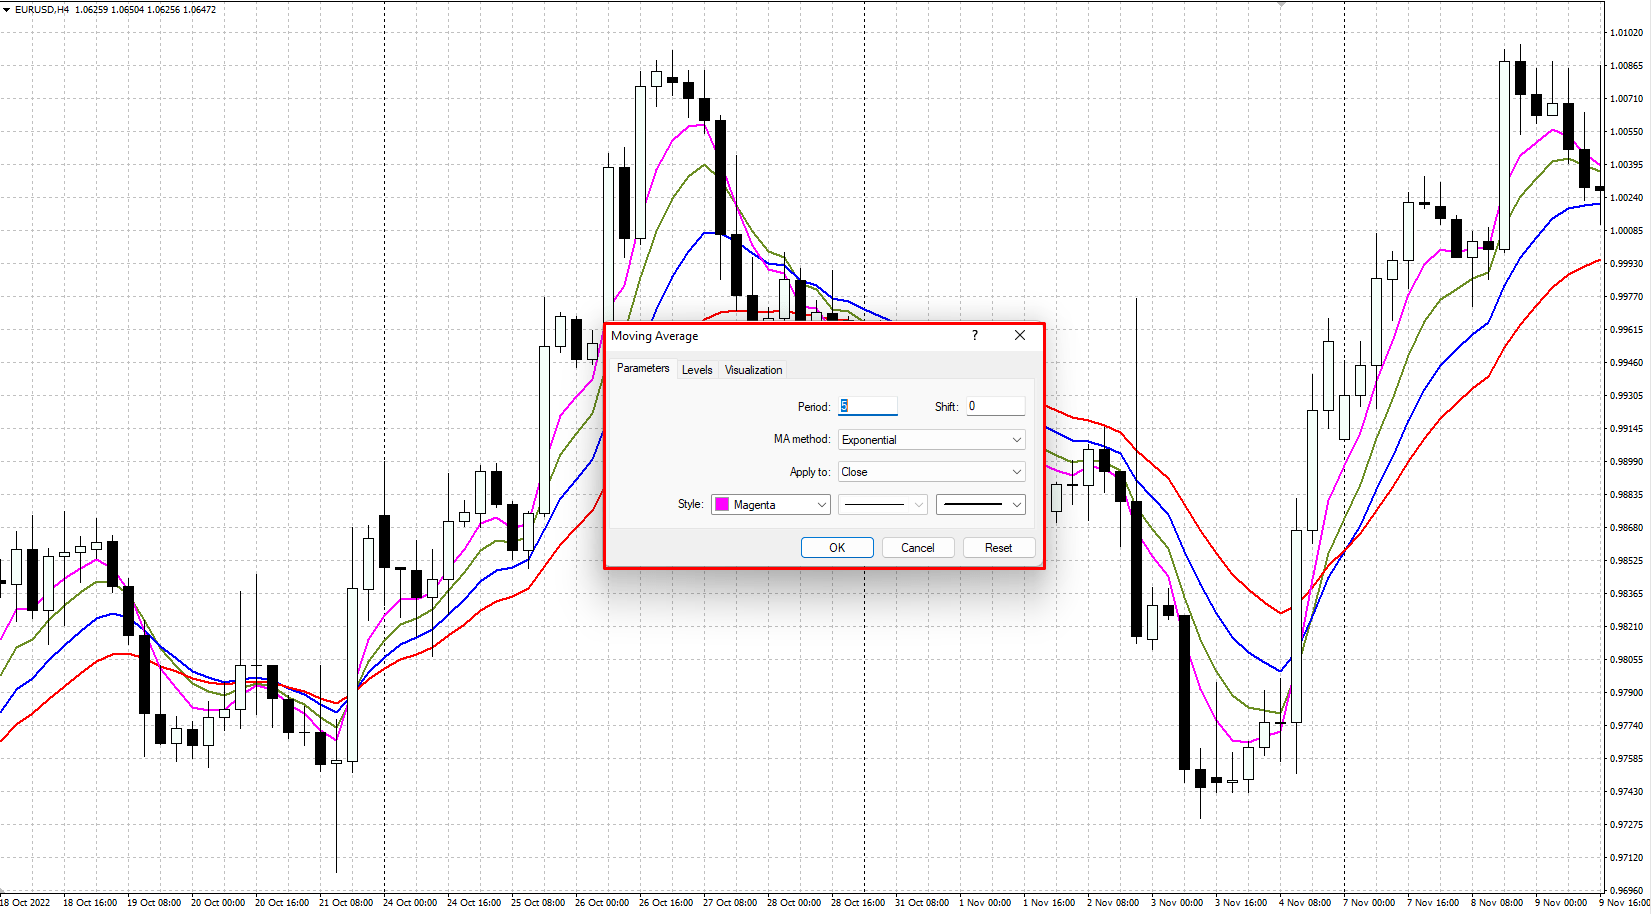
The Moving Average indicator is included in most modern trading terminals, displayed directly on the price chart. In the popular MetaTrader 4 and MetaTrader 5 trading platforms, you can install the Moving Average on the chart of the selected instrument through the Main Menu: Insert → Indicators → Trends → Moving Average.
In the window that appears, select period 5, colour and thickness of the line, and method MA: Exponential. Repeat these steps to set up three more moving averages with periods of 8, 13, and 21, selecting different colours for the indicator lines. This will result in four differently coloured moving averages on the price chart, which will be used to search for trading signals according to the strategy.

How to use the “Moving Averages Based on Fibonacci Numbers” strategy in trading
This strategy is quite versatile and can be used on different timeframes and financial instruments. To trade, you have to wait for the price to move up or down out of the sideways range. In a sideways range, all four moving averages are intertwined and move horizontally – there are no trading signals.
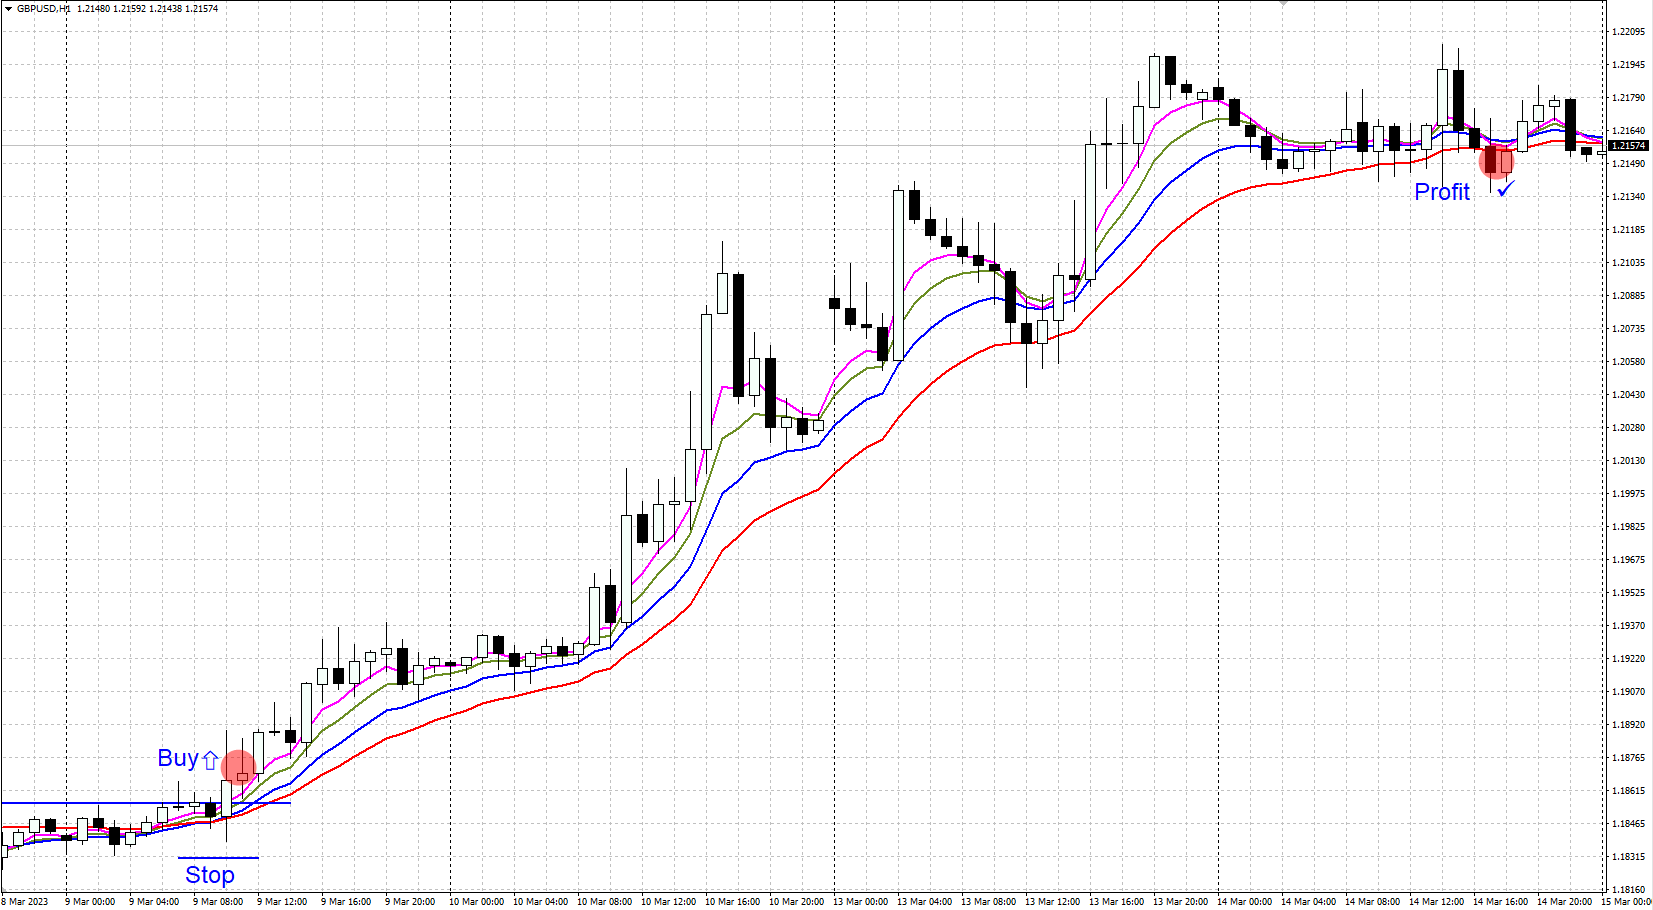
A buy signal for the strategy
- The price begins to rise, crossing all four moving averages from bottom to top, renewing the nearest local high
- The moving average lines cross and begin moving upwards, gradually diverging from each other
- A buy position is opened, and the Stop Loss is set at the nearest local low, which is below the moving averages
- Take Profit is taken when the moving averages are crossed in the opposite direction, or when the price reverses and closes below all four moving averages

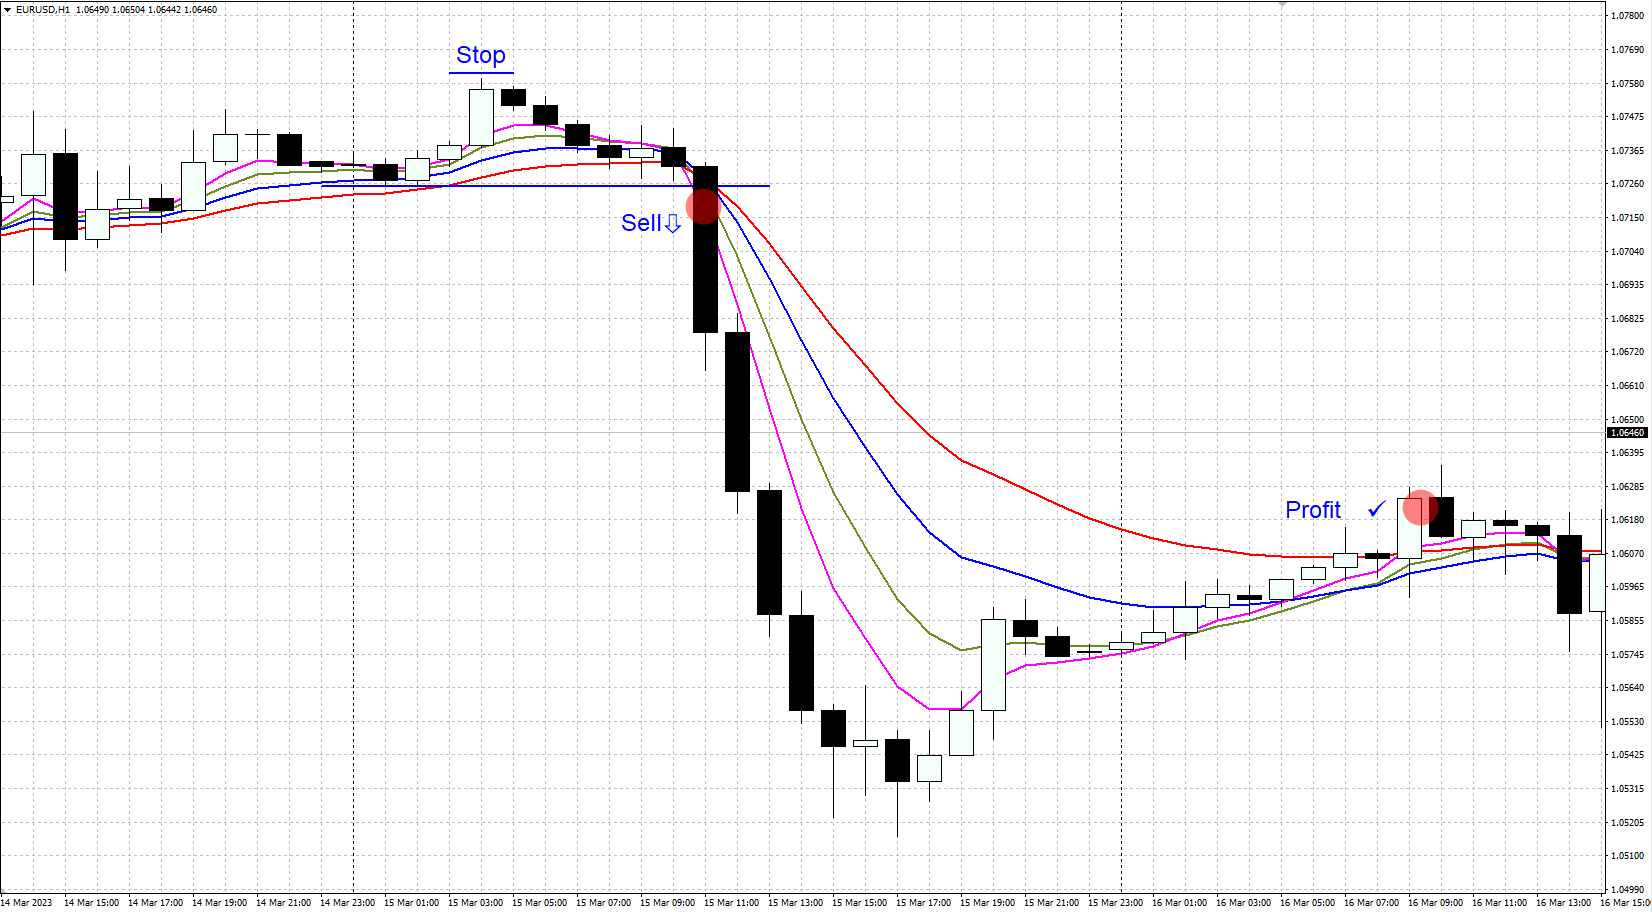
Strategy sell signal
- Prices start to fall, crossing downwards through all four moving averages, updating the nearest local low
- The moving average lines intersect and begin moving downwards, gradually diverging from each other
- A sell position is opened, and the Stop Loss is set at the nearest local high, which is above the moving averages
- Take Profit is taken when the moving averages are crossed in the opposite direction, or when the price reverses and closes above all four moving averages

Advantages and disadvantages of the strategy
Advantages:
- The strategy works well in trends, allowing you to profit from strong and sustained movements
- The potential profit can be several times greater than the potential loss
Disadvantages:
- As this strategy gives unprofitable signals during a flat period, it is better not to use it in a flat period
- Moving signals can be slightly delayed, so a significant amount of profit can be lost on sharp market reversals
Conclusion
A strategy that uses moving averages based on Fibonacci numbers is a simple trading system. It works well during a strong trend, but it should not be used in trading when the market is going through a prolonged sideways trend. It is recommended to use this strategy in combination with technical analysis tools for more reliability. And before using it, it should be tested on a demo account.


