How to Trade the on Neck Candlestick Pattern

5 minutes for reading
In this review, we will get acquainted with the trend continuation candlestick pattern called "On Neck”. We will look at the features of its formation and the trading rules for its application. We will learn its main advantages and disadvantages, and also list a few important recommendations for its use.
How the On Neck pattern is formed
The "On Neck" candlestick pattern is a pattern that indicates a further continuation of the current trend. It is rarely seen on price charts. It consists of two candlesticks: the first has a large body pointing in the direction of the current trend, and the second has a small body. They are always of different colours: if the first candlestick is white, the second is black, and vice versa.
The feature of this model is that the second candlestick opens with a gap in the direction of the trend and then closes the gap with its body. The closing prices of the two candlesticks should be about the same. The first candlestick symbolises the "body", the second one is the "head", and the line connecting them and passing through the closing prices is the "neck", hence the name of the pattern.
The appearance of a small black candlestick after a large white candlestick in an uptrend indicates that the "bulls" have met temporary resistance, and when overcoming it, will be able to continue to move upwards. The appearance of a small white candlestick after a large black one in a downtrend indicates temporary support, through which the "bears" are likely to continue the downward movement.
Bullish "On neck" pattern
This is formed during an uptrend when there is an active upward price movement. The first candlestick of the pattern (large white) appears first, and then the second candlestick opens with a gap upwards. The "bears", trying to seize the initiative, return the quotations to the closing price of the first candlestick. The second candlestick (small black) absorbs the gap with its body, with the closing prices of the two candlesticks approximately coinciding.
A bullish continuation of the "On neck" pattern is formed on the chart. We must now wait for confirmation that the "bulls" are still strong enough to overcome the temporary resistance of the "bears". A further rise in quotations above the high of the pattern’s second candlestick will confirm this. This upward movement will mean that the buyers are still very strong, and the uptrend is likely to continue.

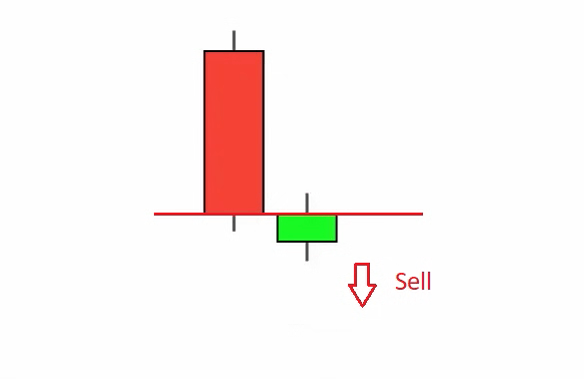
Bearish "On neck" pattern
This is formed on the chart during a downtrend when there is an active downward price movement. The first candlestick of the pattern (big black) appears first, then the second candlestick opens with a downward gap. The "bulls", trying to go on the offensive, return the quotations to the closing price of the first candlestick. The second candlestick (small white) absorbs the gap with its body, with the closing prices of the two candlesticks approximately coinciding.
A bearish continuation of the "One neck" pattern is formed on the chart. We must now wait for confirmation that the bears have the strength to overcome the temporary resistance of the bulls. A further drop below the low of the pattern’s second candlestick will confirm this. The downward movement will mean that the sellers have a strong grip on the initiative, and the downtrend is likely to continue.


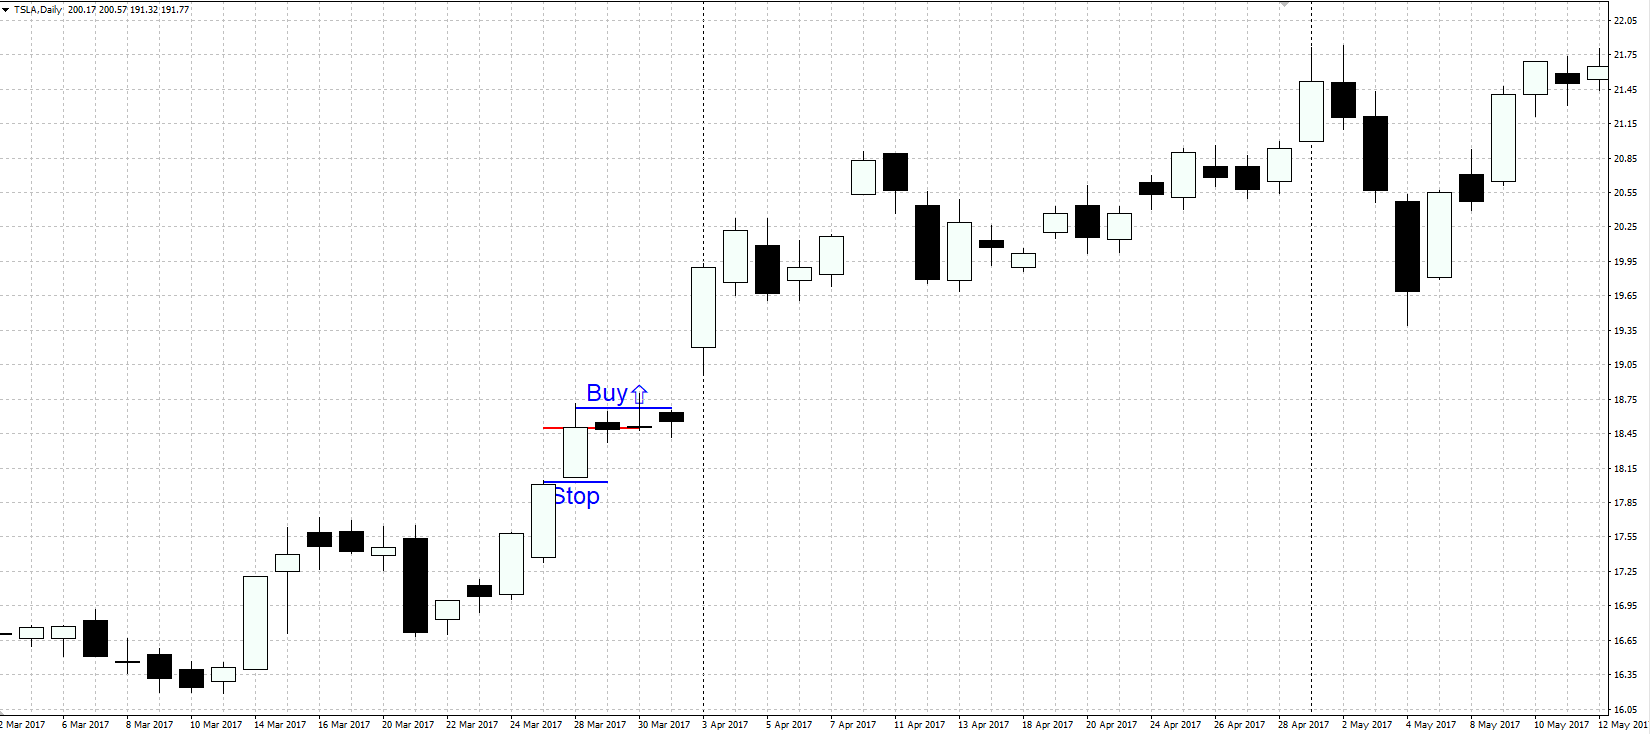
How to buy using the bullish on neck pattern
- During an uptrend, a bullish "On Neck" pattern is formed on the price chart
- It is recommended to open a buy position when the price rises above the maximum of the second candlestick in the pattern (small black candlestick). Stop Loss is set at the low of the first candlestick (large white)
- To set Take Profit, you can focus on significant support and resistance levels
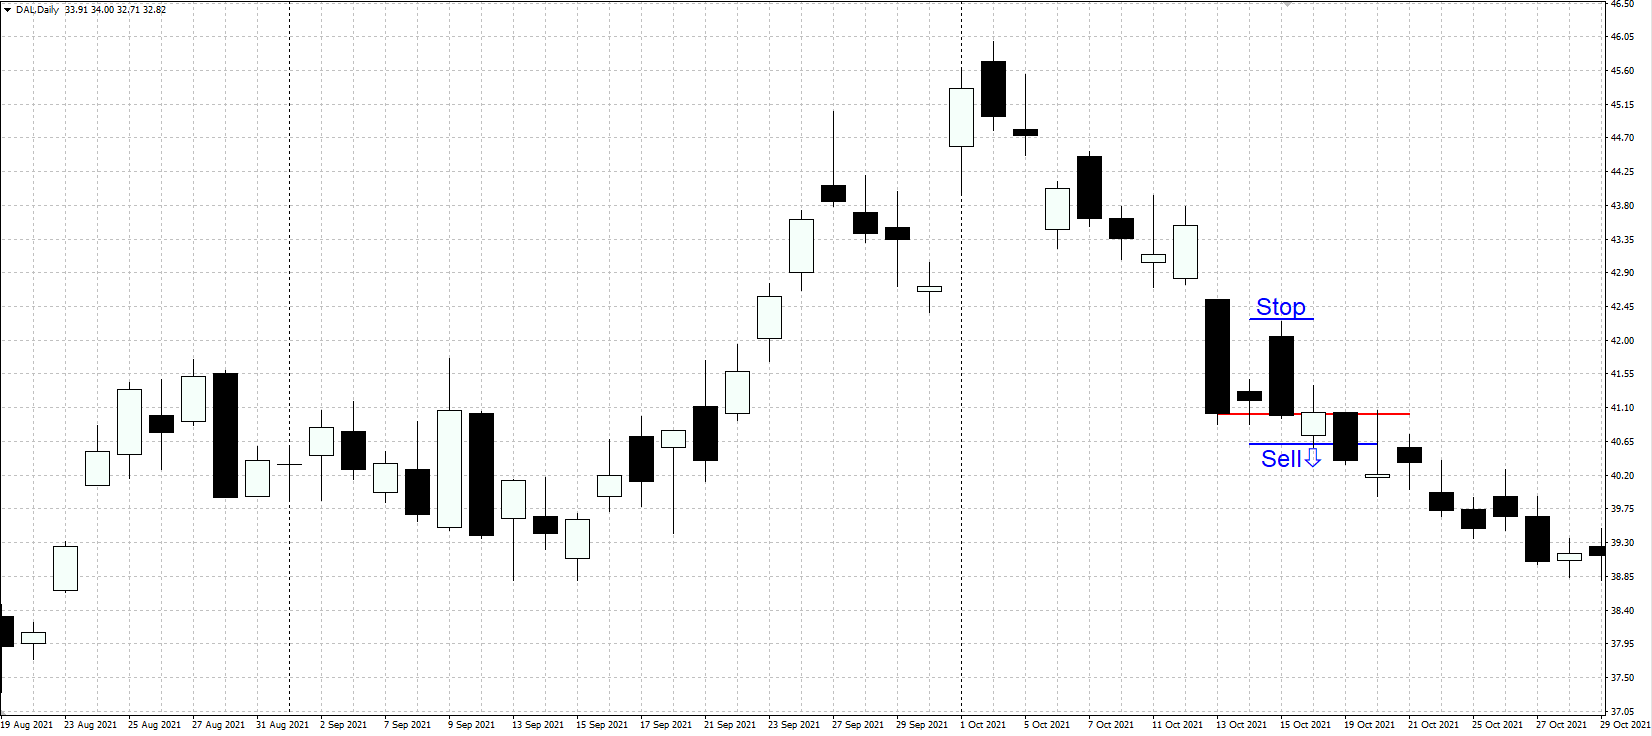
How to sell using the bearish on neck pattern
- During a downtrend, a bearish "On Neck" pattern is formed on the price chart
- It is recommended to open a sell position after the price decreases below the low of the second candlestick in the pattern (small white). Stop Loss is set at the high of the first candlestick (big black candlestick)
- To set Take Profit, you can focus on significant support and resistance levels
Recommendations for the use of the pattern in trading
- The pattern should be formed in a pronounced upward or downward trend – it is not traded in a sideways trend
- Wait for a confirmation – an update of the pattern’s high/low – before opening a trade
- To increase efficiency, the model can be used in conjunction with technical analysis tools
- It is best to use higher time frames, from H4 and above
- It is necessary to follow the rules of risk management and place protective stop-loss orders
Conclusion
The On neck candlestick pattern is formed during an uptrend or downtrend and portends a possible continuation of the trend. This pattern is rarely seen on price charts. It is recommended to use it in combination with various technical analysis tools. Before you start real trading, you should test the pattern on historical data and practice on a demo account.


