How to Trade the “S&P 500 Trend Following Strategy”

5 minutes for reading
Warning: Invalid argument supplied for foreach() in /web/blogs/sites/blog.roboforex.com/wp-content/plugins/wp_glossary/includes/class-wpg-linkify.php on line 353
Warning: Invalid argument supplied for foreach() in /web/blogs/sites/blog.roboforex.com/wp-content/plugins/wp_glossary/includes/class-wpg-linkify.php on line 353
In this article, we will look at the long-term indicator trading "S&P 500 Trend Following" strategy. We will find out how it works, how it is used in trading, and what indicator signals it is based on. We will also list its advantages and disadvantages.
How the S&P 500 Trend Following strategy works
This long-term strategy implies trading the S&P 500 (US 500) stock index in the direction of the current market trend. Note that this index is probably the best-known and most popular stock index in the world. It includes the stocks of the 500 largest companies traded on the US stock market and serves as a barometer of the state of the US stock market.
Renowned investors and asset managers Meb Faber and Paul Tudor Jones are the creators and popularisers of the S&P 500 Trend Following strategy. They presented a rather simple and at the same time effective trend-following trading system for the S&P 500 Index, which is based on the signals of the 200-day moving average.
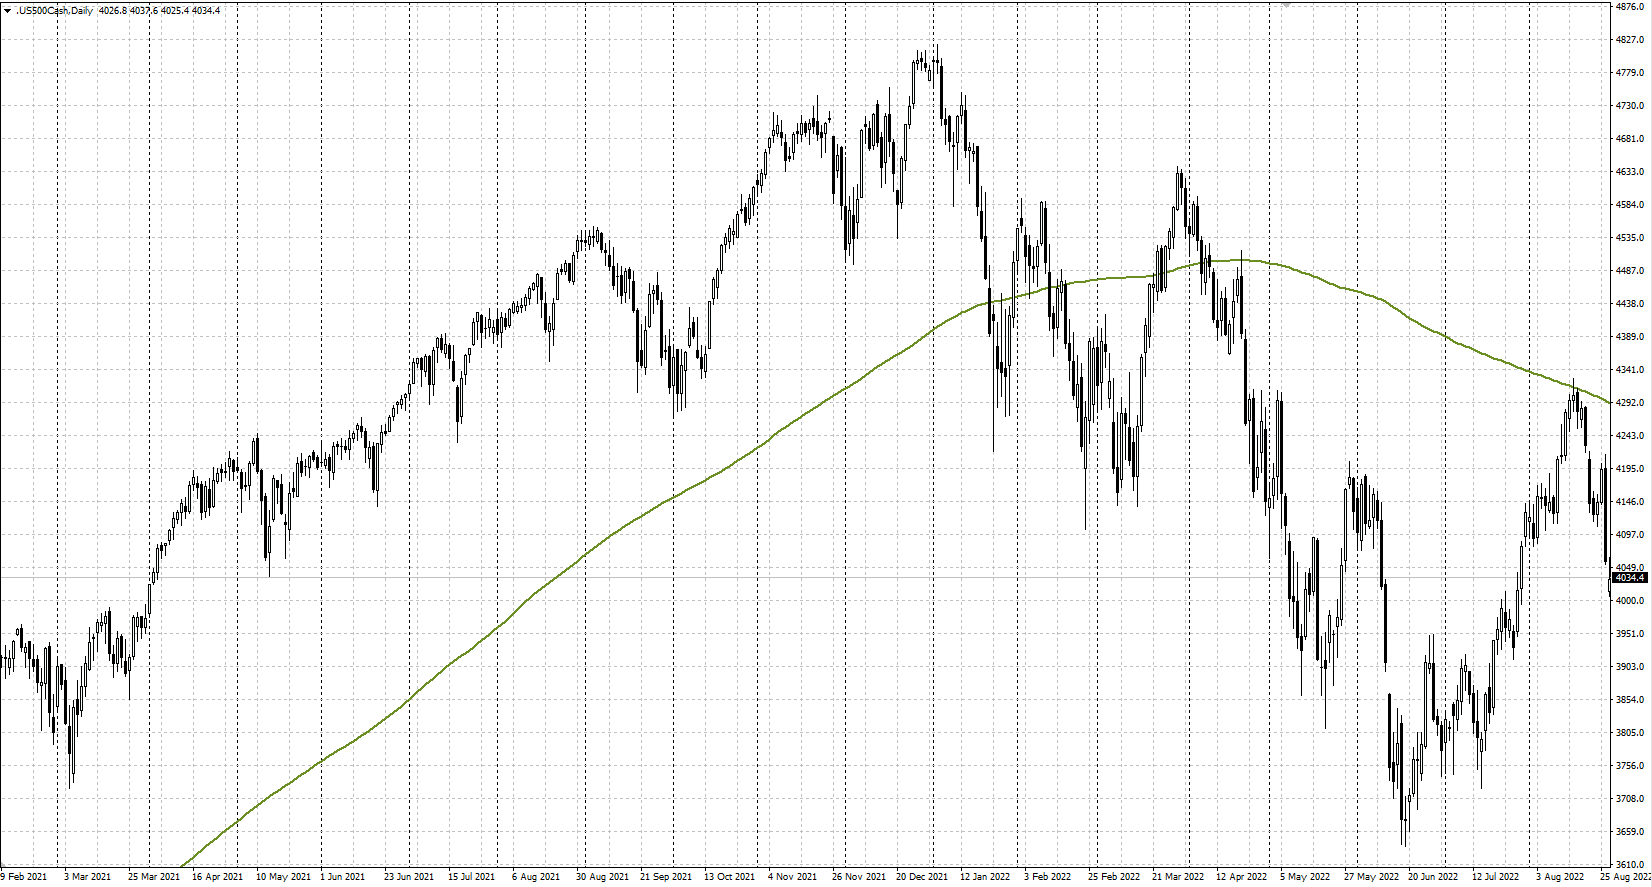
The S&P 500 often shows a steady uptrend during periods of a rising stock market. The indicator should help to identify the beginning of the next long-term trend and give investors a signal to buy to profit from the index growth.
To describe the strategy simply: when the S&P 500 is above the 200-day moving average, the trend is upward, and it is a good time to buy the index; when it is below the indicator line, the trend changes, moving downward, and all positions must be closed.


How to install the Moving Average indicator
The Moving Average (MA) has long established itself as a simple and effective tool for trend analysis. The indicator is included in most modern trading terminals where it is displayed directly on the price chart.
To set the Moving Average in the popular MetaTrader 4 and MetaTrader 5 trading platforms, follow these steps:
- Open the terminal and log in to your account.
- Select the S&P 500 from the list of available financial instruments and add it to the chart.
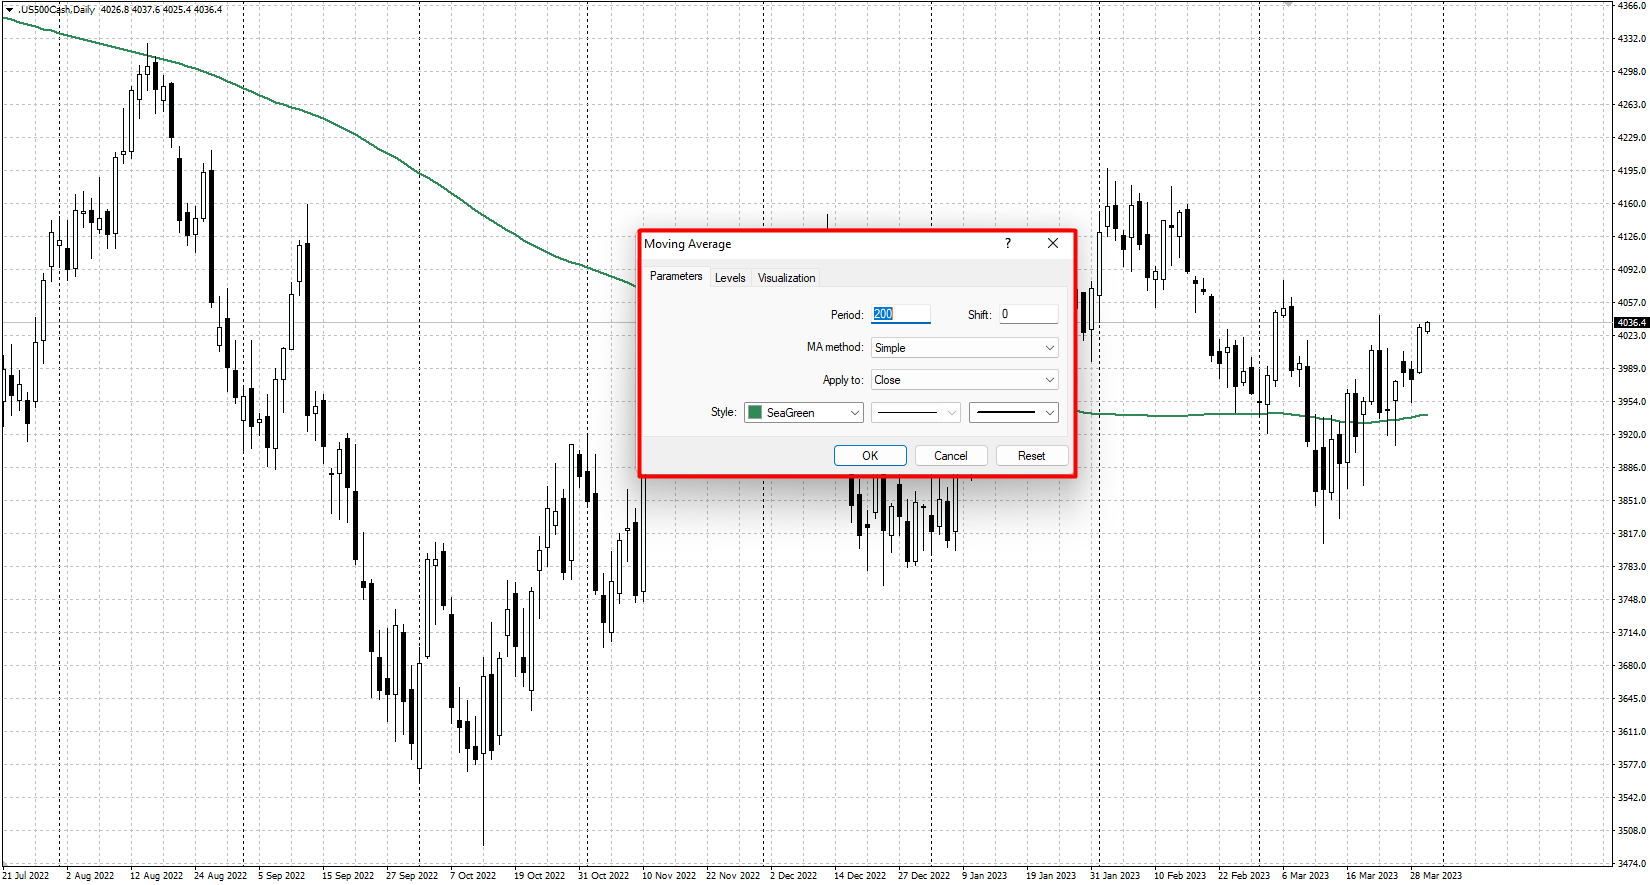
- From the main menu, click on Insert, then on Indicators, then on Trend, and select Moving Average.
- Select the period 200, the line colour and width, and the MA: Simple, and click OK to apply the settings and close the indicator settings window.
As a result, a 200-day moving average will appear on the price chart, which will be used to identify the current trend and search for trading signals according to the strategy.
How to use the strategy in trading
The S&P 500 trend-following strategy trades in one direction only – to buy the asset. Its trading principle is simple:
- When the closing price of the index crosses the 200-day Moving Average from bottom to top, this indicates the beginning of an upward trend and gives a signal to buy
- When the closing price of the index crosses the 200-day moving average from top to bottom, this signals the end of the uptrend and the need to close buy positions
A buy signal for the strategy
- The S&P 500 starts rising and confidently crosses upwards through the 200-day moving average. The daily candlestick closes more than halfway or completely above the moving average
- At the opening of the next trading day, a trade is made to buy the asset
- Stop Loss and Take Profit are not set, a position is fixed (profit or loss) when the price reverses and closes below the Moving Average with confidence
Buying example of "S&P 500 Trend Following" strategy
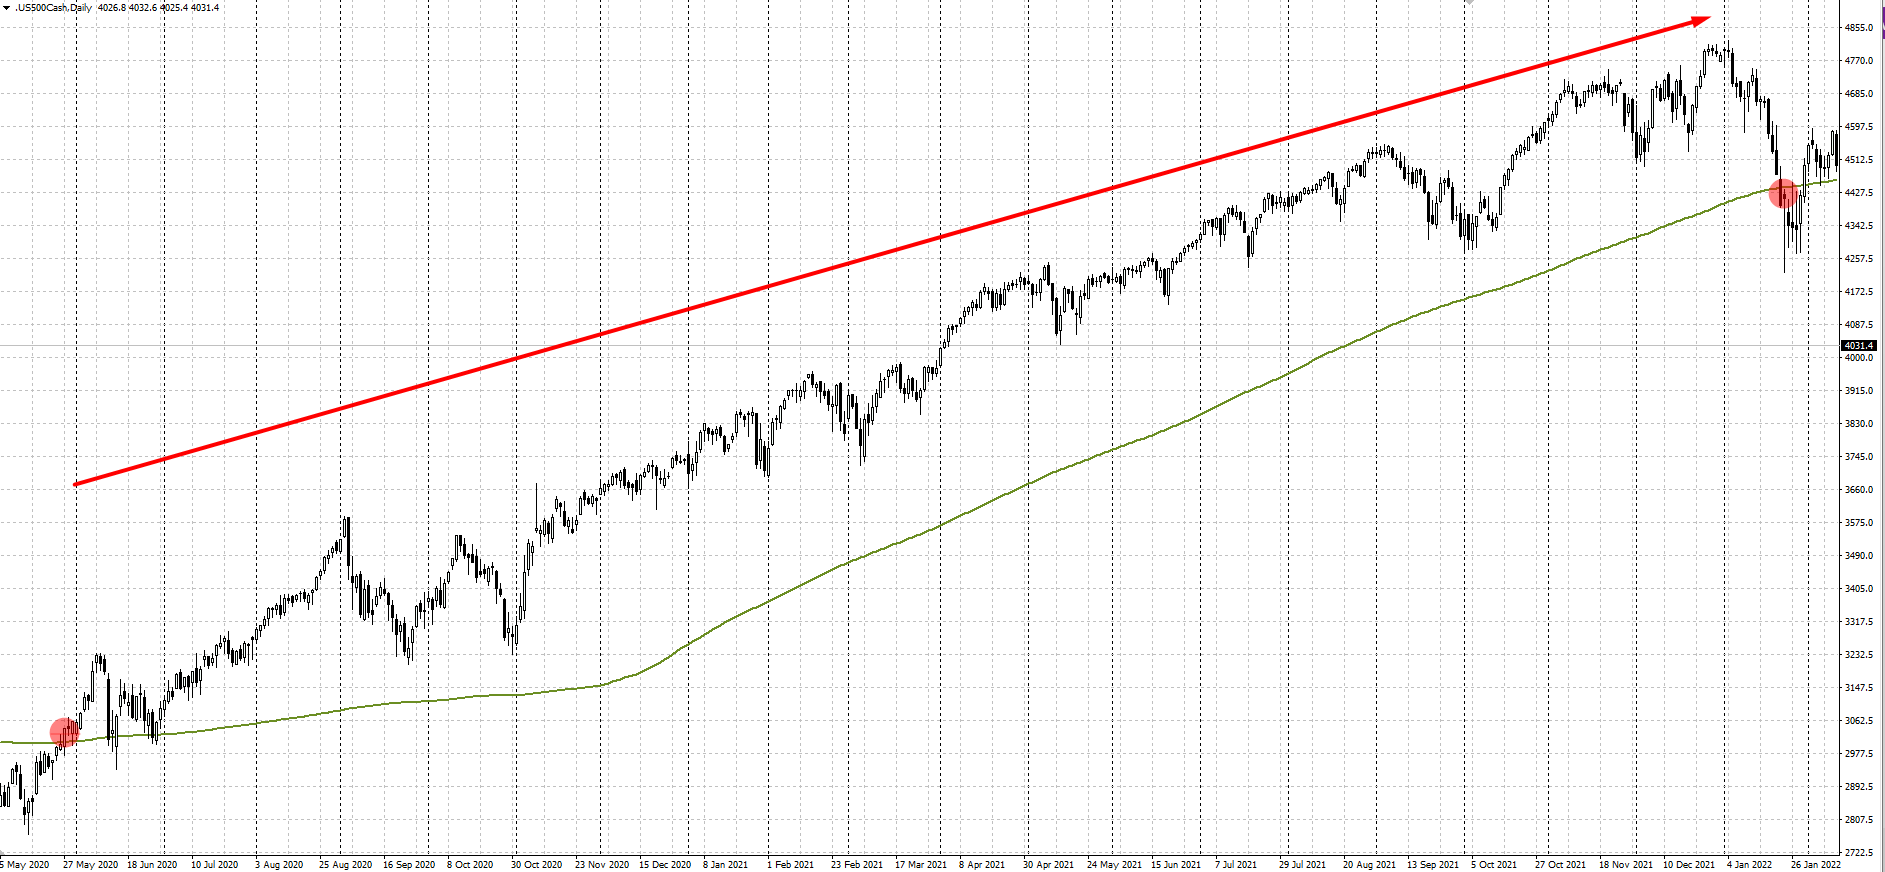
- On 27 May 2020, the index quotations showed an increase, and the daily candlestick closed above the 200-day Moving Average with confidence. On the next day, a buy position could be opened at $3047.50 at the start of the trading session
- In the following month, the quotations returned to the Moving Average line but failed to consolidate below it
- The index showed a steady uptrend throughout 2021 and only began a strong downward correction in January 2022
- On 21 January 2022, the daily candlestick closed below the 200-day Moving Average and the position had to be fixed at $4422.40 at the opening of the next trading day
Advantages and disadvantages of the strategy
Advantages:
- The strategy works well during a sustained uptrend, allowing you to profit on strong and prolonged movements of the S&P 500 index
- The potential profit can be many times greater than the potential loss
Disadvantages:
- Gives unprofitable signals: when there is no clear trend in the market, there is a wide sideways movement
- The 200-day moving average signals may not be able to keep up with the price movement, so a large portion of profits can be lost on sharp market reversals downwards
- Characterised by a small number of trades and high capital requirements, this strategy is more aimed at large long-term investors and may not be of interest to traders
Conclusion
The S&P 500 Trend Following Strategy is a simple long-term trading system based on signals from the 200-day moving average. It works well during a strong trend when the stock market and the S&P 500 index are rising steadily. This trading approach is geared more towards long-term investors and will probably not work for traders. The strategy should be tested on historical data before use.