Tesla Stock Analysis: Is Growth to Be Expected in the Short Term?

6 minutes for reading
In this overview, we will look at the current situation on the Tesla Inc. (NASDAQ: TSLA) stock chart. We will assess the medium-term trading prospects for the shares based on technical analysis, fundamental factors, and indicator signals.
Technical analysis of Tesla stock
Let’s look at the daily chart to analyse the medium-term outlook for the US electric car manufacturer’s stock. At the time of writing, the quotes were at the 182.9 USD level.
The chart shows that Tesla Inc. has been trading in a long-term descending channel since the start of 2022. During this time, the stock has gradually declined in a range from 400 USD to 101 USD per share. The local low was set at 101.81 USD in January this year.
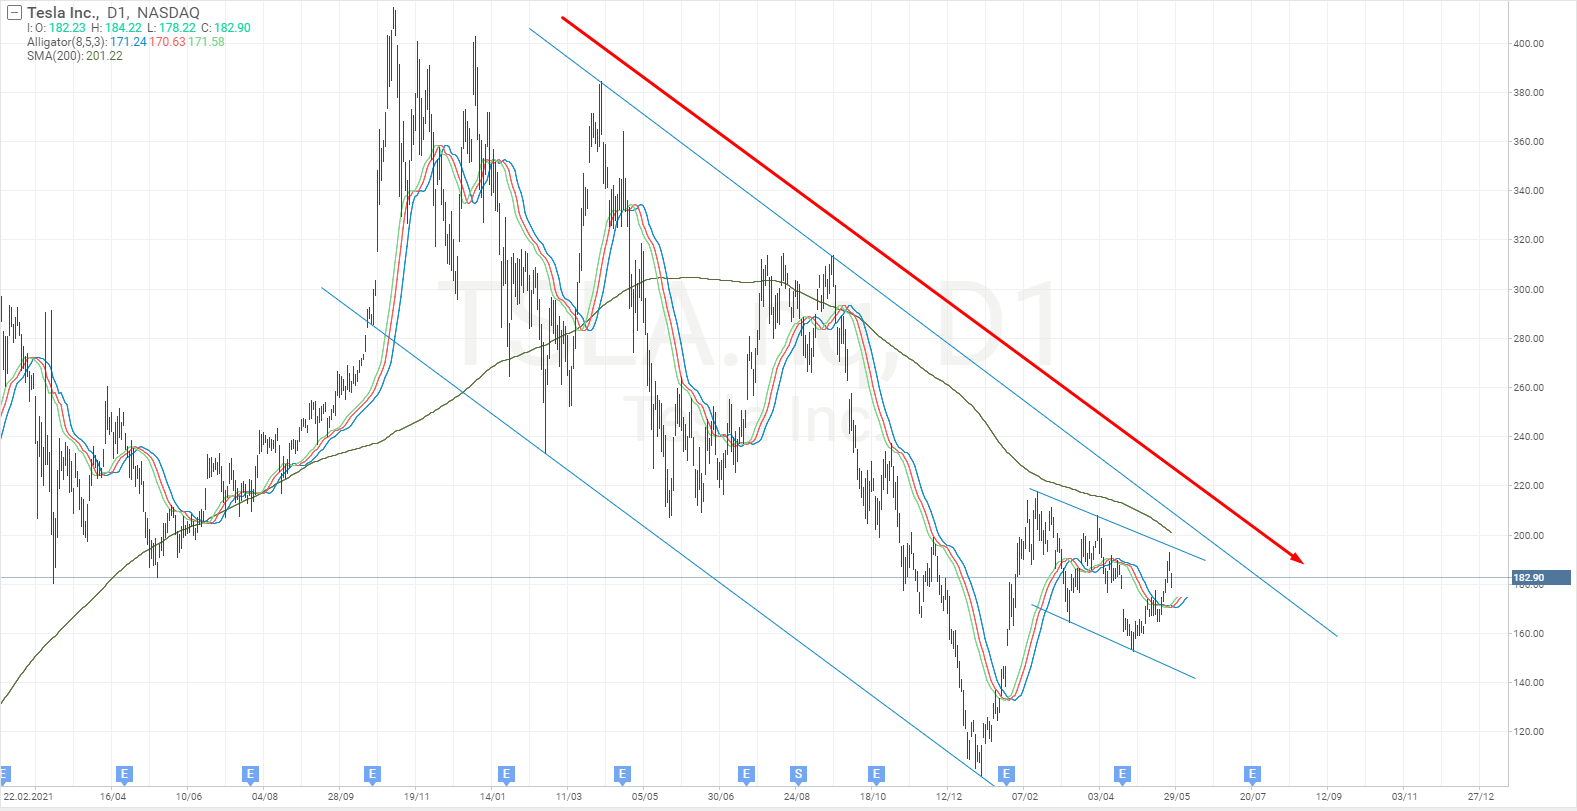
Having reached the low, the quotes demonstrated a sharp reversal upwards and reached the 217.65 USD level. This was followed by a correction during which a “Flag” uptrend continuation pattern was formed. It will activate and give a buy signal if the quotes secure the closing prices of the trading day above its upper boundary.
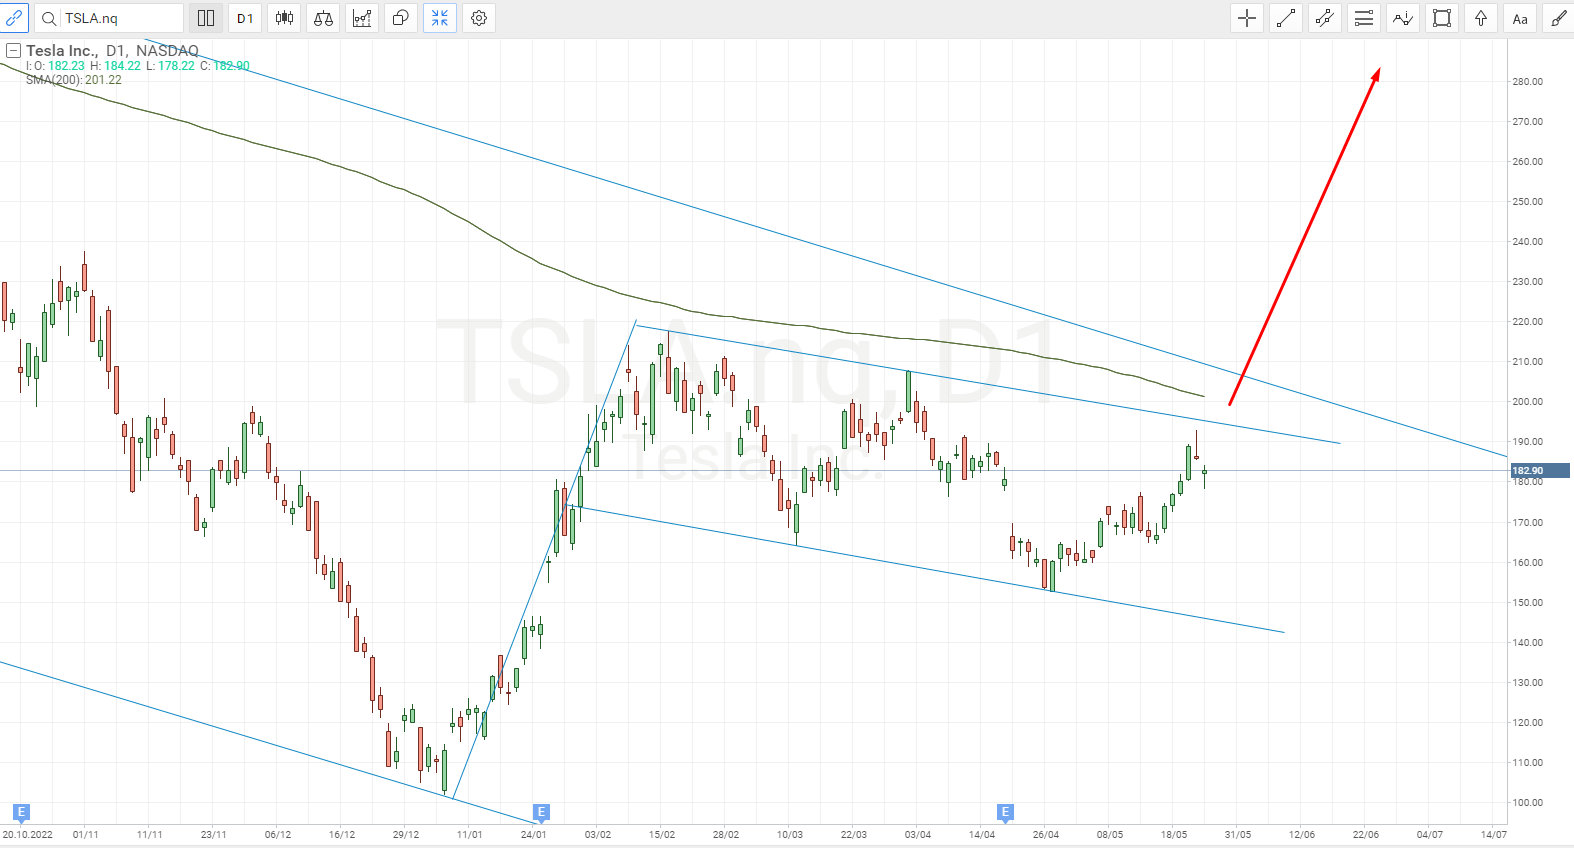
The upper boundary of the "Flag" is close to the resistance line of the long-term price channel, with the 200-day Moving Average also located there. There is a strong area of resistance between 195 USD to 205 USD. When the quotes cross this area and settle above it, this can clear the way for a bullish scenario to the resistance level near 314 USD.
At the time of writing, the “bullish” scenario looks more probable: the first impulse upward movement occurs followed by a correction with the formation of the “Flag” uptrend continuation pattern, and the quotes consolidation near the resistance area.


Evaluation of the indicator signals
- 200-day Moving Average. At the time of writing, the indicator line is at the 201.23 USD level and the quotes are declining slightly. This indicates a current long-term downtrend. If Tesla Inc. stock manages to break through the SMA (200) and settle above it, a reversal and a change to an uptrend are possible
- Alligator. The Williams trend indicator shows the beginning of an uptrend on the daily chart. The quotes are above all three lines of the indicator, with the lines coming out of the tangle – the Alligator is opening its “jaws”. The indicator lines are now at 170 USD. If the price crosses them downwards, the bullish scenario will be cancelled
- The RSI (14). The popular oscillator recently formed a buying signal: there was a crossing of level 50 from below to above. The indicator line confirms the "Flag" pattern, giving an early signal — the upper boundary of the pattern is already broken.
- On-Balance Volume (OBV). The indicator shows confident growth since the beginning of this year. Additionally, a formation similar to the "Flag" trend continuation pattern has formed on the indicator chart.
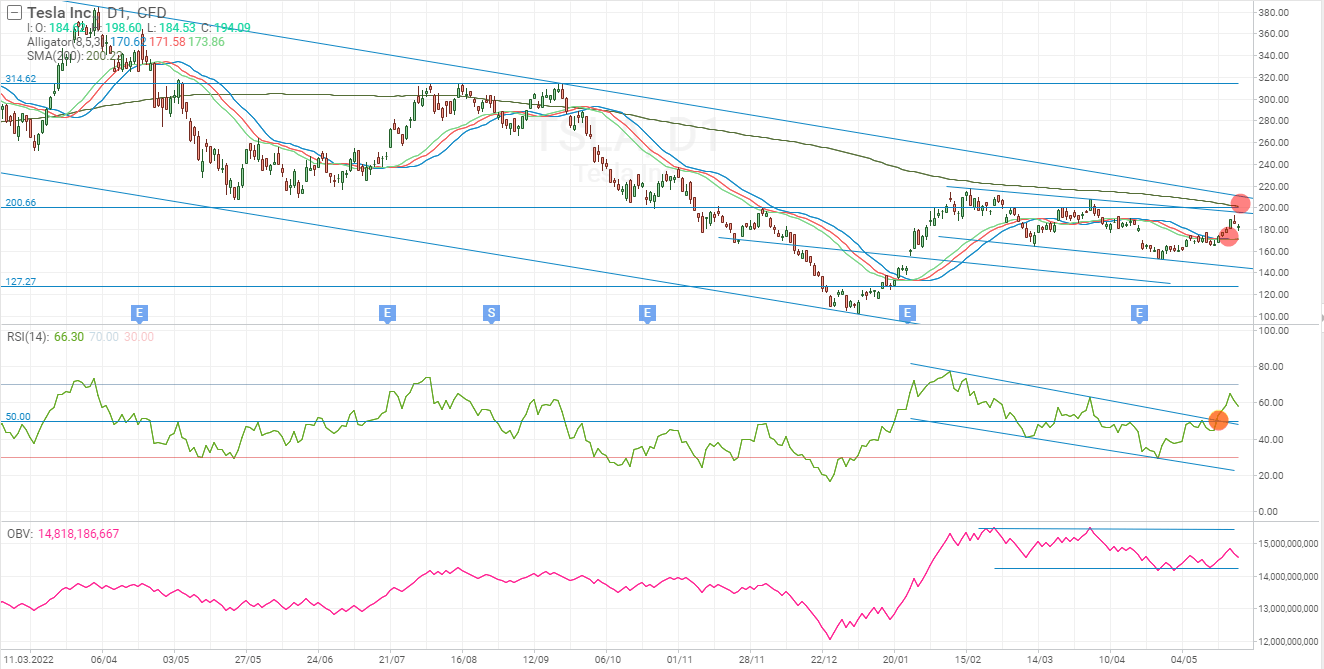
The Alligator and RSI (14) indicators have formed buy signals showing a daily uptrend that could continue. The SMA (200) acts in contrast with them: it is above the current price and is a strong resistance level that the "bulls" are likely to try to break.
Fundamental factors
Tesla Inc. reported results for the first quarter of 2023 on 19 April, recording a 26% decline in operating profit compared with the same period of last year. This was due to a decision to lower car prices in the US. The average price dropped from 52,200 USD (a year ago) to 46,000 USD per unit. At the same time, the reduction in the model line-up prices triggered a 36% increase in car deliveries to 422,875 vehicles.
Following the release of the reports, the stock tumbled from approximately 180 USD to 150 USD within a week, but three weeks later, the share price could rise above 180 USD. It can be assumed that investors are still positive and understand the logic of the car company’s management team: such steps are taken to retain and expand the target market amid growing competition. The car manufacturer is committed to the continuous development of innovative programmes such as an autopilot system. The next quarterly report of Tesla Inc. will be published on 20 July.
The global demand for electric vehicles is growing. According to the International Energy Agency (IEA), over 10 million electric vehicles were sold worldwide in 2022, with this number expected to rise by 35% to 14 million in 2023. The share of electric cars in the total number of vehicles worldwide has increased from approximately 4% in 2020 to 14% in 2022, and according to IEA forecasts, it will rise by a further 18% this year.
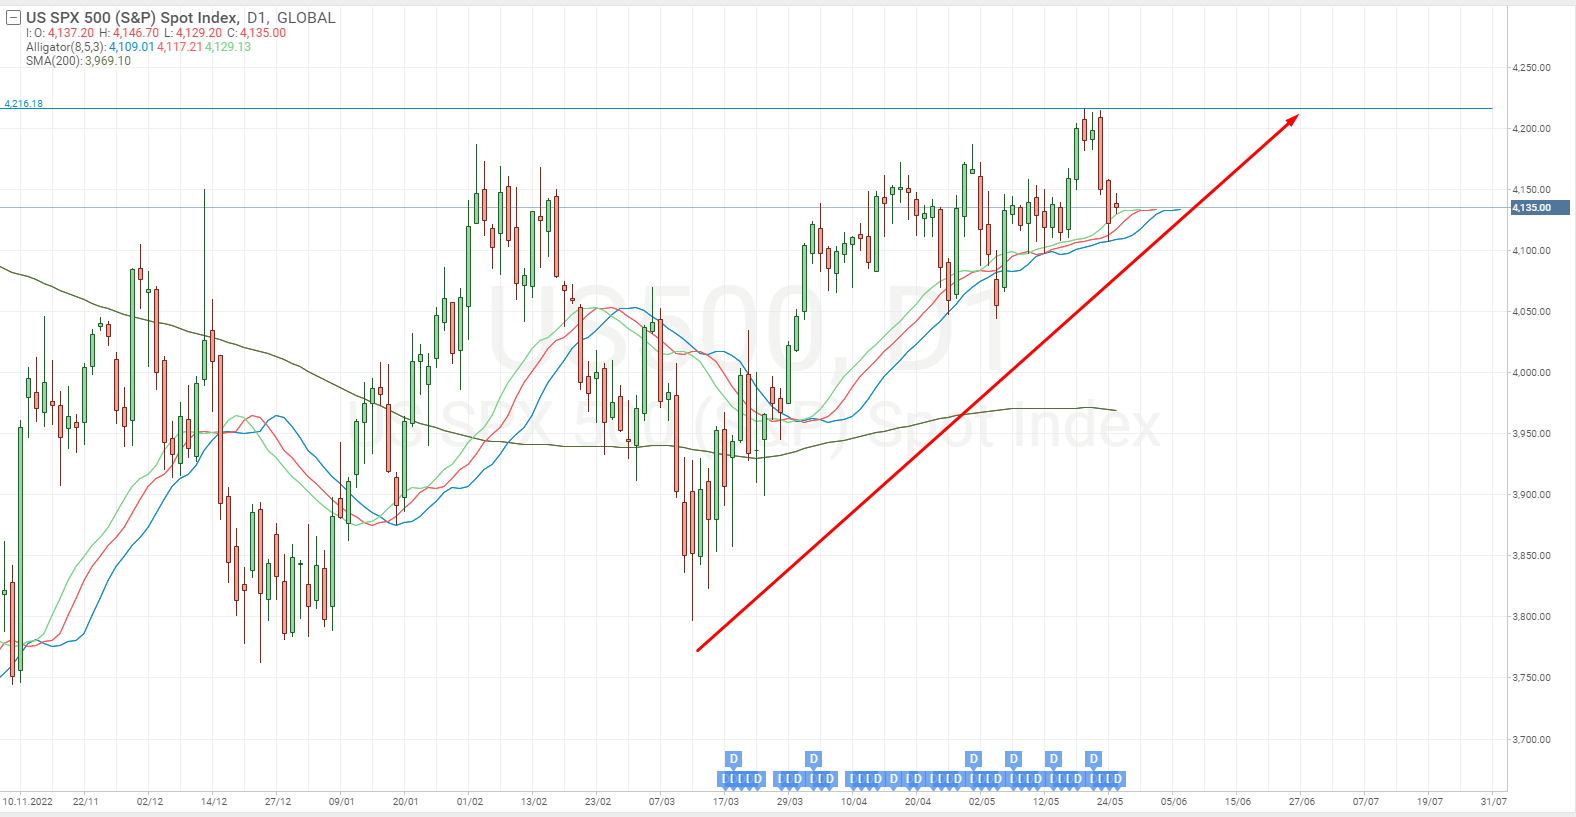
The S&P 500 and NASDAQ 100 indices demonstrate positive trends. The S&P 500 has risen about 10% since the start of the year, reaching another high at the level of 4,216 USD on 19 May. The NASDAQ 100 has added about 27% during this period, reaching a high of 13,937 USD on 23 May. The indices and the entire stock market were supported by the market’s expectations of the US Federal Reserve System monetary policy tightening being completed soon.


Summary
Based on the results of technical analysis and signals from selected indicators, Tesla Inc. shares might increase in value in the medium term. The stock prices have secured support around $101 and showed a strong upward movement, which is likely to continue after the completion of a local correction.
As for the evaluation of fundamental factors, the data shows both positive and negative influences. Specifically, the decrease in operating profit for the first quarter is offset by sales growth and the optimistic sentiment of the stock market.
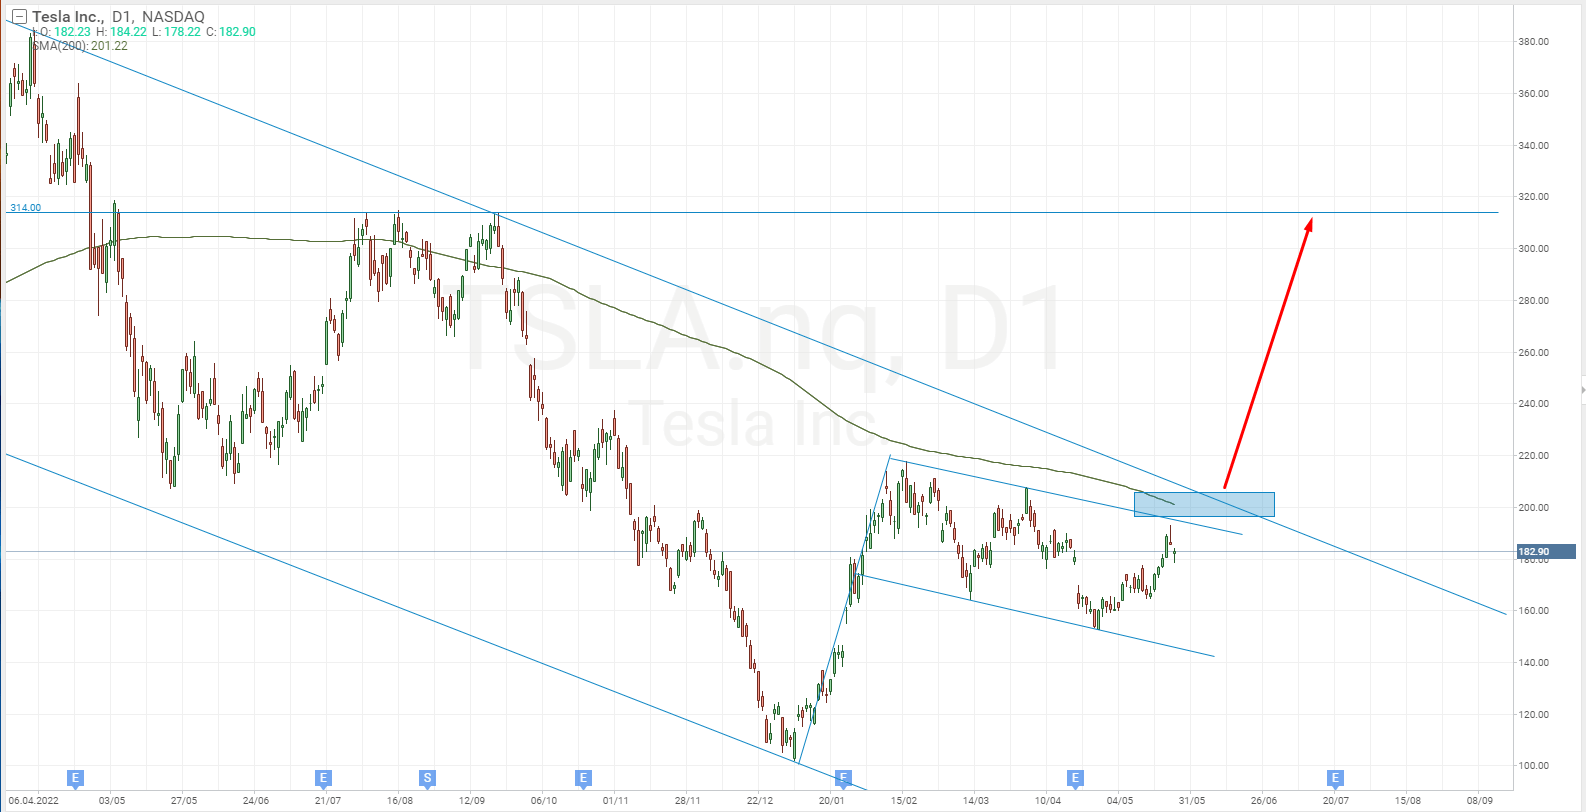
The key area on the price chart appears to be around 195-205 USD. With the quotes remaining below this range, it is too early to speak of a trend reversal. However, if the bulls manage to surpass the mentioned zone, this will signal a reversal and the start of an upward trend with a potential for growth towards the 314 USD area. With a favourable influence from fundamental factors, a further movement towards the maximum level around 414 USD is possible.


