S&P 500 Forecast for 2024: Can the Index Hit 5,000?

9 minutes for reading
On 29 November 2023, we looked at the popular stock index S&P 500 (US500), examining global economic factors influencing it and potential investment and trading strategies. Based on technical analysis, we assessed the current situation on the index chart and explored analysts' forecasts for 2024.
You can visit the RoboForex Market Analysis webpage for the latest Indices forecasts.
Overview of the S&P 500
The S&P 500 is one of the world’s most widely used stock indices, comprising 500 of the largest companies traded on US stock exchanges. It was created on 4 March 1957 by Standard and Poor’s, now known as S&P Global Inc.
Companies in the index basket represent various economic sectors and industries, making the S&P 500 a crucial gauge for assessing the US stock market.
Top 10 S&P 500 stocks by index weight
According to Investopedia data as at 29 August 2023, the top 10 corporations include:
| No. | Company | Index Weighting | Market Capitalisation |
| 1 | Apple Inc. (NASDAQ: AAPL) | 7.10% | 2.75 tn USD |
| 2 | Microsoft Corporation (NASDAQ: MSFT) | 6.51% | 2.36 tn USD |
| 3 | Amazon.com Inc. (NASDAQ: AMZN) | 3.24% | 1.35 tn USD |
| 4 | NVIDIA Corporation (NASDAQ: NVDA) | 2.84% | 1.04 tn USD |
| 5 | Alphabet Inc. Class A (NASDAQ: GOOGL) | 2.14% | 1.66 tn USD |
| 6 | Tesla Inc. (NASDAQ: TSLA) | 1.87% | 0.784 tn USD |
| 7 | Meta Platforms Inc. Class A (NASDAQ: META) | 1.84% | 0.774 tn USD |
| 8 | Alphabet Inc. Class C (NASDAQ: GOOG) | 1.83% | 1.66 tn USD |
| 9 | Berkshire Hathaway Inc. Class B (NYSE: BRK.B) | 1.81% | 0.789 tn USD |
| 10 | UnitedHealth Group Incorporated (NYSE: UNH) | 1.30% | 0.473 bn USD |
The S&P 500 eligibility criteria
- Market capitalisation is greater than or equal to 14.5 billion USD
- At least 50% of shares should be available for public trading
- Stocks should be traded on the NYSE or NASDAQ
- The company should have a primary listing on a US stock exchange, comply with US securities laws, and generate at least 50% of its income in the US
- Operations for the last four quarters should be profitable
The list of the S&P 500 companies is revised every quarter. If, for any reason, a corporation no longer meets the above criteria, it is replaced with another company.
Looking back: the S&P 500 performance in recent years
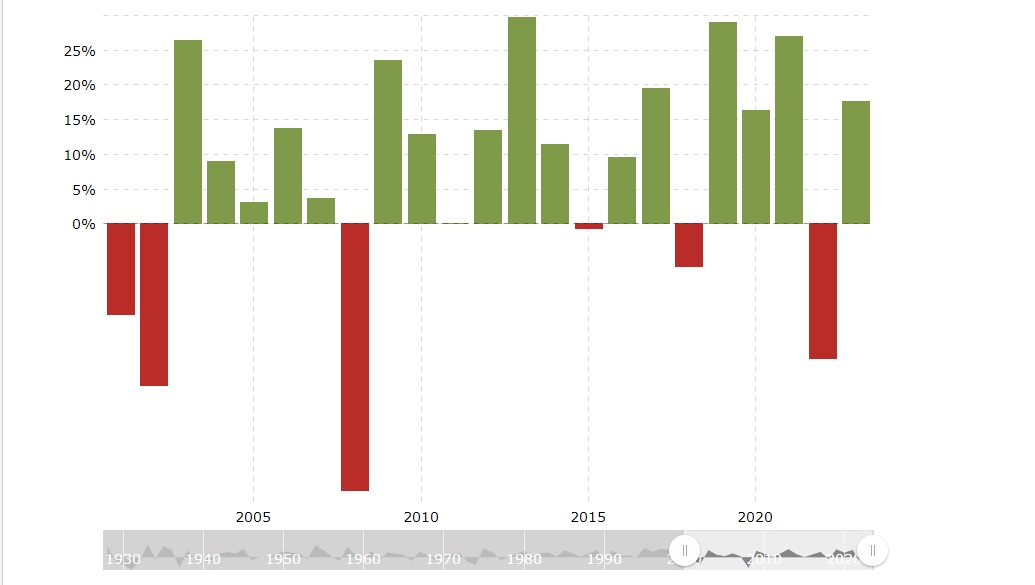
According to TradeThatSwing, the average annual return for the S&P 500 from September 1973 to September 2023 inclusive is 10.75% if unadjusted for inflation and 6.59% if adjusted for inflation. From 1998 to 2022 inclusive, the maximum index return of 30% was recorded at the end of 2013. The minimum value for the same period was seen at the end of 2008, standing at −38%.
The average annual return for the S&P 500 from September 2018 to September 2023 inclusive reached 10.49% if unadjusted and 7.28% if adjusted for inflation. It can be assumed that the index value could have been higher if stock performance in 2020 were not characterised by the high volatility caused by the COVID-19 pandemic. In addition, it was negatively affected by both a bearish market and a high inflation level in 2022.
Global economic factors influencing the S&P 500
- The Federal Reserve’s monetary policy. Interest rate changes may impact borrowing costs for companies, affecting profits and investment decisions
- Global economic growth. This usually has a positive impact on companies’ profits and contributes to index growth
- Exchange rates. The strengthening of the US dollar may adversely affect profits of US companies with a significant share of global operations
- Corporate reporting. Positive quarterly and annual reports may drive up stocks of the S&P 500 companies, creating favourable conditions for index growth
- Important political events in the country. For example, tax reforms or regulation changes may have a substantial effect on the stock market, and hence the index
- Energy source prices. Changes in oil and gas prices may affect the energy sector, and index quotes
- Geopolitical events. For example, a war may lead to uncertainty and volatility in financial markets
- Market sentiments and investor behaviour. For instance, speculative activity may influence the movements of the index quotes


Key markets driving the performance of the S&P 500
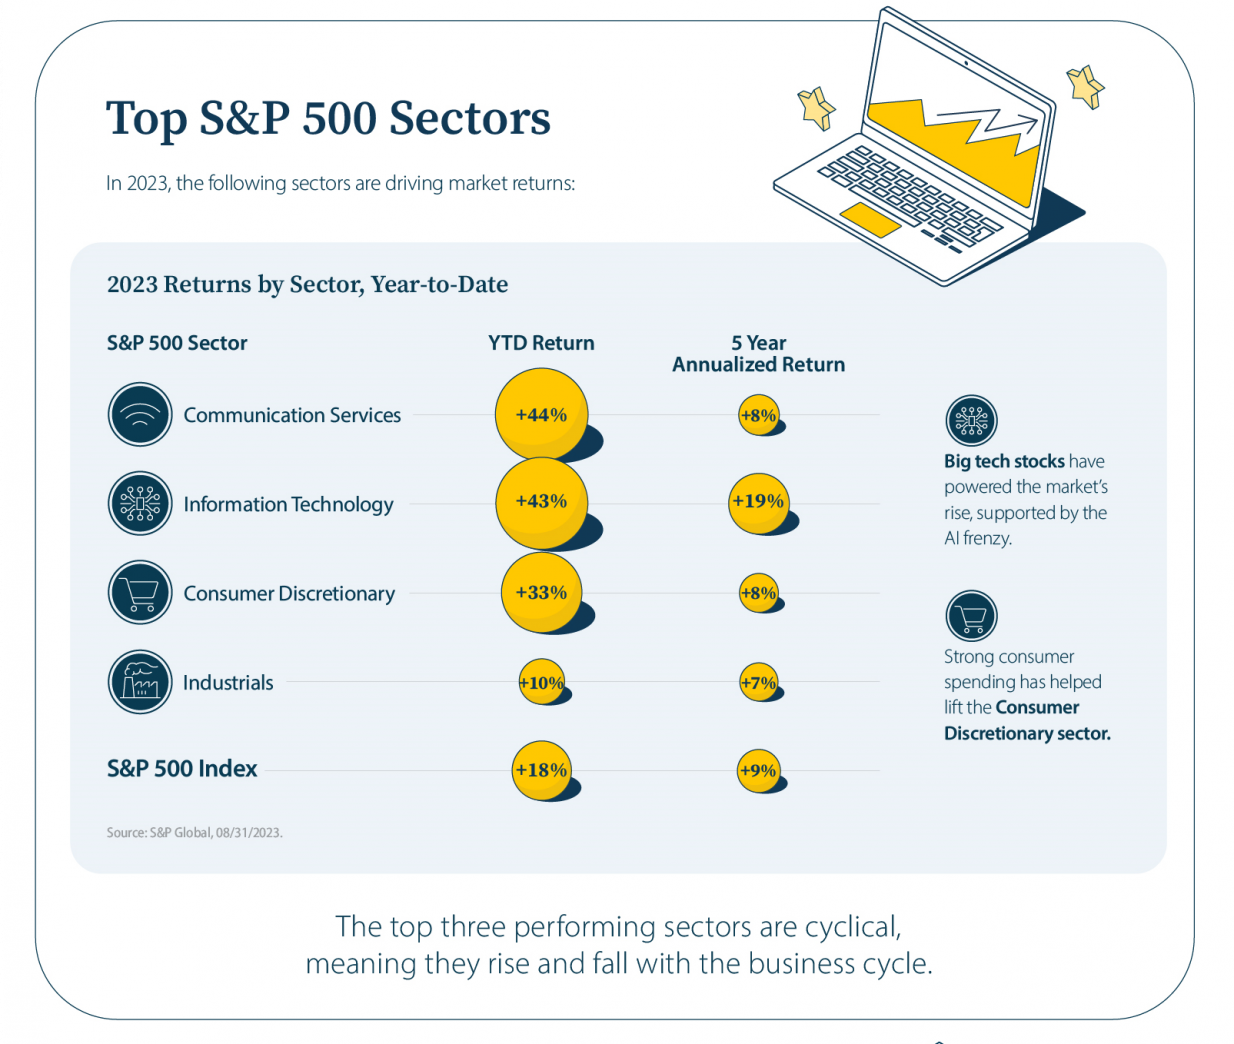
According to the Visual Capitalist portal, the main drivers of growth for the S&P 500 index were the following sectors:
- Communication Services: +44%
- Technology: +43%
- Consumer Staples: +33%
- Industrials: +10%
Expert predictions: analysts' views on the S&P 500 in 2024
- Goldman Sachs Research experts forecast US stocks will bring modest gains next year as economic growth, which exceeds the consensus, is partly offset by high stock prices. They predict the S&P 500 will rise to 4,700 points by the end of 2024, marking a growth of approximately 4% from current values and overall returns of about 6%, including dividends
- Reuters polls show that the S&P 500 will end 2024 at 4,700 points, with a possible US economic slowdown or recession considered among the most significant risks for the market next year
- Bank of America’s specialists expect lower global inflation to allow central banks to cut rates, thereby enabling the index to reach a record level of 5,000 points by the end of 2024
Technical analysis: chart patterns and price movements
Technical analysis of the chart S&P 500*
The S&P 500 has demonstrated consistent growth since October 2022, moving within an ascending weekly price channel. A downward correction lasted from July to October 2023, ending at the support level of 4,100 points. Subsequently, there was an abrupt upward reversal, with the index quotes resuming growth. Upward solid momentum is observed at the time of writing, and the Alligator and SMA (200) indicators confirm the uptrend.
On 29 November 2023, the quotes are hovering around 4,554 points, not far from an annual high – the resistance level at 4,607 points. This level is likely to be tested in the short run. If the quotes fail to breach it, they might slightly correct to the nearest support level of 4,325 points. A consolidation above 4,607 points will create favourable conditions for potential further growth and testing the all-time high of 4,818 points. It is worth noting that the index reached this level in 2022.
Long-term investment approaches for S&P 500
Long-term investing in the S&P 500 index*
Long-term investment decisions are typically based on analysing fundamental factors affecting the S&P 500 quotes. This can be investing based on corporate reports of the index companies or the purchase in anticipation of a potential global economy recovery following another crisis.
Buying or selling the index directly is impossible since this is just a calculated value. Therefore, various financial instruments such as stocks, futures, options, CFD contracts, and ETFs are used for trading. One of the relevant options for long-term investing is likely to be ETFs – exchange-traded funds – that have the same structure as the selected stock index. One of the most well-known and popular ETFs for the S&P 500 is SPDR® S&P 500® ETF Trust (SPY).
Following a decline of the index quotes from 3,400 to 2,200 points in 2020 during the COVID-19 pandemic and a beginning recovery of the global economy and equity markets, it was possible to invest in the S&P 500 by buying securities of SPDR® S&P 500® ETF Trust. The main idea was to wait for a potential recovery of the index quotes to the pre-crisis levels, which eventually happened.
Short-term trading strategies
Short-term trading of the S&P 500 index*
For short-term S&P 500 trading, classical technical analysis and various proprietary techniques such as the Elliott wave theory and strategies of Linda Raschke, Bill Williams, and other famous traders can be used. In addition, price patterns, candlestick combinations, Price Action patterns, and various indicator strategies are applicable. Let us also keep in mind futures, options, and CFD contracts.
For example:
- During a downward index correction in March 2023, a Double Bottom price reversal pattern formed on the H1 timeframe, predicting the end of the corrective decline
- After the quotes consolidated above the pattern baseline, there was a buy signal, which was supported by further growth of index quotes
Conclusion
The S&P 500 is one of the world’s most widely used stock indices, comprising stocks of 500 of the largest companies traded on US stock exchanges.
The S&P 500 index experienced a downward correction in 2022 and reversed upwards in 2023, demonstrating a steady uptrend. Stock market experts have a moderately optimistic outlook, expecting growth to continue to 4,700-5,000 points in 2024. These forecasts may be frustrated by risks of a possible US economic slowdown caused by a further rise in inflation and further tightening of the Federal Reserve’s monetary policy.
FAQ
What factors are critical in predicting the S&P 500's performance?
Economic indicators, industry trends, investor sentiment, and global events are key predictors.
How can individual investors prepare for market fluctuations in 2024?
Staying informed, diversifying portfolios, and considering long-term strategies are essential.
How can individual investors impact the S&P 500?
Retail investors contribute to market liquidity and can influence short-term market trends through collective investment decisions.
Can regulatory changes significantly impact the S&P 500's trajectory?
Yes, government policies and regulations can substantially impact market dynamics and investor confidence.
What are the risks of forecasting the S&P 500's performance?
Predictions can be affected by unforeseen economic, political, and global factors, making accurate forecasting challenging.
* – The charts featured in this article originate from the TradingView platform, renowned for its extensive set of tools designed for financial market analysis. Functioning as a user-friendly and advanced online market data charting service, TradingView allows users to perform technical analysis, explore financial data, and connect with fellow traders and investors. Furthermore, it offers valuable guidance on effectively understanding how to read forex economic calendar, in addition to providing insights into various other financial assets.


