In this review, we will discuss an interesting technical indicator CCI (Commodity Channel Index). This indicator helps to find an approaching correction or reversal on the price chart.
Synergy strategy may be used not only on Forex but also on futures and stock markets if there are indicators for the respective trading terminals.
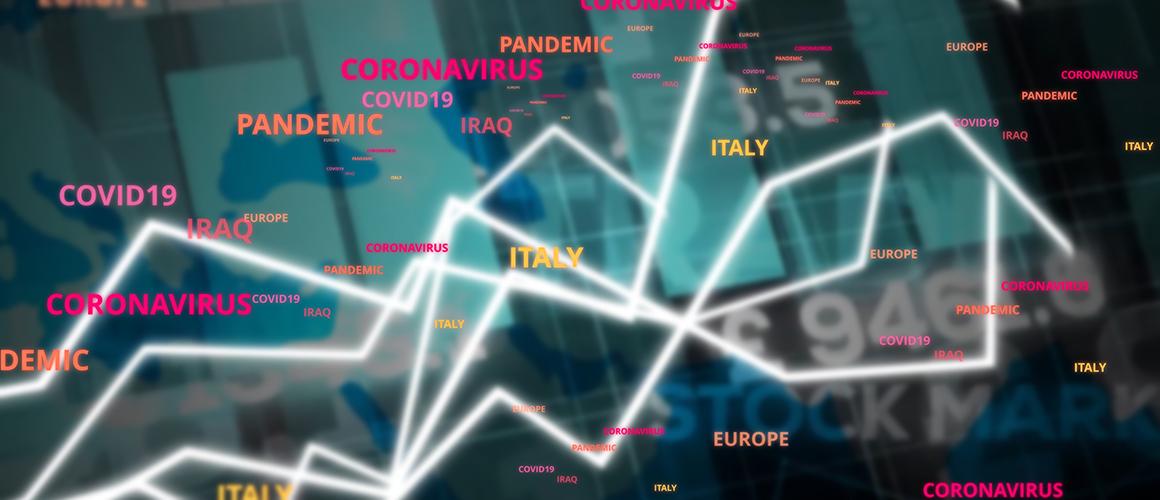
Coronavirus keeps threatening the world economy. The S&P500 index is again trading near its recent lows: by the moment this article is published, it will most probably have broken the support level at 2,850 USD and go on declining.

The Turtle system features clear rules of entering and exiting the market, understandable to beginners. It is important to comply with them strictly, as well as with the market management rules, such as the risk of 1-2% per trade.

Today I would like to suggest considering a trading idea to sell EUR/USD and Apple (NASDAQ: AAPL) stocks.

The Heiken Ashi (translated as "middle candlestick") indicator is just another way of representing the price chart as candlesticks, different from the popular Japanese candlesticks. In essence, it is an alternative way of drawing a price chart by averaging. The Heiken Ashi indicator is featured by many popular trading terminals, including MetaTrader 4 and MetaTrader 5.

The time has come for coronavirus to influence the quotations of stock indices as well. While a month ago these were just rumors, now investors are seriously worried about the probable troubles of Chinese companies.
In this article, we will speak about the inner structure and the peculiarities of market waves. We will discuss the multilevel model of the market cycle and its consistent parts – subwaves of various complexity and levels.
In this review, we will discuss a popular indicator called ZigZag. This indicator makes it easier to interpret charts, showing important price changes, and helps to carry out tech analysis.

Each company has a limited number of buyers who can purchase its goods. What if the company has reached the limit? Let's see on General Motors example.
Trendlines can show where to enter in the direction of the trend and where the current trend might end.
The R StocksTrader terminal is a high-tech product featuring more than 12,000 trading instruments, including stocks of US and European companies, currency pairs, indices, ETFs.
In the article, we will discuss horizontal support and resistance levels: how to draw them and how to use alongside simple indicators of tech analysis.
Let's get acquainted with the history of its appearance and development, its main statements and rules of Wave analysis.

On February 4th, Tesla stocks reached their all-time high of 969 USD per stock. What is such growth of Tesla stocks based on?