Trading with Heiken Ashi indicator
6 minutes for reading
In this article, we will discuss using an interesting Heiken Ashi indicator in trading. This indicator shows price movements on the chart in a more averaged way than a normal candlestick chart.
Why is Heiken Ashi interesting?
The Heiken Ashi (translated as "middle candlestick") indicator is just another way of representing the price chart as candlesticks, different from the popular Japanese candlesticks. In essence, it is an alternative way of drawing a price chart by averaging. The Heiken Ashi indicator features by many popular trading terminals, including MetaTrader 4 and MetaTrader 5.
This indicator was published in a journal for traders in 2004, after which traders started using it. The indicator is based on averaging fluctuations of the price in the previous timeframe. The indicator helps to eliminate unwanted market noise, shows the actual trend well, and helps to find reversal points.
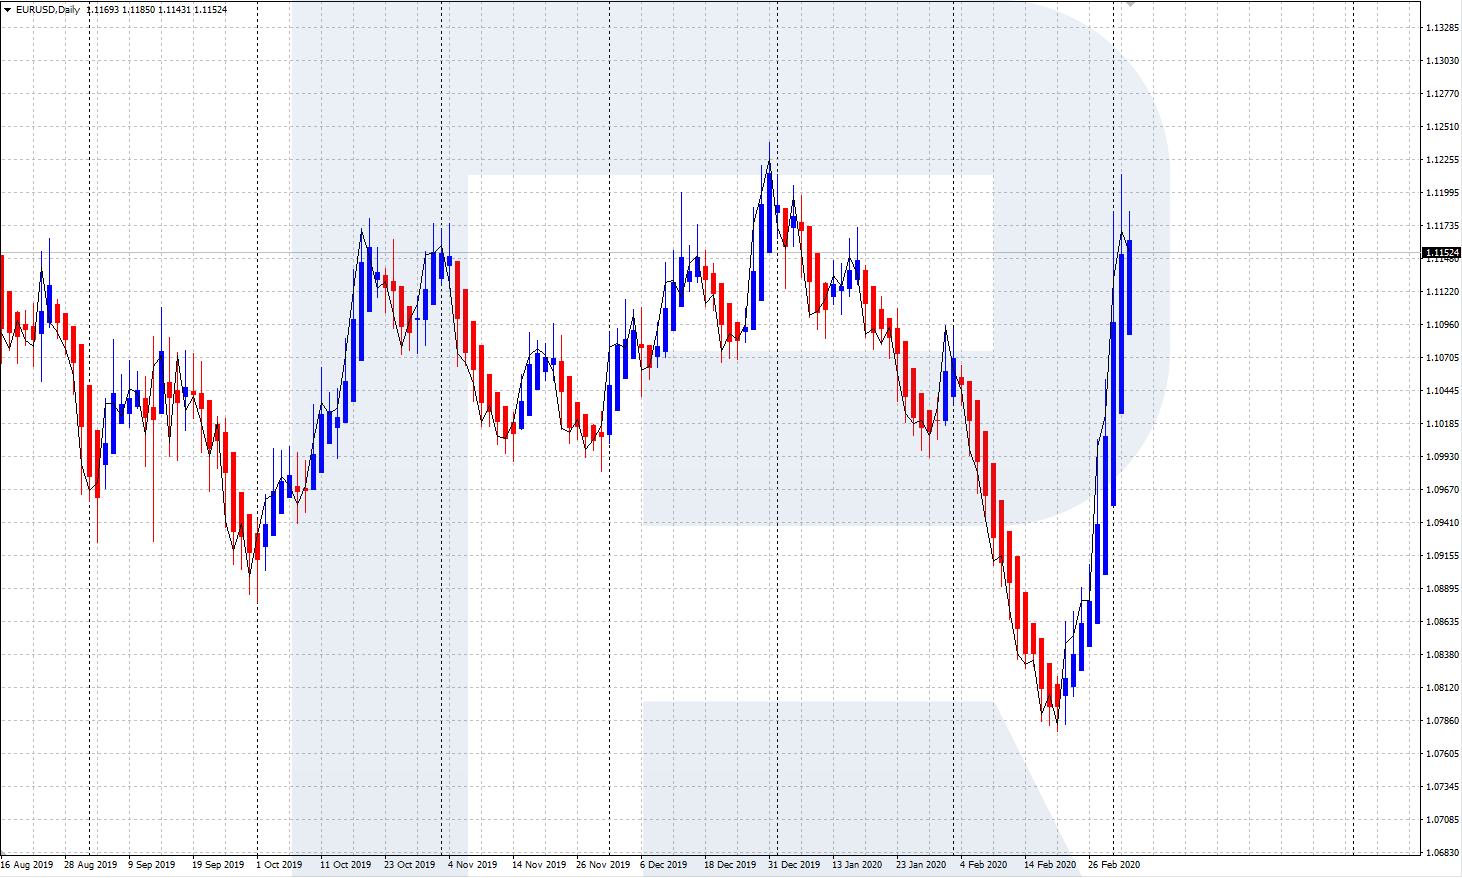
The charts drawn with Heiken Ashi look more smoothed compared to normal bars or Japanese candlesticks. On Heiken Ashi charts, we do not see minor shadows or gaps, only the most important information is shown, representing the current market situation. Heiken Ashi is a universal indicator, applicable to different financial markets: Forex, stock, goods, etc.
Heiken Ashi wipes off most lower shadows of bullish candlesticks and upper shadows of bearish ones. A series of large white candlesticks, usually lacking lower shadows, reveals an ascending movement on the market.
Conversely, a series of large bearish candlesticks with lower shadows means a downtrend. If the bodies of the candlesticks on the chart shorten, this signals a weakening of the trend and, possibly, an upcoming correction.
Parameters and settings of Heiken Ashin
In the popular trading platforms МetaTrader 4 and МetaTrader 5, the Heiken Ashi indicator adds to the chart via the Main menu: Insert - Indicators - User - Heiken Ashi. The Heiken Ashi candlesticks will be added to the current price chart. To avoid overlapping of the Heiken Ashi chart and the Japanese candlesticks chart, you can choose the linear price representation: then, on the chart, the Heiken Ashi candlesticks and a thin curved line of the price will only be reflected.
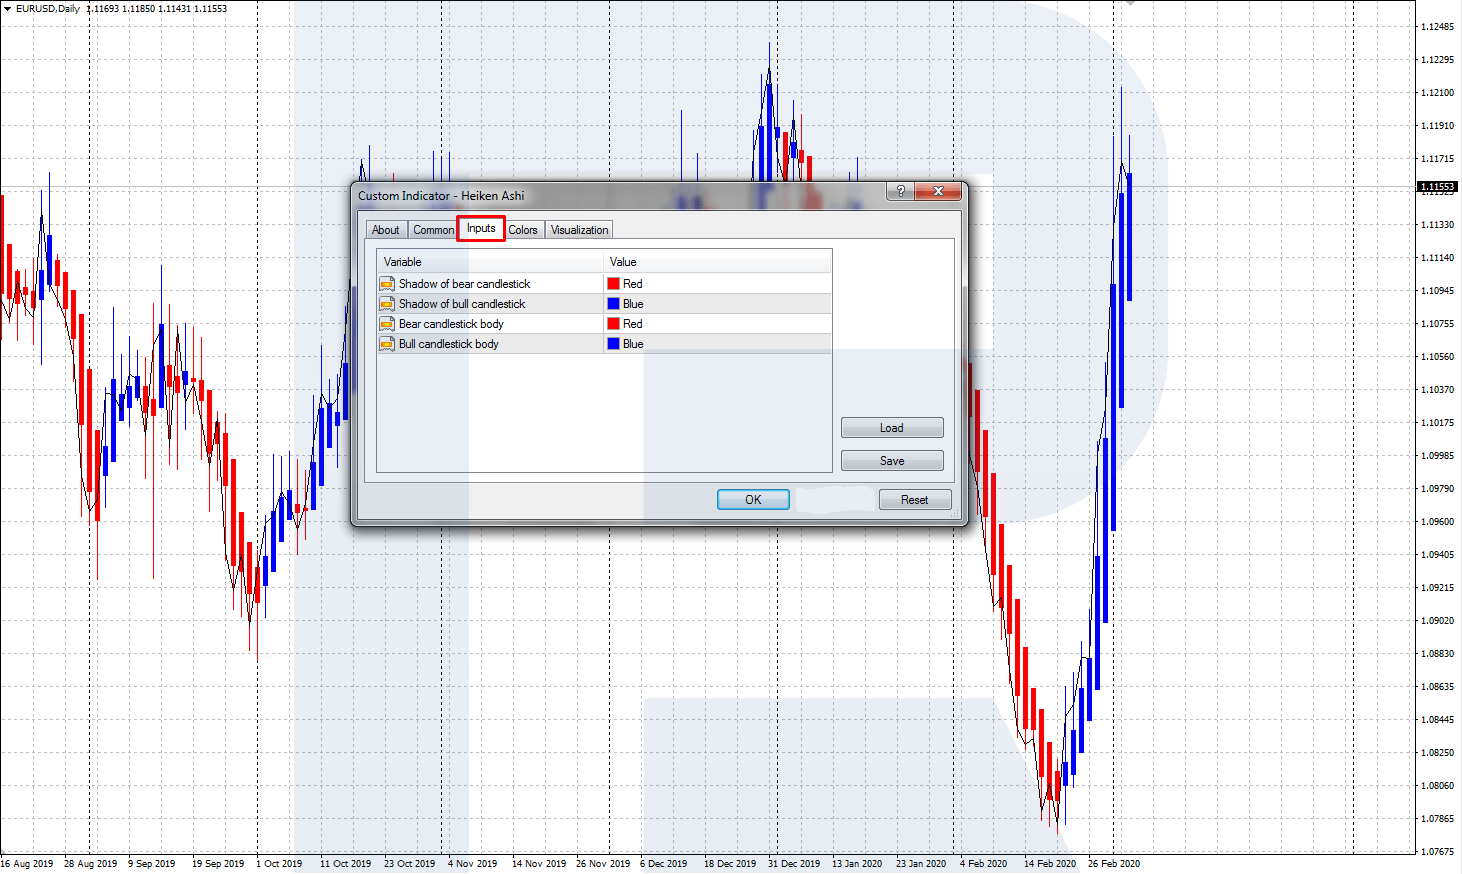
By default, the Heiken Ashi candlesticks colors are red and white: they will be poorly visible if the background color of the window is also white. You can choose the colors of bullish and bearish candlesticks, as well as their shadows via the settings window in Input Parameters. Candlesticks are drawn automatically, by a set algorithm.
The algorithm of calculating and drawing the candlesticks looks as follows:
- Open - the opening price of a new candlestick is the arithmetic mean of the opening and closing prices of the previous candlestick. The formula is haO ( n) = (haC (n-1) + haO (n-1)) / 2.
- Close - the closing price of the last candlestick is the arithmetic mean of the opening and closing prices and the max and min points of the current candlestick. The formula is haC ( n) = (O ( n) + H ( n) + L ( n) + C ( n)) / 4.
- Low is the smallest value of three prices: the minimal, opening, and closing ones. The formula is haL ( n) = min (L ( n), haO ( n), haC ( n)).
- High is the biggest value of three prices: the maximal, opening, and closing ones. The formula is haH ( n) = max (H ( n), haO ( n), haC ( n)).
In the formulae:
haC is the closing price of the current Heiken Ashi candlestick.
haO is the opening price of the current Heiken Ashi candlestick.
haH is the maximal price of the current Heiken Ashi candlestick.
haL is the minimal price of the current Heiken Ashi candlestick.
haC (n-1) is the closing price of the previous Heiken Ashi candlestick.
haO (n-1) is the opening price of the previous Heiken Ashi candlestick.
C ( n) is the closing price of the current normal candlestick.
O ( n) is the opening price of the current normal candlestick.
H ( n) is the maximal price of the current normal candlestick.
L ( n) is the minimal price of the current normal candlestick.
All these parameters are calculated automatically, and the Heiken Ashi chart is drawn by them. In the settings, you can only customize the color of the bodies and shadows of the candlesticks.
Trading with Heiken Ashi
The Heiken Ashi indicator, by averaging price fluctuations, shows well the direction of the current trend and signals as a possible reversal. To get trading signals, the Heiken Ashi chart is usually used along with other instruments, such as the tech analysis or other indicators.
Heiken Ashi + Stochastic
Let us discuss the trading signals given by Heiken Ashi + Stochastic:
Signal to buy
The signal forms when, after a lengthy decline, the Heiken Ashi candlesticks show a reversal upwards, while the Stochastic gives a signal to buy - escapes the oversold area. We open a buying position with a Stop Loss under the local low; the Profit may be closed after the Heiken Ashi candlesticks start reversing downwards.

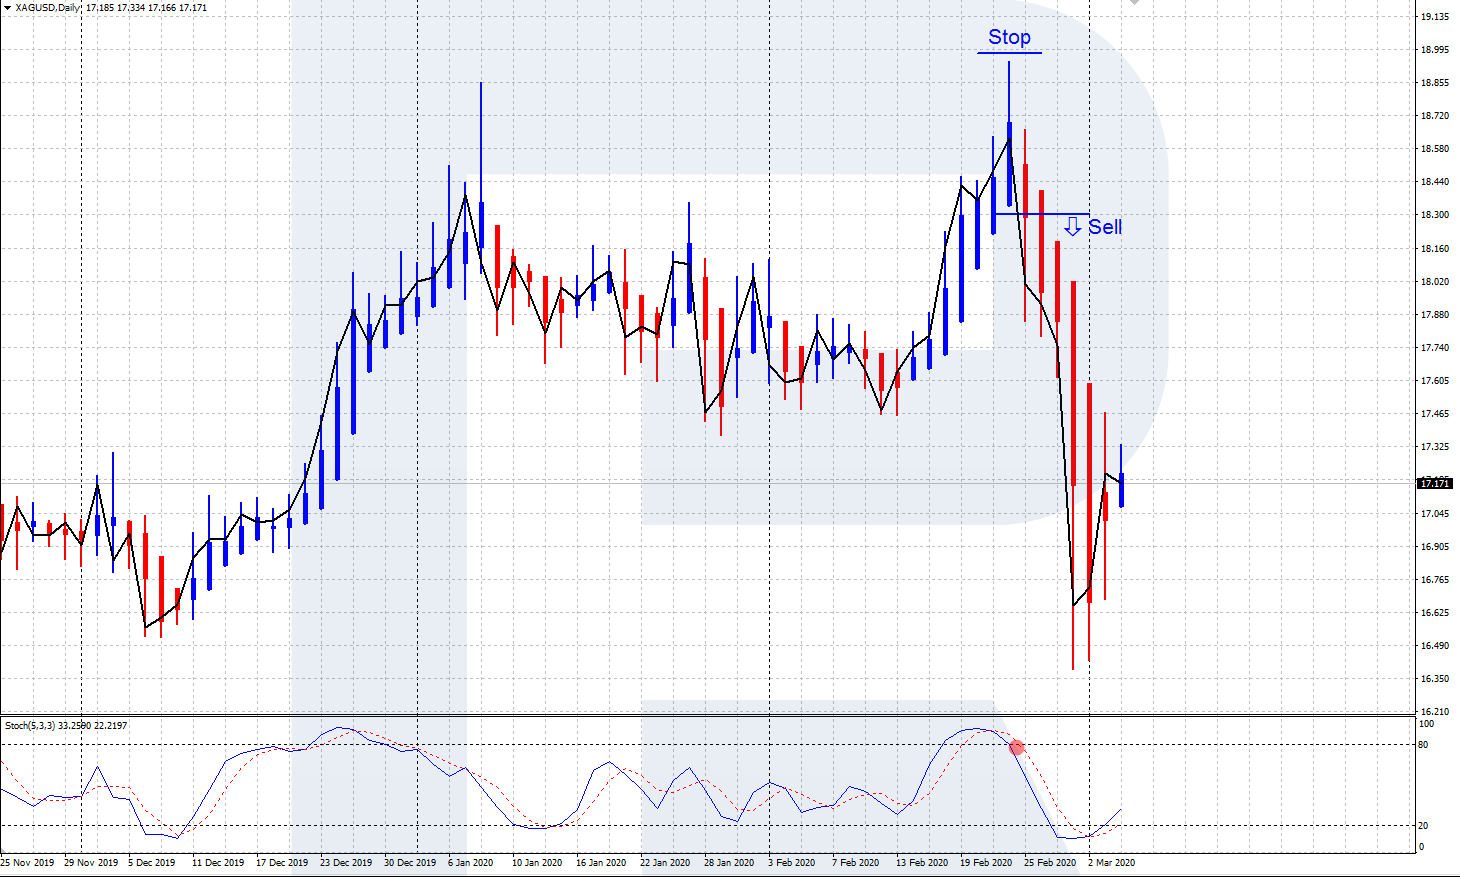
Signal to sell
The signal forms when, after lengthy growth, the Heiken Ashi candlesticks show a reversal downwards, while the Stochastic gives a signal to sell - escapes the overbought area. We open a selling position with a Stop Loss above the local high; the Profit may be closed after the Heiken Ashi candlesticks start reversing upwards.
Heiken Ashi + MACD
Heiken Ashi can also be used with the MACD:
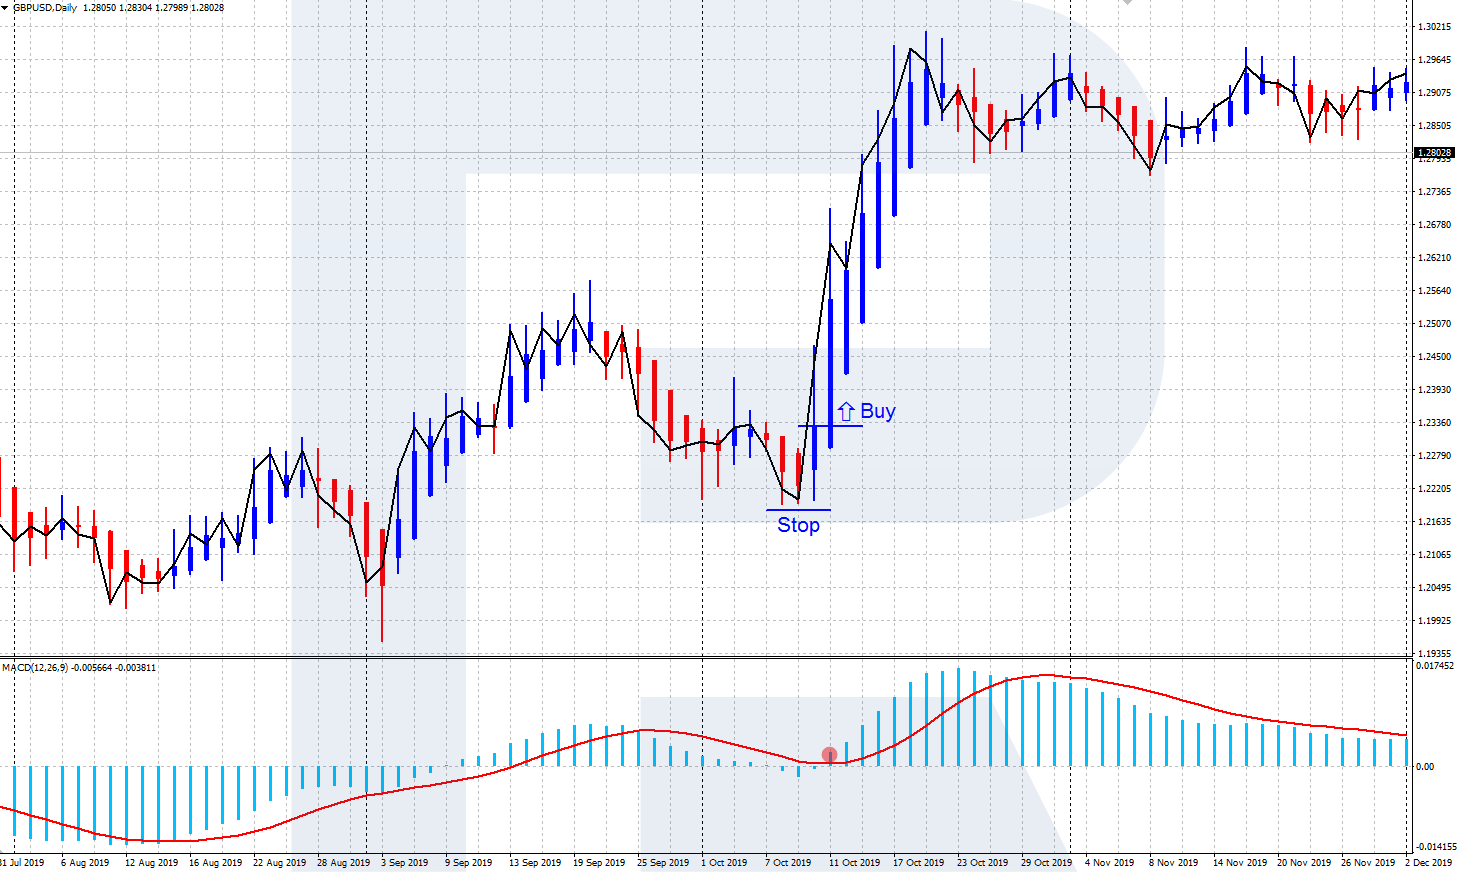
Signal to buy
When after a series of bearish candlesticks Heiken Ashi demonstrates a reversal upwards, and the MACD histogram starts growing, a signal to buy appears. We place an SL behind the local low of the price chart and lock in profit when after an upward movement the indicators show a reversal downwards.
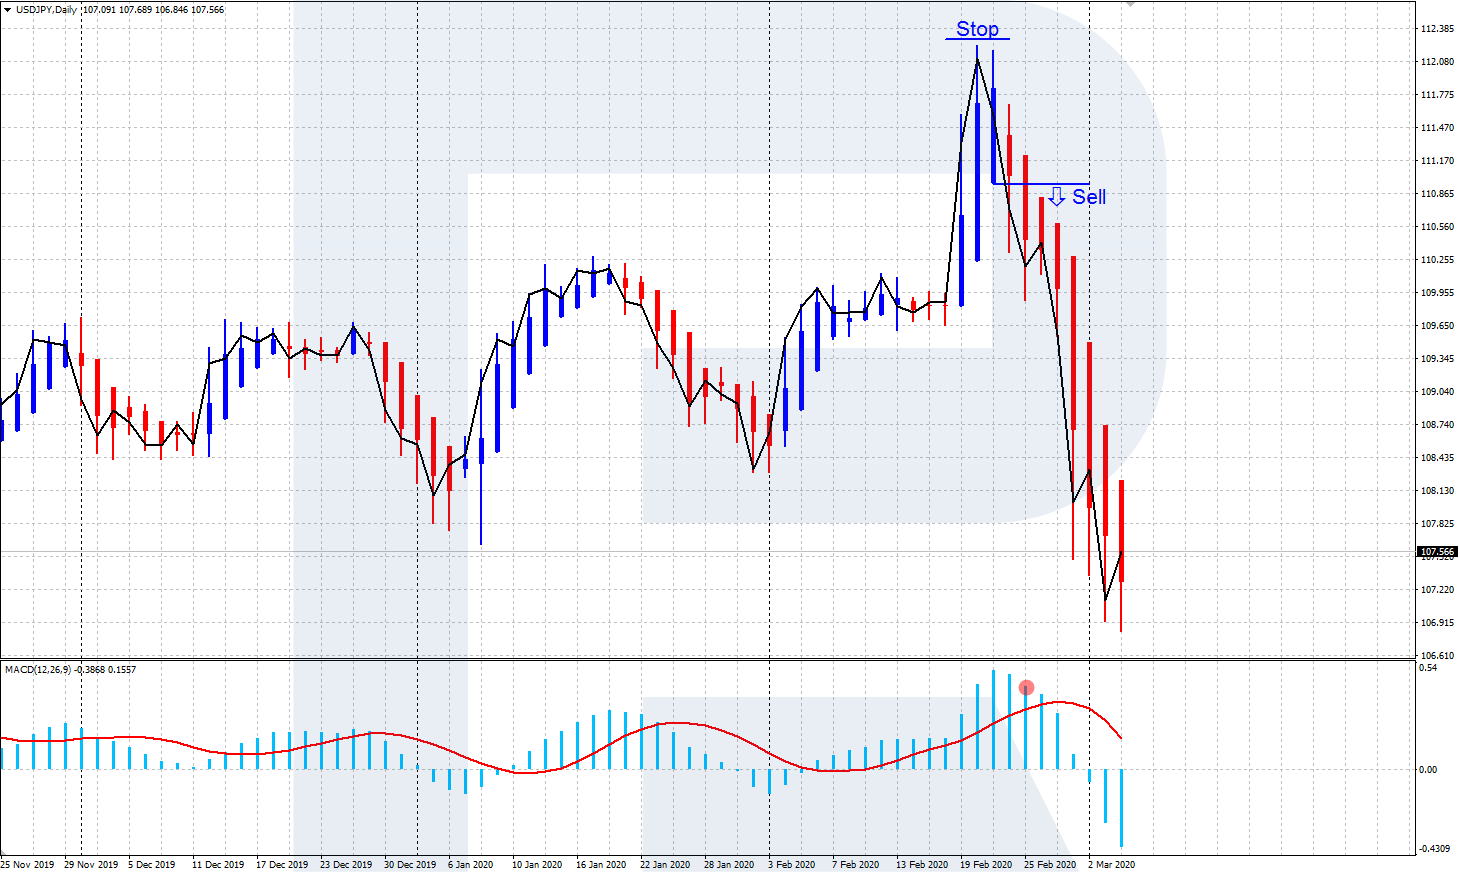
Signal to sell
When after a series of bullish candlesticks Heiken Ashi demonstrates a reversal downwards, and the MACD histogram starts declining, a signal to sell appears. We place the SL a bit higher than the local high and lock in profit when the indicators form a reversal upwards.
Closing thoughts
The use of the Heiken Ashi indicator may give the trader additional opportunities for successful trading. By averaging and smoothing the market noise, Heiken Ashi makes it easier to detect the direction of the trend helps to see possible reversal points on the chart.
However, it should be noted that Heiken Ashi is a lagging indicator. So, for more efficient work, it should be used along with other indicators or tech analysis.